M
ASTER OF
S
CIENCE IN
F
INANCE
M
ASTERS
F
INAL
W
ORK
P
ROJECT
E
QUITY
R
ESEARCH
:
IPO
V
ALUATION
-
E
SPÍRITOS
ANTOS
AÚDET
OMÁS
M
ÂNTUA DE
S
OUSA
B
ORGES
M
ASTER OF
S
CIENCE IN
F
INANCE
M
ASTERS
F
INAL
W
ORK
P
ROJECT
E
QUITY
R
ESEARCH
:
IPO
V
ALUATION
-
E
SPÍRITOS
ANTOS
AÚDET
OMÁS
M
ÂNTUA DE
S
OUSA
B
ORGES
S
UPERVISOR:
P
ROF.
D
R.
I
NÊSM
ARIAG
ALVÃOT
ELESF
ERREIRA DAF
ONSECAP
INTOIndex
1. Introduction ... 1
2. Literature Review ... 2
2.1. IPOs – Evidence and characteristics ... 2
2.2. IPOs – Valuation approaches ... 7
3. Preliminary considerations ... 9
4. Espírito Santo Saúde Overview ... 13
5. Country Profile ... 17
6. The Initial Public Offering ... 21
7. Valuation ... 23
7.1. Discounted Cash Flow ... 24
7.2. Comparable Multiples Analysis ... 32
8. Sensitivity Analysis... 33
9. Conclusion ... 35
10. References ... 36
11. Appendixes ... 38
Index of Figures
Figure 1 – EBITDA and Turnover by Segment...15Figure 2 – Key Performance Indicators: P&L...16
Figure 3 – Key Performance Indicators: Activity...16
Figure 4 – Public Health expenditure...19
Figure 5 – Private Health expenditure...20
Figure 6 – Individual Sensitivity Analysis...33
Figure 7 – Sensitivity Analysis overview...34
Figure A2 – Revenue Breakdown...39
Figure A3 – Estimated average life expectancy and Number of births...40
Figure A4 – Population over 50 years of age...40
Figure A5 – Population over 65 and 80 years of age...41
Figure A6 – Global Capital dispersion of the operation...42
Figure A7 – Stock performance vs. PSI 20 Index...45
Figure A8 – Joint Sensitivity Analysis...45
Index of Tables
Table 1 – Capital dispersion breakdown…...22Table 2 – Estimated Revenues...25
Table 3 – Forecasted Margins...…....26
Table 4 – Debt and Equity weights...29
Table 5 – WACC Parameters...30
Table 6 – WACC Output...31
Table 7 – Multiples Output: Data Set 1...33
Table 8 – Multiples Output: Data Set 2...33
Table 9 – Summary of results...35
Table A1 – Competitors and respective health units...39
Table A2 – Data Set 1: Bloomberg...43
Table A3 – Data Set 2: Mergermarket...44
Index of Equations
Equation 1 – Beta levered...28Equation 2 – Cost of Equity...28
Abstract
Initial Public Offerings take place once a company decides to become publicly traded. It is a way to raise funds in order to expand its business and also to get national and international exposure through capital dispersion.
This has been a controversial topic, primarily due to stock mispricing and due to market participants’ perceptions regarding the timing of going public, among other subjects.
The company under consideration is Espírito Santo Saúde – SGPS, SA which is a private Portuguese company in the healthcare sector. It provides medical services in Portugal, through hospitals, health clinics and also senior residences. The purpose of this project consists on providing the reader an introductory view to IPO-related topics, to present an additional valuation tool regarding the theoretical value of the company at the time of the IPO and also providing a price target for the year end of 2014.
A Discounted Cash Flow method and a relative valuation using comparable multiple ratios were considered in order to perform the valuation, alongside with a fundamental literature review and support.
Resumo
Ofertas Públicas Iniciais ocorrem quando uma empresa decide ser cotada em bolsa. É uma forma de angariar fundos, com o objectivo de poder expandir o seu negócio, mas também é um meio para obter exposição nacional e internacional por meio de dispersão do seu capital.
Este tem sido um tema controverso, sobretudo pela subjetividade na estabilização de um preço de oferta, bem como a perceção dos participantes do mercado relativamente ao “timing” de uma operação desta natureza, entre outros tópicos.
A empresa em questão é a Espírito Santo Saúde - SGPS, SA, uma empresa privada portuguesa no sector da saúde. A empresa fornece serviços médicos em Portugal, nomeadamente através de hospitais, clínicas de saúde e também residências sénior. O objetivo deste projeto consiste em presentear ao leitor uma visão introdutória de alguns temas relacionados com Ofertas Públicas Iniciais, apresentar uma ferramenta de avaliação adicional relativamente ao valor teórico da empresa na altura da operação e também projectar um preço-alvo para o final do ano 2014.
A quantificação do preço teórico da empresa foi feita de acordo com o método dos fluxos de caixa descontados e uma análise comparativa, usando vários rácios de empresas cotadas no mesmo sector. A presente avaliação foi realizada, tendo por base e suporte, uma revisão da literatura existente, relativamente aos temas de avaliação de empresas e Ofertas Públicas Iniciais.
1. Introduction
As a major player in the healthcare sector in Portugal, Espírito Santo Saúde is an international example of outstanding quality of services and constant innovation. The company decided to go public aiming to strengthen its financial position for future expansion and enhancing project investment, as well as to gain international exposure. In September 2013, Espírito Santo Saúde initiated its process to become a publicly traded company. This process ended in February 2014 with the company’s Initial Public Offer (IPO) and consequential listing on the Lisbon Stock Exchange (Euronext Lisbon).
The IPO under analysis consists on a partial sale of shares by previous shareholders, combined with the issue of new shares resulting from a capital increase. The capital increase is expected to raise between €22.5 and €27.4 million.
The work is structured in such way that the reader has a first insight at the literature review on IPO and valuation-related topics, secondly there is a general overview of the company, country and IPO operation; followed by the valuation part and finally we present a sensitivity analysis and conclusions.
This valuation evidences a price of €4.06 according to the Discounted Cash Flow method and an average price of €3.22 and €4.88 by performing a relative valuation for both data sets. We believe that, according to the achieved results, the IPO final offer price of €3.20 was undervalued and a potential corresponding stock price readjustment might be expected for the future.
2. Literature Review
A review of the existing literature is a crucial part of every work of this nature. It is an initial phase of the project where a considerable amount of time should be invested in order to have a solid theoretical background that supports the research project.
Initial Public Offerings (IPOs) have been in recent years a controversial topic of discussion among people in the financial area, with a great amount of literature already developed regarding this subject. The mispricing of shares by underwriters at the time of going public, as well as the timing of the IPO, constitute examples of topics subject to great debate.
Taking into consideration the next two main perspectives, this review was developed and acted as a guide to the subsequent study and valuation of Espírito Santo Saúde (hereafter ESS) IPO.
First, we collected specific literature on IPOs in order to understand identifiable characteristics of ESS, namely the first trading day performance, pre-issuance details, among other. Second, we aim also to identify the most frequently used techniques and assumptions, adopted by market participants when valuing IPOs, in order to make a practical valuation of ESS using methods that are in accordance with literature and practice.
2.1. IPOs – Evidence and characteristics
According to Deloof et al. (2009), one of the most researched topics in the IPO literature is underpricing. This practice is very common by underwriters and it serves
several purposes described by different authors (e.g. Daily et al. - 2005; Aggarwal - 2008; Chemmanur and Krishnan - 2012).
Underwriters are usually investment banks that support the operation of a company going public. The banks can act alone as the sole underwriter but it is more common to have a syndicate of banks that share the risks and tasks involved in such an operation and also increase the distribution network. It involves responsibilities such as marketing the IPO, help determine the offer price, assess and provide information regarding the market demand for the IPO, raise investment capital from investors and deliver the securities to the public via distribution network, among other (Corwin and Schultz, 2005).
Typically, the share performance on the first trading day plays an important role in the minds of investors, analysts and other stakeholders, which are eager to observe the difference between the offer and closing price. According to Eli Bartov et al. (2001), both prices are likely to reflect future perspectives of very disparate capital market participants.
Dailya et al. (2005) argue in their paper that investment banks may deliberately underestimate the value of a firms’ initial stock price. According to these authors, one of the main reasons for this practice is to ensure that there is sufficient demand to cover the IPO. Another reason is that a low offer price, will allow institutional investors to substantially benefit from the underpricing, enforcing the good relationship and continuous work relation between client and adviser.
Deloof et al. (2009) state that the stock market is pricing perspectives of the future and consequently it is assumed that stock prices reflect their fair value, which implies that, once the stock market is efficient, over/underpricing will be corrected in a rapid way (first trading days).
Still on this topic, Brau and Fawcett (2006) perform a survey analysis, where they conclude that there is strong support that underpricing exists primarily to compensate investors for taking the risk of investing in IPOs.
To what it concerns the reputation of underwriters, the authors Chemmanur and Krishnan (2012) discuss in their paper several theories affecting heterogeneous beliefs regarding underwriters and IPOs. They find that IPOs backed by high-reputation underwriters are priced higher and further away from the intrinsic value, when compared to low-reputation underwriters.
Fernando et al. (2012) agree by saying that high reputation underwriters obtain higher valuations for issuing firms. Additionally, non-price benefits play an important role in underwriters “reputational premia” by providing reputed syndicates of investment banks and top-star analysts to the IPO. Roosenbaum and Thomas (2007) conclude that more prestigious underwriters are associated with lower discounts (closer to fair value). Contrarily, Dellof et al. (2009) state that an offer price that is too high may severely damage underwriters’ reputation.
Given the previous conclusions, it becomes difficult to assess the importance and necessity of having well-known underwriters in the IPO process.
The final topic, regarding underpricing, has to do with two key findings by Lowry and Schwert (2004). The first conclusion of their work stresses the fact that underwriters do not fully incorporate publicly available information into the preliminary price range. The second finding points out that in a similar way, underwriters disregard some public information when they set the final offer price.
Both conclusions add a different and valuable perspective regarding information asymmetry. Nevertheless, it should be referred that this conclusion should be more common in markets where IPOs happen more frequently than in Portugal, like the United States for example.
Dailya et al. (2005) highlight the Signalling theory behind the performance of an IPO. This theory relies, as the name suggests, on preliminary events and perceived signals by investors, which occur before the shares of a company are publicly traded.
In a first phase of an IPO, a research work must be performed in order to evaluate the potential demand from institutional investors and other. The authors argue, as it appears to be intuitively obvious, that a weak demand in a first share allocation before the shares go public, gives origin to a weaker performance.
Agarwal et al. (2008) find a strong relation between IPOs’ pre-offering demand and aftermarket performance. IPOs with higher investor demand have large positive short-run returns but negative long-short-run excess returns. The IPOs with low investor demand tend to be over priced, according to their study on IPOs in the Stock Exchange of Hong Kong, between 1993 and 1997.
Going now further in detail, this literature review faces to a more specific research analysis, namely IPOs in the healthcare industry and sectorial characteristics.
Zigmond (2007) points out in her published paper that investors are attracted to companies in the healthcare sector because these companies follow a non-cyclical tendency. In the recent crisis, this is a major advantage for companies in this industry because, in a certain way, they are “recession-proof”, as she claims. An interviewee in this article says that during times of economic uncertainty, as the one we are living during the recent crisis, people will still spend their money in healthcare services. In the same paper, an interview to Ben Rooks, vice president of healthcare investment banking at William Blair in Chicago, says that it is a very large sector and “is only going in one direction as people get older”. This is a very important remark to have in mind since average life expectancy will tend to increase in perpetuity.
To contrast with the previous paper, Brau and Holloway (2009) claim that participants in healthcare issuances can anticipate poor long-run performances. This was empirically demonstrated by the authors through regression analysis, including explanatory variables such as size of the issuance, firm age, pre-issuance revenues, demand for the issuance, healthcare industry spending, among other.
Palkon (1999) criticizes the “creeping corporization” of the healthcare sector, namely the intensification of the “for-profit” movement and its consequences in this industry. This criticism translates in two important concerns, the first one being the lack of regulation and control that can affect this industry resulting in gross commercial exploitation. This could significantly harm consumers and generate difficulties towards
insurance companies. In such a scenario, a government intervention should occur. The second concern reflects the mentioned “for-profit” tendency, in which healthcare providers, namely hospitals, clinics and other, start providing only the most profitable services to patients. By doing this, healthcare providers focus only on those services that target the best paying patients, leaving the remainder to the non-profit providers. This would also have a severe impact on the society, affecting the quality of healthcare and giving bargaining power to providers.
2.2. IPOs – Valuation approaches
The purpose of this section is to assess what are the more common market practices when valuing IPOs.
Roosenboom (2007) states that techniques such as the Economic Value-Added method among other underwriter-specific methodologies, are not widely used to value IPOs.
“Discounted Cash Flows” (hereafter DCF) methods, dividend discount Models and valuation based on Multiples of similar firms, are the three prime methodologies used to determine the value of a company (Deloof et al. - 2009).
According to these authors, the valuation accuracy by investment banks defers from the accuracy measured by academics. This seems evident, however the reasons presented by the authors are interesting to have in mind before we proceed to the practical valuation of ESS. Value estimates by investment banks may be less accurate, comparing with academics that are more objective, because they can be tempted to
present valuations that justify high prices. Contradicting the previous thought, value estimates by investment banks may be more accurate than academics because investment banks have access to more information.
In this sense, we believe it should be beneficial to investors, to have both perspectives in mind when making investment decisions and not only from investment banks, disregarding academics.
DCF is the most popular method to value IPOs, according to the findings of the mentioned authors, however all underwriters use at least two different approaches. Multiples method is in most cases used by analysts to validate the DCF results and not as an independent valuation tool. The authors claim that one reason for this is that multiples valuation is of a static nature, whereas DCF methods are more dynamic by enhancing the incorporation of business environment variables.
According to Roosenboom (2007), underwriters do not seem to select valuation methods randomly based on previous habits but instead they adapt this choice based on variables such as industry circumstances, firm-specific factors, and aggregate stock market conditions. This author also identifies in his study including 228 IPOs that the most popular Multiples ratios used by underwriters are (in descending order): price-earnings, price-to-cash flow, enterprise value-to-price-earnings, enterprise value-to-sales, price-to-sales, and price-to-book value. He adds that on average, an underwriter selects 6.3 peer comparable firms.
Furthermore, Rosenbaum and Pearl (2009) identify the Enterprise Value-to-EBITDA and Price-to-Earnings ratios, as the more common since both incorporate two fundamental concepts, Equity Value and Enterprise Value.
Fernández (2001) presents the most commonly used multiples-ratios by industry, where valuations of companies in the healthcare sector according to this method, match with the same ratios presented by Rosenbaum and Pearl.
Koller et al. (2010) identify three requirements to keep in mind while performing a multiples analysis: 1) Using the right multiples; 2) Calculate the multiples in a consistent manner; and 3) Use the right peer group. These topics were a helpful guideline while performing the valuation of ESS.
3. Preliminary considerations
This section aims to hypothesize and describe observable occurrences involved in the IPO process, having in mind the previous review and contrasting with the performance of ESS shares in the first trading days.
ESS shares went public with an offer price of 3.20€ and declined more than 2.1% in the first trading day (3.13€). After five days, shares closed at 3.24€ representing a gain of 1.25% in relation to the offer price. On the following two and a half weeks, the stock showed no clear pattern direction, however after this stabilization period, shares remarkably rose in favour of investors, closing at 3.67€ on the last day of March, corresponding to an increase of 14.7% in relation to the first trading day.
Some important considerations should be taken into account when analysing the initial performance of ESS, namely in aspects related with the Signalling theory already mentioned. Signalling theory helps to understand perceived signals throughout the IPO process that may have influenced the performance on the first trading days. It influences the performance, based on various company-related signals perceived by investors that consequently can affect the shares’ behaviour at the time they start to be traded.
It is important to mention that we are analyzing an IPO that occurred through a “Book building” process.
According to Derrien and Womack (2003), the main difference between this system and other subscription mechanisms, lies on the underwriter’s role through all the stages of the process. The greater participation of underwriters starts by joining the issuer on a “road show” to market the offering to potential investors, which is a phase that does not occur in other subscription procedures, such as auctions. The price-setting influence is also higher through this mechanism according to the authors. Furthermore, underwriters conduct the share allocation to investors in a discretionary manner.
This process, among other characteristics different from auction subscriptions, does not set in advance the price at which the securities will be offered but instead gives a price range. It also differentiates in the sense that the demand for the securities can be known on a daily basis as the “Book” is being built through the registration of non
binding offers from investors. Only after the “Book-building” process is complete, will the final offer price be announced to the market.
Cornelli and Goldreich (2003) add that this subscription mechanism allows underwriters to extract pricing information while the book is being built, thus reaching a more precise offer price.
Among the several important concepts that were mentioned previously, the focus now turns to three of them: Offer price, price-range and demand.
These concepts are key aspects to take preliminary considerations regarding the IPO under analysis. Some possibilities were identified and theorized regarding this matter. The decrease of ESS shares on the first trading days may be partially explained by the offer price it was set. The offer price-range had a minimum value of 3.20€ and a maximum limit of 3.90€. At the end of the book-building process the final offer price was set at the price of 3.20€, the lower interval limit value. We believe this fact could have been negatively perceived by investors and contributed to the initial drop of the shares on the first trading days.
Another possible signal perceived by investors, has to do with the demand in the book-building process. A characteristic of this process, as already mentioned, is that it is possible to know the demand evolution on a daily basis. It was observable, during the subscribing period that lasted for two weeks, a weak demand for the stock under analysis. Two days prior to the end of the subscribing process, the investor coverage was at 86% of the available subscribing shares. This lack of enthusiasm by investors
may have been an additional negative signal, prior to the first trading day. It is important to mention that 7% of the shares in the IPO were destined to employees of ESS. The weak demand for shares by employees could have been interpreted by market participants as a lack of confidence in their own company’s future success. The fact that the IPO occurred on the 12th of February, one month before the announcement of the 2013 annual report (18 of March 2014), could also be negatively interpreted by investors, consequently affecting the initial performance. This interpretation hypothesizes that the company wanted deliberately to go public before the results were announced, giving the sense that the 2013 results were below expectations.
By settling the final offer price at 3.20€, ESS becomes valued at 306 million Euros. Steven Santos, manager of XTB Trading, commented in a news article interview that having in consideration this offer price and the trailing twelve-month Net Income until the end of the third quarter of 2013, the company will start to be publicly traded with a corresponding value multiple of more than 23 times its recording Net Income. The same manager argues that this multiple is overvalued in comparison with the European average of companies in this industry. It is our perception that this fact can be negatively interpreted by investors in the sense that the share price could suffer a price readjustment under market efficiency hypothesis.
As the IPO market is very modest in Portugal, there is a natural tendency to compare IPOs, regardless of the industry. The national postal service company of Portugal (CTT –
Correios de Portugal), went public on December 2013, also through a book building process. The performance of this IPO is instinctively compared with ESS, not only due to the low frequency of IPOs in Portugal but also because healthcare and Postal services represent atypical industries for investors in the Portuguese market.
CTT had a better start on the stock market than ESS. The first day closing price was 5.54€, representing a gain of 0.36%; nevertheless the shares registered a maximum trading value of more than 7.7% in the first trading day. The final offer price of the IPO was set at the maximum value of the interval (4.10€ - 5.52€) and the company raised about 25 thousand investors prior to being publicly traded. These facts contrast with the final offer price set at the lower limit (3.20€) and the 2,800 investors raised by ESS. Although being companies from two distinct sectors and with different ownership status (CTT is a public company), we form as our opinion that investors for the Portuguese market may perceive the mentioned observable facts in a more sensible way and thus contributing to justify the early underperformance of ESS.
4. Espírito Santo Saúde Overview
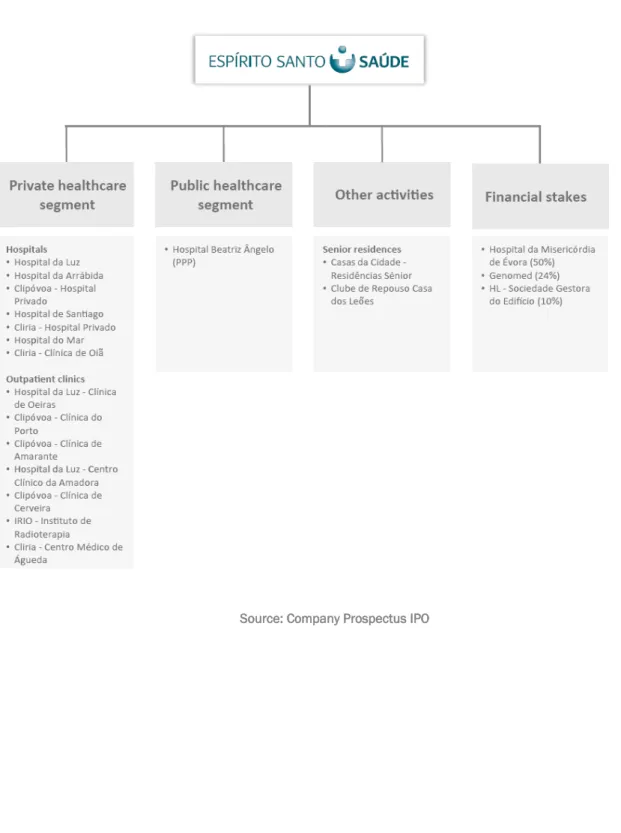
The company under analysis is a private healthcare services group and was established in 2000 aiming to become one of the leading providers of healthcare services in Portugal. ESS operates through 18 facilities comprising eight private general hospitals and one hospital under a public-private partnership agreement (hereafter referred to as “PPP”), seven private outpatient clinics and two senior
residences. The company has one of the broadest geographic footprints amongst private healthcare groups, by providing healthcare services in northern, central and south-central Portugal. Although having a wide national coverage, ESS has a significant fraction of its operations present in the Lisbon and Oporto areas. The current business segments of ESS can be viewed in annex 1.
The company assumes a commitment with clinical excellence by providing top of the line equipments, modern facilities and highly regarded physicians, supported by a dedicated and skilled team of healthcare professionals. Constant technological innovation is also embedded in the company’s values, focusing on providing the best clinical diagnostics and treatments. The group benefits from a determined and experienced management team, with the same unchanged CEO since the launch of the company (Isabel Vaz), aiming to continuously improve business units and enhancing of core business strategies.
The business model of ESS is organized in three main operational areas: i) Private segment, provided through general hospital units across the country as well as the outpatient clinics; ii) Public segment, through the PPP agreement of Hospital Beatriz Ângelo in Northern Portugal since 2012 and iii) Two Senior residences destined for individuals over 65 years old and who need medical assistance on a daily basis. The group also includes a Corporate Centre whose activity focuses on providing central support services to all units of the group.
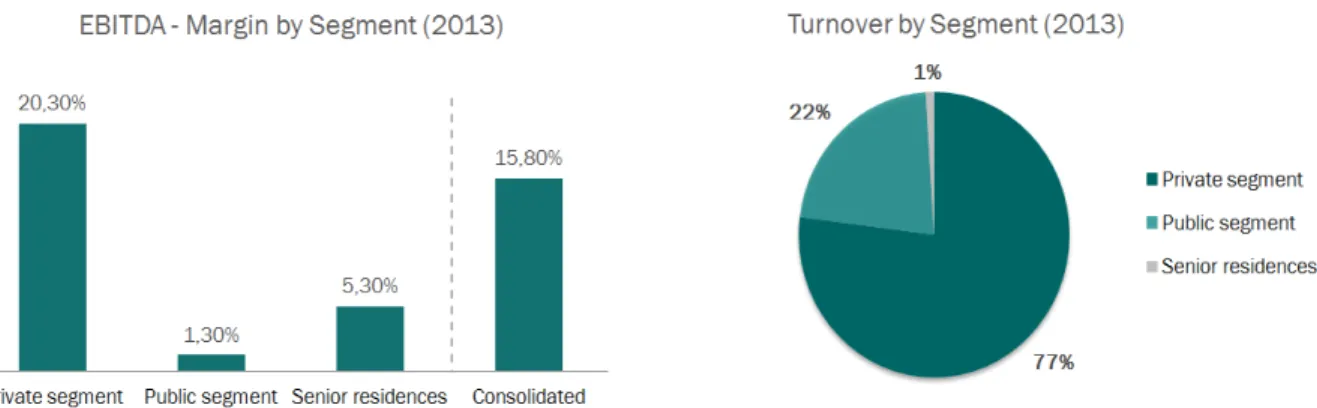
The following figures were introduced in order for the reader to have a general operational and financial overview of ESS. The next figure captures the dimension and contribution of each business segment for the group, considering EBITDA (Earnings Before Interest, Taxes, Depreciation and Amortization) - Margin and Turnover indicators:
EBITDA-Margin and Revenues in the Private Segment are considerably higher when compared with other segments. The Consolidated EBITDA–Margin includes non operational results concerning the Corporate Center and other.
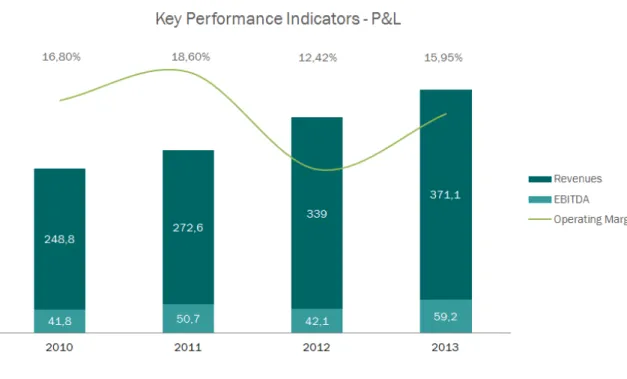
The next figures capture the operational evolution of ESS since the year 2010 comprising key performance indicators:
Revenues increased more than 120 Million Euros since 2010 while the EBITDA–Margin deteriorated in 2012, recovering in 2013 to reach 15.95%. Figure 3 illustrates in a very clear way the evolution of the operational activity of ESS. It is noticeable an increase in activity by the incorporation of the PPP agreement in 2012 regarding Hospital Beatriz Angelo, however this increase was accompanied by a fall in ESS margin as seen in figure 2, corresponding to the adaptation phase of the Hospital under the PPP program. By the end of 2013, ESS had approximately 9,000 employees.
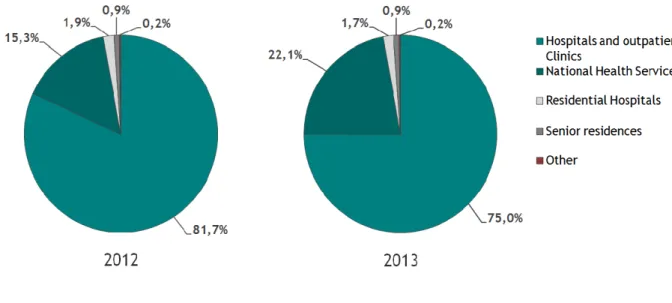
In order to have a better understanding concerning the revenues’ origin from ESS, a revenue breakdown was created and can be consulted in the Appendix section, comprising the years 2012 and 2013. The minor sources of revenue were practically unchanged from 2012 to 2013, however it is noticeable a considerable modification between the percentages of revenues originated from the National Health Services and privately owned Hospitals and outpatient Clinics (Revenue originated by the National Health Service represented 22.1% in 2013 vs. 15.3% in 2012). By being more exposed to the National Health Service in Portugal, additional risk could be perceived through more dependence and uncertainty of the country’s future outlook. This impact may also be positively interpreted as there may be room for new PPP agreements and new solutions with Government bodies concerning national health.
5. Country Profile
This section intends to provide a brief description of the healthcare sector and the demographic and sociological climate in Portugal through the recent years.
The healthcare sector in Portugal comprises three main coexisting systems: the National Health Service (NHS); public and private insurance schemes for certain professions (health subsystems); and private health insurance.
The main subsystems comprising certain professions are: ADSE (public workers); ADM (military); SAD-PSP (police officers); SAMS (banking and insurance workers), among other.
The private healthcare sector comprises five main players - Galilei, ESS, José de Mello, Lusíadas and Trofa - with different dimensions and business areas. A brief overview concerning the five players’ business units is provided in the Annex section.
Recent adverse macroeconomic conditions had severe impacts across Europe, particularly in Portugal. The recent crisis forced proper adjustments in terms of Government spending, with a generalized expenditure reduction. The budgetary deficit had impact in several areas, namely in the public healthcare system, resulting among other consequences in: higher social inequality and access to health services, lack of investment in modernizing healthcare facilities and technology, physicians’ dismissals and salary reduction. The previously described reality gives origin to programs such as PPP agreements, representing advantageous solutions for the State and tax payers while benefiting Private healthcare companies such as ESS.
The next graph shows the evolution of Public health expenditure as a percentage of total health expenditure.
Figure 4 – Public expenditure; Source: World Health Organization
Healthcare subsystems affect specific professions and are funded through employee and employer contributions as well as from the State which acts as employer, contributing with a minor part.
The National Health Service (NHS) is a universal government program which aims to provide public healthcare services to all resident citizens and is mostly funded through taxes (90%). It is the main healthcare providing structure, integrating a vast network of public hospitals and care centers. Budgetary constraints impacted significantly the health plans of state employees by requiring them to bear a higher stake of the respective cost, reducing the gap between public and private insurance schemes. With higher contributions being necessary regarding health plans of state employees and affecting directly household incomes, it is expectable that many will not retain these programs but instead opt for private healthcare insurance. As ESS has agreements with most private health insurance companies, the transfer form public to private health insurances explained before, will naturally benefit ESS with an expected increase in the number of patients.
It is however estimated that more than 4.2 million Portuguese have double healthcare coverage in relation to the NHS (Source: Company Report – 2013). To complement, it is observable through the following figure that Portuguese families are increasing expenditures with healthcare services.
Figure 5 – Private expenditure; Source: INE (National Statistics Institute)
Demography in Portugal is characterized by a high number of elder people, resulting from an increase in the average life expectancy and decrease in live births as it can be verified by the following figures present in Annex 3. Population aged over 50 is increasing rapidly. By the end of 2013, 39.8% of the population was over 50 years of age (Source: INE).
To summarize, there are several medium to long-term trends that are expected to have impact on healthcare providers such as ESS. Among other, the most relevant ones are: i) The shift from public insurance to private insurance schemes; ii) An aging population; iii) Increase in private households healthcare expenditures; iv) Room for PPP agreements; v) Available medical procedures through technological innovation.
6. The Initial Public Offering
Part six of the research project intends to give to the reader a general overview of ESS IPO process.
The IPO under analysis was a combined operation of an essential share capital increase and a sale of shares by previous shareholders. By reducing the indebtedness level of the company and consequent strengthening of the balance sheet, this operation aims at substantially improving the financial position of ESS and enable flexibility for future investments. Given the established price interval (3.20€ - 3.90€), the operation is expected to raise gross proceeds between 22.5€ and 27.4€ million. The selling shareholders of ESS were:
1. Companhia de Seguros Tranquilidade (“Tranquilidade”); 2. Espírito Santo Financial Group (“ESFG”);
3. Rio Forte Investments (“Rio Forte”);
4. Espírito Santo Healthcare Investments (“ESHI”).
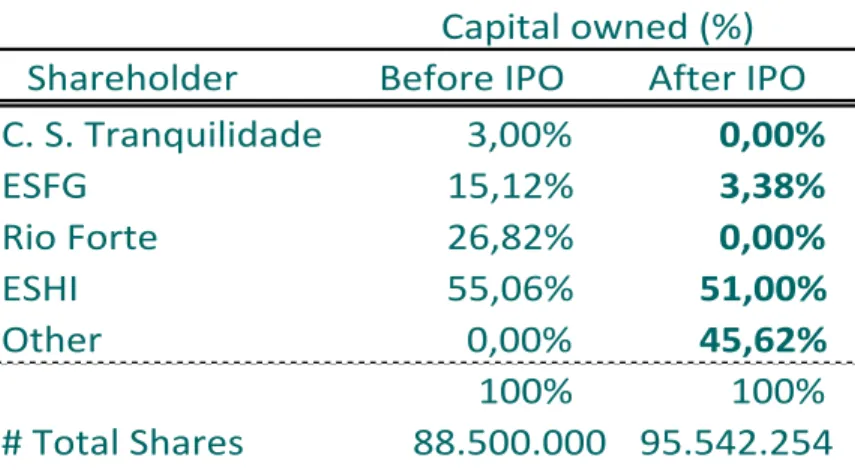
Tranquilidade is one of the largest non-life insurance companies in Portugal and is a subsidiary of ESFG. ESHI is 55% held by Rio Forte, the holding company of the Espírito Santo Group for its non-financial investments, which is respectfully owned by Espírito Santo International. The company decided to free float only 49% of its capital on the market, being the remaining 51% controlled by its main shareholder Espírito Santo Healthcare Investments. The next table is an outlook of the shareholders structure development, prior and after the IPO.
Shareholder Before IPO After IPO C. S. Tranquilidade 3,00% 0,00% ESFG 15,12% 3,38% Rio Forte 26,82% 0,00% ESHI 55,06% 51,00% Other 0,00% 45,62% 100% 100% # Total Shares 88.500.000 95.542.254 Capital owned (%)
Table 1 – Capital dispersion breakdown; Source: Company Prospectus IPO; own calculations
It is observable that Tranquilidade and Rio Forte liquidated their position on ESS and ESFG decreased a considerable amount. ESHI maintained 51% control of the company and 7.042.254 new shares were issued.
Espírito Santo Investment Bank (an affiliate of certain shareholders of the company) and Credit Suisse are the joint Global Coordinators and Joint bookrunners of the IPO. Regarding the Institutional Offering, there are several Spanish and Portuguese banks involved, however Crédit Agricole acts as Senior Co-Lead Manager.
The global offering is divided in two tranches, Public and Institutional. The public tranche comprises the sale of shares currently held by the mentioned shareholders and a capital increase through the issue of 7,042,254 new shares. The corresponding allocation of each segment is 2.43% and 7.37% respectively. This tranche accounts for 9.8% of total share capital and targets 3.43% at employees and the remaining 7.37% at retail investors. The institutional tranche contains 39.2% of total share capital, already including the Greenshoe feature (Additional lot of 6,106,396 shares,
corresponding to 6.4%). The capital dispersion of the global operation is illustrated in annex 2.
Clawback and Clawforward clauses were included, allowing shifting shares from the
retail to the institutional investors or vice versa. This shift occurs in cases of low demand, by transferring part of the lot destined to a specific segment to other investors who wish to gain more exposure.
The lot destined at employees exhibited a very low demand with only 0.53% of available shares being subscribed from a total available of 3.43%. As a result from the low demand, the remaining 2.9% corresponding to 2,774,940 shares were transferred to retail investors. After the IPO, 49% of ESS share capital was dispersed in the following way:
39.2% - Institutional investors 9.27% - Retail investors 0.53% - ESS employees
The operation under analysis comprised approximately 2,800 investors with 87.5% of the institutional investors coming from Europe (UK 53.2%; Portugal 15.9%; Spain 11.6%; other 6.8%) and the remaining from the United States. The operation is expected to generate expenses between 1.6 and 1.8 million Euros.
7. Valuation
We now proceed to the valuation of ESS which comprises a Discounted Cash Flow analysis (DCF) and a relative valuation using peer companies’ multiples. Assumptions
and results concerning both valuation techniques are showed in the following corresponding sections.
7.1. Discounted Cash Flow
This technique consists on estimating future Cash Flows of the company and discounting them at the Weighted Average Cost of Capital (WACC) so as to achieve the present value of the firm. Several assumptions were adopted in order to forecast future cash flows, namely in terms of revenues, operating margins, working capital requirements, capex and depreciations and amortizations.
Revenues were individually estimated for Public clients, Private clients and Other activities (e.g. services between companies of the parent, commercial spaces and pharmacies present in the facilities owned).
i) Revenues from the Private segment grew 5.7% in 2012 and 0.9% in 2013. For the year-end of 2014, the average of the two previous years was assumed (3.3%). For the following years the company is expected to expand some of its current units, namely
Hospital da Luz, Hospital da Arrábida and Hospital da Luz-Clínica de Oeiras.
Unfortunately the completion dates for the expansion projects are not known, whereby a constant rate of 5% growth was assumed until 2020. The applied growth rate is perceived to be a modest conservative approach, as ESS will benefit from the mentioned expansion projects cooped with a gradual increase of aged population.
ii) State budget constraints and recent decreases in health expenditures by the Government may originate more projects under PPP models. It is therefore assumed
that ESS will benefit from this scenario, generating more revenues and benefiting from new possible solutions and models through strict interactions with Government bodies. As the only available growth rate for this business segment is 57%, corresponding to the second year of activity, we cannot take a decision based on previous observations. In this sense it is assumed a conservative growth rate of 3% for 2014, corresponding to the third consecutive year of operations in Hospital Beatriz Ângelo under the PPP agreement. In the following year it is proposed a 1% increase reflecting a growth rate of 4% and for the period 2016-2020, a 7% constant yearly growth rate was assumed, reflecting five years of a more intense period with new business activities copped with an intensification of operations at Hospital Beatriz Ângelo.
iii) The segment of other activities was forecasted as a percentage of revenues from the Private sector. These activities are historically fairly stable and corresponded to 1.0% of Private revenues in 2011, 1.0% in 2012 and 1.2% of Private revenues in 2013. It was assumed a constant percentage of 1.2% of Private revenues for the forecasted period. The next table shows the forecasted revenues and adopted rates.
Estimated Revenues 2014 -2020 Revenues 2011 2012 2013 2014 2015 2016 2017 2018 2019 2020 Private Healthcare 270.8 286.3 288.8 298.4 313.3 328.9 345.4 362.6 380.8 399.8 Growth rate (%) 5.7% 0,9% 3.3% 5% 5% 5% 5% 5% 5% Public Healthcare 52.2 82.1 84.5 87.9 94.1 100.6 107.7 115.2 123.3 Growth rate (%) 57.2% 3% 4% 7% 7% 7% 7% 7% Other activities 2,7 2,9 3,5 3,6 3,8 3,9 4,1 4,4 4,6 4,8 % of Private Revenues 1,0% 1,0% 1.2% 1.2% 1.2% 1.2% 1.2% 1.2% 1.2% 1.2% Total Revenues 273.5 341.2 374.3 386.5 404.9 426.9 450.2 474.7 500.6 527.9
Table 2 – Estimated Revenues; Source: own forecasts and calculations
Before entering the PPP agreement, ESS’s margin was 17.53%. In 2012, with the opening of Beatriz Ângelo Hospital, the margin decreased significantly to 12.06%, certainly due to initial managerial problems and adaptation issues. However ESS was able to recover from this downside on the following year bringing the margin back to 15.69%. We believe this resulted from better management and synergic benefits from the partnership. For the year-end of 2014 it is anticipated a margin improvement of 0.25%, reaching an EBITDA-margin of 15.9% which is line with the observed average EBITDA-margin for US companies in the Healthcare Facilities sector (15.79%), according to Aswath Damodaran database.
By anticipating the implementation of new business activities in partnership with the Government, it is also foreseen a drop in ESS margin based on the current PPP agreement. Given the previous rationale it is proposed successive drops of 1% in the margin for the years 2015, 2016 and 2017, reaching an EBITDA-margin of 12.9% in 2017. Gradual margin increases are subsequently introduced, so as to reflect synergetic business improvements. Assumptions are reflected in the following table.
Capital expenditures were forecasted as a percentage of revenues. In 2011 before the beginning of the PPP agreement, Capex/Revenues ratio was 2.7%. It was forecasted a ratio of 3% for the year 2014, slightly below the realized ratio in 2013 (3.3%). As it is
2011 2012 2013 2014 2015 2016 2017 2018 2019 2020
EBITDA-margin 17.53% 12.06% 15.67% 15.92% 14.92% 13.92% 12.92% 13,92% 14,72% 15,22% Estimated Variations -5,47% +3,6% 0,25% -1,0% -1,0% -1,0% 1,0% 0,8% 0,5%
Table 3 – Forecasted Margins; Source: own forecasts and calculations
forecasted the development of new healthcare agreements with the Government as well as the expansion of several current units, it was assumed a constant capex-to-revenue ratio of 3.5% for the period 2015-2018, reflecting the uncertainty concerning the timing of the investment activities. In 2019 the ratio starts gradually to return to lower levels, reflecting a slowdown in capex achieving a 3% ratio and decreasing to 2.8% in 2020.
Annual Depreciations and Amortizations were estimated by the moving average of the preceding three-year period for each year.
Working Capital expenditures assume a growing pattern along the forecasted period. In 2013, working capital amounted to 0.9 Million Euros (0.3% of revenues), which is an exceptionally low value when comparing to the previous year where it registered 7.9 Million Euros (2.3% of revenues).1 As an assumption it is proposed that working capital represents 1% of revenues in 2014, growing 0.5% each subsequent year, reflecting increases in working capital needed to balance anticipated operations with the Government and other operational activities concerning the expansion of health units.
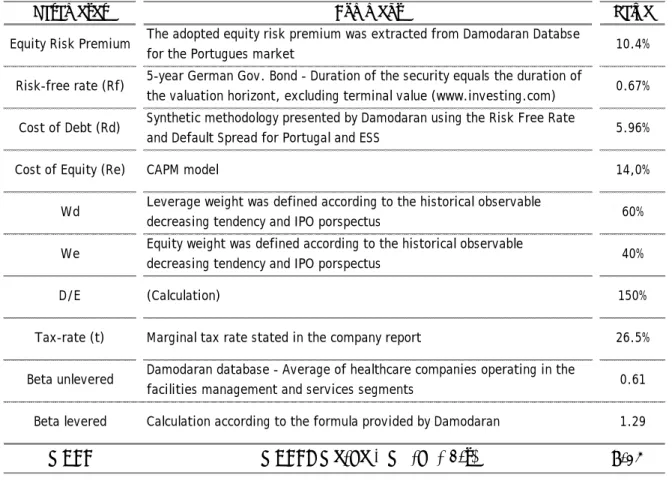
Regarding the Weighted Average Cost of Capital, used to discount future cash flows in order to achieve the present value, this rate is calculated by taking into account five different components: cost of equity, cost of debt, tax rate and debt and equity weight structure.
The Cost of Equity was computed through the Capital Asset Pricing Model and is composed of three different parameters; the Risk-free rate, the equity risk premium and the levered beta of the company. Damodaran (1999) argues in his paper that it is a good valuation practice to match the time horizon of the cash flows with the duration of the risk free security. Data for the risk free rate was collected from the internet database website “investing” with respect to the 5-year German Government Bond on the 28th of February 2014. The equity risk premium and the unlevered beta were retrieved from Damodaran database. The unlevered beta was computed as the average value for companies present in the healthcare sector, namely in facilities and services segments. The following formulas were used to calculate the levered beta of the firm and the cost of equity, respectively the formula provided by Damodaran for the levered beta and CAPM formula for the cost of equity:
𝛽� = 𝛽�∗ (1 + (1 − 𝑡) ∗��) (1) 𝑅� = 𝑅�+ 𝛽�∗ (𝑀𝑎𝑟𝑘𝑒𝑡 𝑅𝑖𝑠𝑘 𝑃𝑟𝑒𝑚𝑖𝑢𝑚) (2)
The adopted tax rate, applied in the calculation of the levered beta and also in the cost of capital is the marginal tax rate of 26.5%.
Regarding the cost of debt, the rate was estimated according to a synthetic methodology created by Damodaran and is computed as the sum of the Risk-free rate, the Country Default Spread and the Company Default Spread. The methodology aims to determine a synthetic default spread based on the company’s interest coverage ratio, which then corresponds to a certain estimated default spread based on a data set
developed by Damodaran, available on the author’s internet site. The utilized formula is as follows:
𝑅� = 𝑅�+ (𝐶𝑜𝑢𝑛𝑡𝑟𝑦 𝐷𝑒𝑓𝑎𝑢𝑙𝑡 𝑆𝑝𝑟𝑒𝑎𝑑) + (𝐶𝑜𝑚𝑝𝑎𝑛𝑦 𝐷𝑒𝑓𝑎𝑢𝑙𝑡 𝑆𝑝𝑟𝑒𝑎𝑑) (3)
ESS had an interest coverage ratio of 3.6 in 2013, which corresponds to a BB+ rating and has an associated default spread of 3%. The country Default Spread is assumed to be the CDS (Credit Default Swap) for Portugal on the 28th of February, obtained from Bloomberg database (229 basis points). By summing the three components we achieved a pre-tax cost of debt of 5.96%.
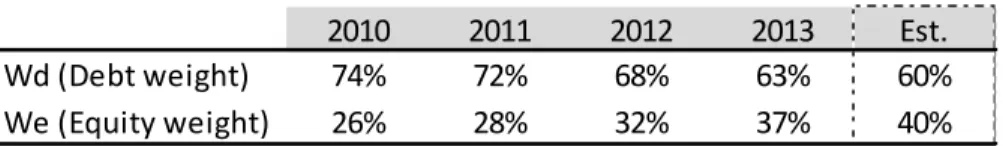
The weights for debt and equity were estimated based on previous observed capital structure and also based on qualitative information present in the IPO prospectus. The following table illustrates ESS weights for the last four years:
One of the reasons for the occurrence of the IPO is the desire to reduce the indebtedness level in order to improve the financial position of the company, enhancing flexibility for future investments. Based on the previous deliberation and the observed decreasing tendency in the capital structure through the table above, it is assumed a constant long term capital structure of 60% Debt and 40% Equity for the computation of the WACC rate.
2010 2011 2012 2013 Est.
Wd (Debt weight) 74% 72% 68% 63% 60%
We (Equity weight) 26% 28% 32% 37% 40%
Table 4 – Debt and Equity weights, Source: own forecasts and calculations
Through the previous assumptions and calculations it was possible to achieve a weighted average cost of capital of 8.24% for ESS.
The following table is presented, so as to demonstrate in a concise manner the several assumptions used to estimate the components for the cost of capital calculation.
Table 5 – WACC Parameters; Source: Own calculations and forecasts
The DCF valuation encompasses a terminal value cash flow, which includes a forecasted constant growth rate (g) for the company. This value represents 74% of the achieved Enterprise Value by considering a 2% constant growth rate. The adopted growth rate of 2% was estimated according to two sources of information: a healthcare study conducted by the consulting firm Deloitte and the European Central Bank (ECB).
Parameter Comment Value
Equity Risk Premium The adopted equity risk premium was extracted from Damodaran Databse
for the Portugues market 10.4%
Risk-free rate (Rf) 5-year German Gov. Bond - Duration of the security equals the duration of
the valuation horizont, excluding terminal value (www.investing.com) 0.67% Cost of Debt (Rd) Synthetic methodology presented by Damodaran using the Risk Free Rate
and Default Spread for Portugal and ESS 5.96%
Cost of Equity (Re) CAPM model 14,0%
Wd Leverage weight was defined according to the historical observable
decreasing tendency and IPO porspectus 60% We Equity weight was defined according to the historical observable
decreasing tendency and IPO porspectus 40%
D/E (Calculation) 150%
Tax-rate (t) Marginal tax rate stated in the company report 26.5% Beta unlevered Damodaran database - Average of healthcare companies operating in the
facilities management and services segments 0.61 Beta levered Calculation according to the formula provided by Damodaran 1.29
In the study conducted by the consulting firm, “2014 Global health care outlook”, it is stated that for Western Europe it is expected an annual average growth rate in health care spending of two percent for the period 2013-2017.
Regarding the ECB pursuit towards price stability, the Governing Council is committed to maintain inflation rates below, but close to two percent over the medium term. In this sense, by prolonging the considered period of Deloitte’s study and by taking ECB’s inflationary policy target, we believe that both sources combined justify a coherent growth rate of two percent for the applicable future of ESS.
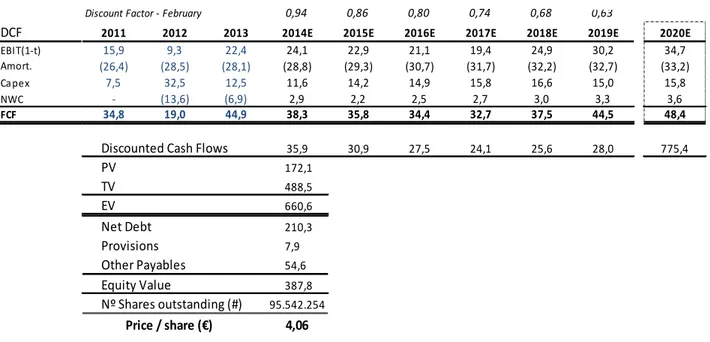
We now present the output for the Discounted Cash Flow valuation:
Table 6 – WACC Output; Source: DCF own calculations and forecasts
After discounting the cash flows and the terminal value, we subtract the net debt, provisions and other payables of the company so as to achieve the Equity value. By dividing the equity value by the total amount of shares outstanding we reach the price
Discount Factor - February 0,94 0,86 0,80 0,74 0,68 0,63
DCF 2011 2012 2013 2014E 2015E 2016E 2017E 2018E 2019E 2020E
EBIT(1-t) 15,9 9,3 22,4 24,1 22,9 21,1 19,4 24,9 30,2 34,7 Deprec. & Amort. (26,4) (28,5) (28,1) (28,8) (29,3) (30,7) (31,7) (32,2) (32,7) (33,2) Capex 7,5 32,5 12,5 11,6 14,2 14,9 15,8 16,6 15,0 15,8 NWC - (13,6) (6,9) 2,9 2,2 2,5 2,7 3,0 3,3 3,6 FCF 34,8 19,0 44,9 38,3 35,8 34,4 32,7 37,5 44,5 48,4 Discounted Cash Flows 35,9 30,9 27,5 24,1 25,6 28,0 775,4
PV 172,1 TV 488,5 EV 660,6 Net Debt 210,3 Provisions 7,9 Other Payables 54,6 Equity Value 387,8 Nº Shares outstanding (#) 95.542.254 Price / share (€) 4,06 € millions
per share. The conducted valuation exhibits an estimated price of 4.06€ per share at the time of the IPO. The achieved price is 27% higher than the true offer price of 3.20€ and 4.1% higher than the upper interval limit. By discounting cash flows to December, we reach a price target of 4.53€ for the year end of 2014.
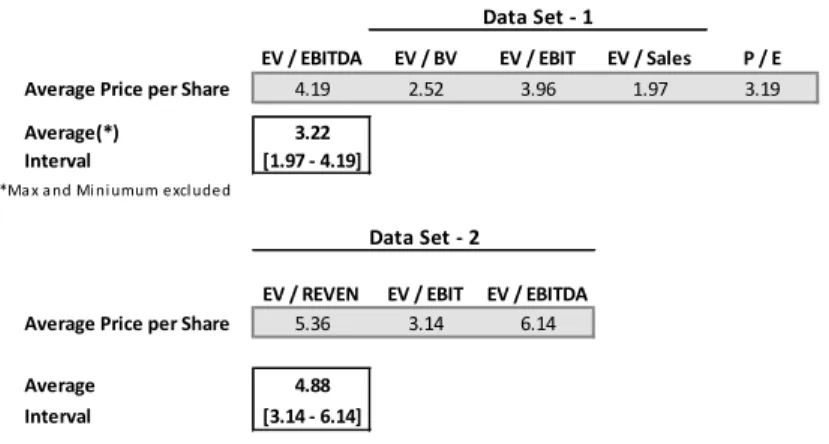
7.2. Comparable Multiples Analysis
This subsection intends to apply a secondary valuation approach to determine the share price of ESS. This methodology consists on gathering financial information from comparable firms and use it to value the target company. We focus on two specific types of data: the first set of data concerns information retrieved from Bloomberg database, where financial multiples from 22 comparable companies were extracted in order to perform our analysis. The companies present in the first dataset were filtered and retrieved according to the Global Industry Classification Standard (GICS) developed by MSCI (Morgan Stanley Capital International). The second set of data concerns information extracted from Mergermarket database, focusing on 15 comparable IPOs that occurred between 2007 and 2014 for similar companies in the healthcare sector. Details concerning the utilised companies for each set of data can be consulted in the Annex section. For the first set, the ratios used were EV/EBITDA, EV/EBIT, EV/BV, EV/SALES, P/E; whilst for the second set the EV/Sales, EV/EBIT and EV/EBITDA. Both sets present different results as they concern different types of information. The first analysis resulted in an average price of 3.22€ and the second one, concerning comparable deals, an average price of 4.88€. Results are presented in the next two tables:
Table 7 and 8 – Multiples Output; Source: Bloomberg and Mergermarket; own calculations
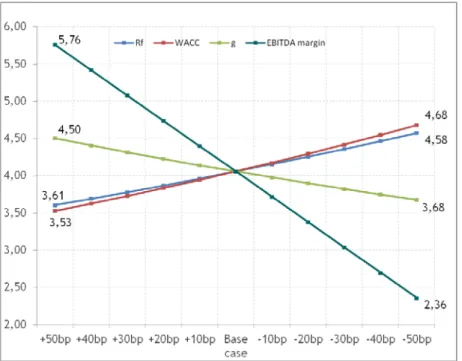
8. Sensitivity Analysis
In order to give robustness to our results we performed a sensitivity analysis to our DCF valuation whereby we tested the amplitude of price changes by varying specific valuation parameters. The most relevant variables of the model subject to the analysis are: WACC, EBITDA margin, Constant Growth Rate and Risk-Free Rate.
Figure 6 – Individual Sensitivity analysis; Source: Own calculations
EV / EBITDA EV / BV EV / EBIT EV / Sales P / E Average Price per Share 4.19 2.52 3.96 1.97 3.19
Average(*) 3.22
Interval [1.97 - 4.19] *Max and Miniumum excluded
EV / REVEN EV / EBIT EV / EBITDA Average Price per Share 5.36 3.14 6.14
Average 4.88
Interval [3.14 - 6.14]
Data Set - 2
Figure 6 shows the individual analysis for each variable, showing the respective prices for deviations of 10 basis points (b.p.).
By analyzing figure 6 and 7 it is noticeable the higher impact that occurs through deviations in the EBITDA margin. This is the variable that reveals to be more sensitive to deviations, presenting wider amplitude regarding the maximum and minimum prices. By varying 50 b.p. positively and negatively to our base assumptions, we reach a maximum value of 5.76€ and a minimum of 2.36€. The WACC discount rate and the Constant Growth rate appear to have a strong similarity when deviations are implemented. In order to assess the change in price for simultaneous parameter deviations, we constructed a matrix for the two variables that have close deviation amplitudes. The analysis revealed a maximum price of €5.23, a minimum of €3.21 and an average of €4.1 for all combinations. The matrix is available in the annex section.
9. Conclusion
Two different methodologies were adopted in order to compute the value of ESS, whereby distinct results were achieved. Through the Discounted Cash Flow model, we computed a theoretical IPO price of 4.06€ per share. The second method takes into account two different sets of data, being one related to financial multiples ratios from comparable companies over a broad geographical range; and the second concerns relevant comparable transactions including the respective M&A (Mergers and Acquisitions) multiples. The following table summarizes the achieved results:
Table 9 – Summary of results; Source: own calculations
The obtained results are higher than 3.20€, suggesting that the price was undervalued at the time of the IPO. In this sense, given the above results and the calculated price target for 2014 of €4.53, it is our conviction that ESS share price has propensity to appreciate with a potential growth of 41.5%, according to our 2014 DCF estimations. The conclusion appears to be somewhat contradictory since in the initial considerations we evidenced several points related with the signalling theory and with the initial share performance that pointed us towards and overvalued IPO price. Nevertheless both qualitative and quantitative assessments are important when performing a valuation project. As for future studies, we believe it would be very interesting to see an historical research work on the Portuguese IPO market.
Price
DCF 4.06
Multiples - Set 1 3.22 Multiples - Set 2 4.88
10. References
Agarwal, S., Liu, C., & Rhee, S. G. (2008). Investor demand for IPOs and aftermarket performance: Evidence from the Hong Kong stock market. Journal of International
Financial Markets, Institutions and Money, 18(2), 176–190.
Bartov, E., Mohanram, P., & Seethamraju, C. (2001). Valuation of Internet Stocks – An IPO Perspective. In Journal of Accounting Research Conference.
Brau, J. C., & Fawcett, S. E. (2006). Initial Public Offerings : An Analysis of Theory and Practice. The Journal of Finance, 61(1), 399–437.
Brau, J. C., & Holloway, J. M. (2009). An empirical analysis of health care IPOs and SEOs.
Journal of Health Care Finance, 35(4), 42–63.
Chemmanur, T. J., & Krishnan, K. (2012). Heterogeneous Beliefs, IPO Valuation, and the Economic Role of the Underwriter in IPOs. Financial Management, 41(4), 769–811. Cornelli, F., & Goldreich, D. (2003). Bookbuilding : How Informative Is the Order Book ?
The Journal of Finance, LVIII(4).
Corwin, S., & Schultz, P. (2005). The Role of IPO Underwriting Syndicates : Pricing, Information Production, and Underwriter Competition The Role of IPO Underwriting Syndicates : Pricing, Information Production, and Underwriter Competition. The
Journal of Finance, 60(February), 443–486.
Daily, C. M., Certo, S. T., & Dalton, D. R. (2005). Investment bankers and IPO pricing: Does prospectus information matter? Journal of Business Venturing, 20(1), 93–111. Damodaran, A. (2008) What is the riskfree rate? A Search for the Basic Building Block.
Stern School of Business, New York University.
Deloof, M., De Maeseneire, W., & Inghelbrecht, K. (2009). How Do Investment Banks Value Initial Public Offerings (IPOs)? Journal of Business Finance & Accounting,
36(1-2), 130–160.
Derrien, F., Womack K. L. (2003). Auctions vs. Bookbuilding and the Control of
Underpricing in Hot IPO Markets. The Review of Financial Studies Spring 2003 Vol.
16, No. 1, 31-61
Fernández, P. (2001). Valuation using multiples. How do analysts reach their conclusions?
Fernando, C. S., Gatchev, V. A., May, A. D., & Megginson, W. L. (2012). The Benefits of Underwriter Reputation to Banks and Equity Issuing Firms.
Koller, T., Goedhart, M., & Wessels, D. (2010). VALUATION (5th ed.). Wiley. Lowry, M., & Schwert, G. W. (2004). Is the IPO pricing process efficient? Journal of
Financial Economics, 71(1), 3–26.
Palkon, D. s. (1999). An Analysis of 1997 Healthcare Initial Public Offerings. Hospital
Topics, 77(3), 22–27.
Roosenboom, P., & Thomas, J. (2007). How Do Underwriters Value Initial Public Offerings? An Empirical Analysis of the French IPO Market. Contemporary
Accounting Research, 24(4), 1217–1243. doi:10.1506/car.24.4.7
Rosenbaum, J., & Pearl, J. (2009). Investment Banking: Valuation, Leveraged Buyouts, and Mergers & Acquisitions. Wiley.
Womack, K. L., & Derrien, F. (2003). Auctions vs . Bookbuilding and the Control of Underpricing in Hot IPO Markets. The Review of Financial Studies, 16(1), 31–61. Zigmond, J. (2007). Going strong, going public. Modern Healthcare, 37(51).
Deloitte Touche Tohmatsu Limited (2014). 2014 Global health care outlook - Shared challenges, shared opportunities. (1-28)
Internet Resources and databases: Bloomberg Database
Mergermarket Database inveting.com
ecb.europa.eu ine.pt
Appendixes
Figure A1 – Current units of Espírito Santo Saúde
Table A1 – Competitors and respective health units
Source: Own research; companies’ websites
Figure A2 – Revenue Breakdown
Figure A3 and A4 – Demographical information
Source: INE (National Statistics Institute); own calculations
A3
Figure A5 – Demographical information
Figure A6 – Global capital dispersion of the operation
Table A2 – Relative Valuation details
Data Set 1: Bloomberg database – Global Industry Classification Standard
France (4 securities)
LNA FP Equity LE NOBLE AGE
ORP FP Equity ORPEA
KORI FP Equity KORIAN-MEDICA
GDS FP Equity GENERALE DE SANT
Germany (7 securities)
MKAN GR Equity MARSEILLE-KLINIK
EIF GR Equity EIFEL-KLINIK AG
MAK GR Equity MATERNUS-KLINIKE
JTH GR Equity GESUNDHEITSWELT
RHK GR Equity RHOEN-KLINIKUM
BHS GR Equity CURANUM AG
MED GR Equity MEDICLIN AG
Greece (5 securities)
HYGEIA GA Equity HYGEIA
IATR GA Equity ATHENS MEDICAL
IASO GA Equity IASO S.A.
EUROM GA Equity EUROMEDICA SA
AXON GA Equity AXON SA HOLDING
Spain (1 security)
CBAV SM Equity CLINICA BAVIERA
Sweden (1 security)
GHP SS Equity GLOBAL HEALTH PA
Switzerland (1 security)
AEVS SW Equity AEVIS HOLDING SA
United Kingdom (3 securities)
CIRC LN Equity CIRCLE HOLDINGS
SPI LN Equity SPIRE HEALTHC PL
Table A3 – Relative Valuation details
Data Set 2: Mergermarket database, comparable IPOs in the Healthcare sector
Country Company Exchange
China Concord Medical Services Holdings Limited New York Stock Exchange
France Medica S.A. Euronext Paris
Poland Centrum Medyczne ENEL-MED S.A. Warsaw Stock Exchange
Poland Dom Lekarski SA Warsaw Stock Exchange
United Arab Emirates NMC Health Plc London Stock Exchange United Kingdom Spire Healthcare Group plc London Stock Exchange United Kingdom The Cambian Group Plc London Stock Exchange United Kingdom Circle Holdings plc London Stock Exchange United Kingdom African Medical Investments Plc London Stock Exchange USA Surgical Care Affiliates, Inc. NASDAQ Stock Market
USA Vanguard Health Systems New York Stock Exchange
USA HCA Holdings, Inc. New York Stock Exchange
USA Select Medical Holdings Corporation New York Stock Exchange USA IPC The Hospitalist Company, Inc. NASDAQ Global Market USA Skilled Healthcare Group, Inc. New York Stock Exchange
Figure A7 – Stock performance vs. PSI 20 Index
Figure A8– Joint sensitivity analysis
+50bp +40bp +30bp +20bp +10bp Base -10bp -20bp -30bp -40bp -50bp +50bp 3,9 3,82 3,74 3,67 3,6 3,53 3,46 3,4 3,33 3,27 3,21 +40bp 4,01 3,93 3,85 3,77 3,7 3,63 3,56 3,49 3,42 3,36 3,3 +30bp 4,13 4,04 3,96 3,88 3,8 3,73 3,66 3,59 3,52 3,45 3,39 +20bp 4,25 4,16 4,08 3,99 3,91 3,84 3,76 3,96 3,62 3,55 3,48 +10bp 4,37 4,28 4,19 4,11 4,03 3,95 3,87 3,79 3,72 3,65 3,58 Base 4,5 4,41 4,32 4,23 4,14 4,06 3,98 3,9 3,82 3,75 3,68 -10bp 4,64 4,54 4,44 4,35 4,26 4,18 4,09 4,01 3,93 3,86 3,78 -20bp 4,78 4,67 4,57 4,48 4,39 4,3 4,21 4,12 4,04 3,96 3,89 -30bp 4,92 4,81 4,71 4,61 4,51 4,42 4,33 4,24 4,16 4,08 4 -40bp 5,07 4,96 4,85 4,75 4,65 4,55 4,46 4,36 4,28 4,19 4,11 -50bp 5,23 5,11 5,00 4,89 4,78 4,68 4,58 4,49 4,4 4,31 4,23 WACC