Forage productivity and morphogenesis of
Axonopus
aureus
under different
nitrogen fertilization rates
Newton de Lucena Costa1, Anibal de Moraes2, Alda Lúcia Gomes Monteiro3, Antonio Carlos Vargas Motta4, Ricardo Augusto de Oliveira2, Antonio Neri Azevedo Rodrigues5
1 Embrapa Roraima - Boa Vista, RR, Brazil.
2 Departamento de Fitotecnia e Fitossanitarismo da UFPR - Curitiba, PR, Brazil. 3 Departamento de Zootecnia da UFPR - Curitiba, PR, Brazil.
4 Departamento de Solos da UFPR - Curitiba, PR, Brazil. 5 Instituto Federal de Rondônia - Colorado do Oeste, RO, Brazil.
ABSTRACT - The effect of nitrogen (N) fertilization (0, 50, 100 and 200 kg N ha-1) on forage yield and morphogenesis of
Axonopus aureus was evaluated in the savannas of Roraima State, Brazil. The experimental design was in randomized blocks with three replicates. The grass showed high responsiveness to N fertilization. Dry weight (DW) yield, morphogenetic and structural traits and forage quality were positively affected by N fertilization. The effects of N fertilization on DW yield, N content, leaf appearance rate, leaf elongation rate, number of live leaves/tiller, final leaf length and leaf area index were quadratic and maximum values were estimated with application of 168.8 (2,181 kg ha-1); 124.8 (21.1 g/kg); 158.5 (0.163 leaf/day per tiller); 172.3 (2.75 cm/tiller per day); 155.5 (17.23 cm); 185.5 (7.55 leaves/tiller) and 185.3 (2.22) kg N ha-1, respectively. Tiller population density and leaf senescence rate are directly proportional to increase in N rates, and the opposite occurs for N utilization efficiency and apparent N recovery.
Key Words: dry weight, leaf, senescence, tillering
Introduction
In Roraima State, Brazil, burning is a practice commonly utilized in the management of native pasture because of its low cost and easy application. Its main feature is the elimination of accumulated dry biomass which is not consumed by animals during the dry season, promoting an earlier, palatable and more nutritive regrowth, notably in periods of low forage availability (Gianluppi et al., 2001). Burning incorporates, in the form of ash, all the non-volatile nutrients of the biomass, which implicates increase in pH and soil fertility, and improved pasture growth. However, such high fertility is temporary, since about 97% of N, 61% of phosphorus (P), 76% of potassium (K) and 65% of calcium (Ca) and magnesium (Mg) are transferred to the atmosphere and only 21 to 34% of Mg, Ca, K and P and 0.2% of N remain in the soil in the form of ash (Valencia & Hernández, 2002). Nitrogen can be lost by leaching, volatilization or immobilization, a process in which the nutrients become unusable by the plant, so its deficiency is pointed as one of the main causes of low primary biological productivity of native pastures (Braga, 1998; Costa et al., 2011a).
Native pastures, formed almost exclusively by grasses, need a (chemical or biological) source for reposition of N
so as to maintain their forage yield, and consequently prevent their degradation (Gianluppi et al., 2001; Costa et al., 2011b). Nitrogen is considered the main nutrient for maintenance of productivity and persistence of forage grasses; it constitutes the proteins that actively participate in the synthesis of organic compounds that make up the structure of the plant, in addition to maximizing the morphogenetic (leaf appearance, expansion and senescence rates) and structural (leaf size, tiller density and number of lives per tiller) characteristics of the grass. In soils deficient in N, plant growth and development become slow, tiller yield is negatively influenced and the protein content becomes inefficient to meet the requirements of the animal (Gomide, 1997).
In spite of being well adapted to the acid and low-fertility soils of the savanna, native grasses present low primary productivity; however, they seem to be responsible for improvement of the production environment, especially through fertilization. In the savannas of Venezuela, Barger et al. (2002) verified that N and P were the most limiting
nutrients to forage productivity of Trachypogonplumosus.
For Axonopuspurpusii pastures, combined application of N
(100 kg N ha-1), P (36 kg P
2O5 ha-1) and K (60 kg K2O ha-1)
resulted in enhancement superior to 460% in its forage yield
(554 vs. 3,108 kg DW ha-1)(Sarmiento et al., 2006). Utilizing
ISSN 1806-9290
www.sbz.org.br R. Bras. Zootec., v.42, n.8, p.541-548, 2013
similar fertilization rates on pastures of Trachypogon plumosus + Trachypogon vestitus, Barger et al. (2002) observed increments of 71, 17 and 126%, respectively, for the
application of N (7,180 kg DW ha-1), P + K (4,900 kg DW ha-1)
and N + P + K (9,490 kg DW ha-1), in comparison with the
control treatment (4,200 kg DW ha-1).
Among the many forage grasses that compose the native
pastures of the savannas of Roraima, Axonopus aureus
is one of the most important, accounting for about 30 to 40% of its botanical composition (Gianluppi et al., 2001). The grass presents perennial cycle, caespitous growth habit, plants of 40 to 60 cm in height and slightly hairy leaves. However, studies on the effects of improvement of production environment on the productive performance and alterations in their morphogenetic and structural characteristics for the proposal of more sustainable management practices are still scarce. In the present study, the effects of N fertilization on forage yield and
morphogenetic and structural characteristics of Axonopus
aureus in the savannas of Roraima were evaluated.
Material and Methods
The study was conducted in the Experimental Field of Embrapa Roraima, located in Boa Vista, Roraima State, Brazil, from May to September 2009, on a native pasture
where Axonopusaureus represented 95% of its botanical
composition. The soil of the experimental area is classified as a Yellow Oxisol (Xanthic Ferralsol) of medium texture, with the following chemical characteristics in the 0-20 cm layer: pH
in water = 4.8; P = 1.8 mg kg-1; Ca + Mg = 0.95 cmol
c dm-3;
K = 0.01 cmolc dm-3; Al = 0.61 cmolc dm-3; H+Al = 2.64 cmolc dm-3
and sum of bases = 0.91 cmolc.dm-3; clay content = 232 g kg-1;
and organic matter = 18.6 g kg-1. Precipitation and temperature
during the experimental period were measured by a pluviometer and a thermometer installed in the experimental area (Table 1).
The experimental design was in randomized blocks with three replicates. Treatments consisted of four N rates
(0, 50, 100 and 200 kg N ha-1), applied in the form of urea
(44% of N). The size of plots was of 2.0 × 3.0 m, with a useful area of 2.0 m². The application of N was split in two times: half was given at pasture mowing, at the beginning of the experiment, and the other half, 45 days after. During the experimental period, three harvesting cuts were performed at 45-day intervals.
Dry weight (DW) yields were estimated through mechanical harvesting at a height of 5.0 cm above the ground. The material collected was weighed and left to dry in a forced-ventilation oven at 65 ºC for 72 hours. Absolute growth rate (AGR) was obtained by dividing the DW yield by the period of regrowth. The N utilization efficiency (NUE) was determined by relating the DW yield with the N rate applied. Nitrogen content was determined by the micro-Kjeldahl method. Apparent N recovery (ANR) was calculated by the formula:
ANR = 100 × N extracted by fertilized plants - N extracted by non-fertilized plants ÷ N rate applied.
The N critical level (NCL) was determined by
methodology proposed by Lemaire & Salette (1984), for C3
grasses, through the formula: NCL = 4.8.DW (-0.32),
which estimates the N dilution curve as a function of DW accumulation. The N nutrition index (NNI) was determined as the ratio between N content in the DW and the NCL; it was considered satisfactory when the result equaled 1.0 (Lemaire & Gastal, 1997).
To determine the morphogenetic and structural characteristics, four tussocks/plot were selected and three tillers/tussock were tagged, using plastic colored threads. Leaves were measured every three days, when the appearance, elongation and aging of leaves were computed. The leaf elongation rate (LER) and leaf appearance rate (LAR) were calculated by dividing the accumulated length of leaves and the total number of live leaves on the tiller (NLLT), respectively, by the period of regrowth. The final leaf length (FLL) was determined by dividing the total tiller elongation by its number of leaves. For the calculation of leaf area, at each regrowth age, samples were collected from fully expanded green leaves, aiming
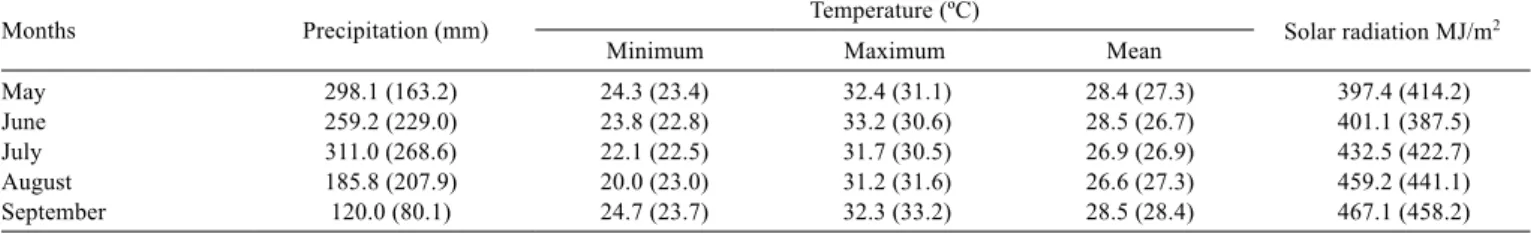
Table 1 - Precipitation, minimum, maximum and mean temperatures and solar radiation recorded during the experimental period
Months Precipitation (mm) Temperature (ºC) Solar radiation MJ/m2
Minimum Maximum Mean
May 298.1 (163.2) 24.3 (23.4) 32.4 (31.1) 28.4 (27.3) 397.4 (414.2)
June 259.2 (229.0) 23.8 (22.8) 33.2 (30.6) 28.5 (26.7) 401.1 (387.5)
July 311.0 (268.6) 22.1 (22.5) 31.7 (30.5) 26.9 (26.9) 432.5 (422.7)
August 185.8 (207.9) 20.0 (23.0) 31.2 (31.6) 26.6 (27.3) 459.2 (441.1)
September 120.0 (80.1) 24.7 (23.7) 32.3 (33.2) 28.5 (28.4) 467.1 (458.2)
to obtain an area between 200 and 300 cm2, estimated
with the aid of an optical electronic planimeter (Li-Cor, model LI -3100C). Subsequently, the samples were taken to a forced-ventilation oven at 65 °C until they reached constant weight, so the leaf DW was calculated. Specific leaf area (SLA) was determined as the ratio between the
area of green leaves and their DW (m2 g-1). Leaf area index
(LAI) was determined as the product between the total DW
of green leaves (g m-2) by SLA (m2 g-1). Leaf senescence
rate (LSR) was obtained by dividing the length of the leaves that presented yellow staining or necrosis by age at regrowth. Tiller population density (TPD) was estimated
with the use of 0.25 m2 metal frames (50 × 50 cm), divided
in four points at random in each plot; every tiller, in each regrowth age, was computed.
The data were subjected to analysis of variance (ANOVA), F test, and regression considering the significance level of 5% of probability. To estimate the response of the parameters evaluated as a function of the nitrogen levels, the choice of regression models was based on the significance of the linear and quadratic coefficients through the t test at the level 5% of probability.
Results and Discussion
The DW yield and AGR were influenced (P<0.05) by N fertilization; the rate of maximum technical efficiency
was estimated at 168.8 (2,181 kg DW ha-1 and 14.3 kg DW
ha-1 day-1, respectively) (Figures 1 and 2). Rippstein et al.
(2001), with Trachypogonvestitus, native grass of savannas
from Colombia, and Cunha et al. (2001), in native pastures of Rio Grande do Sul State, verified linear effects of N fertilization on the forage yields with application of up to 150 and 200 kg N ha-1 year-1, respectively. Scheffer-Basso et al.
(2010), in a Paspalumpauciciliatum pasture, observed that
application of 50 kg N ha-1 resulted in an increase above
250% in the forage yield of the grass (3,523 vs. 1,022 kg
DW ha-1), whereas Siewerdt et al. (1995), for native pastures
with predominance of Paspalum notatum, P. distichum, P.
modestum and Axonopuscompressus, estimated maximum
yield with application of 453 kg N ha-1 (10,133 kg DW ha-1).
Costa et al. (2011b), in non-fertilized A. aureus pastures subjected to different rest periods, verified yield of 721; 976;
and 1,345 kg DW ha-1 for 35, 49 and 63 days, respectively,
which were inferior to the values recorded in this study. Reducing the maintenance respiration and stimulating this growth - directly proportional to the protein content of the plant and responsible for the yield of new organic compounds - nitrogen contributes positively to the greater accumulation of biomass (Gastal et al., 2010). A nitrogen
content in the leaves inferior to 3% reduces the capacity of carbon (C) fixation, and consequently, the primary biological productivity of the grass (Jeuffroy et al., 2002).
Nitrogen content responded quadratically to N rates (ŷ = 17.95 + 0.0499*x − 0.0002*x2; R2 = 0.87) and the
maximum value was obtained with application of 124.8 kg
N ha-1 (21.1 g kg-1) (Table 2). Considering that N contents
below 11.2 g kg-1 are limiting to animal growth, for implying
lower voluntary intake, reduction in forage digestibility and negative N balance, the grass would satisfactorily supply the minimum requirements of ruminants, regardless of N fertilization rate (Lemaire, 1997). The ratio between DW and N content was fitted to the exponential regression model (ŷ = 10.949.e(-0.25*x) - R2 = 0.84), demonstrating the effect of
dilution of its contents, as a function of the greater DW accumulation with increase in the levels of N fertilization. According to Gastal & Lemaire (2002), this behavior is a result of the greater proportion of structural material
Figure 1 - Dry weight yield of Axonopus aureus according to N fertilization rates.
y = - 0.0462x 2
+ 15.596x + 865.65 R² = 0.997
0 500 1,000 1,500 2,000 2,500
0 50 100 150 200 250
Nitrogen rate (kg ha -1
)
Dry
weight
yield
(kg
ha
)
-1
Nitrogen rate (kg ha -1
)
y = -0.000278x2+ 0.0937x + 6.4039 R² = 0.998
0 2 4 6 8 10 12 14 16 18
0 50 100 150 200 250
Absolute
growth
rate
(kg
of
DW
ha
day
)
-1
-1
and reserves with plant growth, which contain little N, in addition to the non-uniformity of the N distribution between leaves according to the solar radiation received within the canopy. The N contents, for all N rates, were below the critical level proposed by Lemaire & Salette (1984), which implies insufficient NNI to supply the N requirement of the grass; therefore, the ratio between the N content in the DW and NNI was below 1.0.
Nitrogen use efficiency and apparent nitrogen recovery were inversely proportional to the rates utilized (Table 2). Similar trends were verified by Siewerdt et al. (1995) for
Paspalum spp. pastures (28.8, 21.7 and 17.1 kg DW/kg N
and 45.6, 41.2 and 36.8% for 100, 200 and 300 kg N ha-1,
respectively). Assessing the effects of N fertilization (0,
60, 180 and 360 kg N ha-1 year-1) in Paspalum notatum cv.
André da Rocha, Townsend (2008) observed maximum
forage yield with application of 239 kg N ha-1; however, the
greatest NUE rates were reached under fertilization levels
between 80 and 160 N ha-1 year-1. Primavesi et al. (2004)
verified that the ANR ofCynodon dactylon cv. Coastcross
was inversely proportional to N rates, but the highest values were achieved with the utilization of ammonium nitrate (75, 68 and 45%), in comparison with urea (52, 46
and 37%) for 50, 100 and 200 kg N ha-1, respectively.
The ratio between N fertilization and NLLT was fitted to the quadratic regression model and the maximum
value was obtained with application of 185.5 kg N ha-1
(7.55 leaves tiller-1) (Figure 3). The values achieved were
superior to those reported by Costa et al. (2011b) for A. aureus pastures under different grazing intensities (4.8, 5.3
and 6.1 leaves tiller-1 at 35, 49 and 56 days of regrowth,
respectively). For Garcez Neto et al. (2002), the main effect of N on the NLLT would be the increase in leaf lifespan. The action of N would be associated with the maintenance of greater photosynthetic capacity for longer periods, with no significant internal reallocation of the N from older leaves. However, Patês et al. (2007) verified that the NLLT of
Panicum maximum cv. Tanzania was inversely proportional to the N rates applied (0, 15, 33 and 50 mg N/kg soil), as a consequence of the prioritization of the production of a higher number of tillers over leaves tiller-1.
The effects of N fertilization on LAR, LER and FLL were quadratic, and the maximum values were achieved with the application of 158.5 (0.163 leaves/day tiller-1),
172.3 (2.75 cm/tiller day-1) and 155.5 kg N ha-1 (17.23 cm)
(Figures 4, 5 and 6), respectively. Under limiting nutritional conditions, the strategy for maintenance of growth would be sparing assimilates, started by the commitment of the tillering, going trough reduction in FLL and leaf lifespan (Nabinger & Pontes, 2001). The correlations between DW yield and LAR (r = 0.94; P = 0.0021) and LER (r = 0.91; P = 0.0042) were positive and significant.The LAR, LER and FLL obtained in this study were superior to those reported by Costa et al. (2011b) for non-fertilized pastures of
A. aureus, during the rainy period, who estimated 0.141 leaves/tiller day-1, 1.54 cm/tiller day-1 and 13.7 cm, for
plants at 49 days of regrowth. Leaf elongation rate explained 90% the increase in the DW yield of the grass, according to the N fertilization. Likewise, Petry et al. (2005) verified quadratic effect of N fertilization (0, 50, 100, 150 and
200 mg N/kg soil) on LAR, LER and FLL of P. maximum
cv. Mombasa, estimating maximum values with application of 73, 121 and 103 mg N/kg soil, respectively. On pastures of Andropogon lateralis, a native grass of the South of Brazil, Bandinelli et al. (2003) estimated highest LAR
and LER with the application of 100 kg N ha-1 (0.085
leaves/day tiller-1 and 0.66 cm/day tiller-1), in comparison
Table 2 - Nitrogen data in Axonopus aureus according to N fertilization rates
Nitrogen rates (kg ha-1) N content (g kg-1) NCL (g kg-1) NNI (N/NCL content) NUE (kg DW/kg N) NAR (%)
0 18.2c 50.3 0.36 -
-50 19.3b 42.2 0.46 29.8a 28.1a
100 21.5a 38.5 0.56 19.9b 24.5a
200 20.1ab 37.7 0.53 10.7c 13.3b
Means followed by the same letter are not different (P>0.05) by the Tukey test.
NCL - nitrogen critical level (criticalN = 4.8.DW(-0.32)); NNI - nitrogen nutrition index; NUE - nitrogen use efficiency; NAR - nitrogen apparent recovery. DW - dry weight.
Nitrogen rate (kg ha
-1
) y = -0.0001x
2
+ 0.0371x + 4.1406 R² = 0.996
2 3 4 5 6 7 8
0 50 100 150 200 250
Numberof
live
leaves
tiller
-1
with the control treatment (0.065 leaves/day tiller-1 and
0.47 cm/day tiller-1) or the application of 200 kg N ha-1
(0.076 leaves/day tiller-1 and 0.63 cm/day tiller-1).
The role of N supply on the LAR can be analyzed as a result of the simultaneous combination of several factors, such as sheath height, leaf elongation and temperature. The rate at which leafs elongate alters the leaf blade appearance pattern, according to the change in the time taken by the leaf from its start in the meristem to its appearance above the pseudostem formed by the older leaves (Duru & Ducrocq, 2000). For Garcez Neto et al. (2002), when responding to the N supply, LER would be the main agent to modify LAR. Successful leaves appearing at close insertion intervals, but under elevated elongation rates, supported by the additional N supply, would establish higher LAR.
In grasses, leaf elongation is restricted to an area at the base of the leaf undergoing expansion protected by the pseudostem: active local of high nutrient requirement, where N acts as the main responsible for the cell division and expansion. According to Alexandrino et al. (2011), LAR and LER have a negative relationship, which indicates that the greater the LAR, the shorter the time available for elongation. In this study, the relationship between these two variables was positive and significant (r = 0.97; P<0.01), possibly, as a consequence of the utilization of favorable environmental conditions, which enabled plants to express their maximum growth potential. Grant et al. (1981), in
annual ryegrass (Lolium perenne L.), observed that LER
was positively correlated with the amount of green leaves remaining on the tiller after defoliation, and the size of the tiller is the main responsible for the period of leaf expansion.
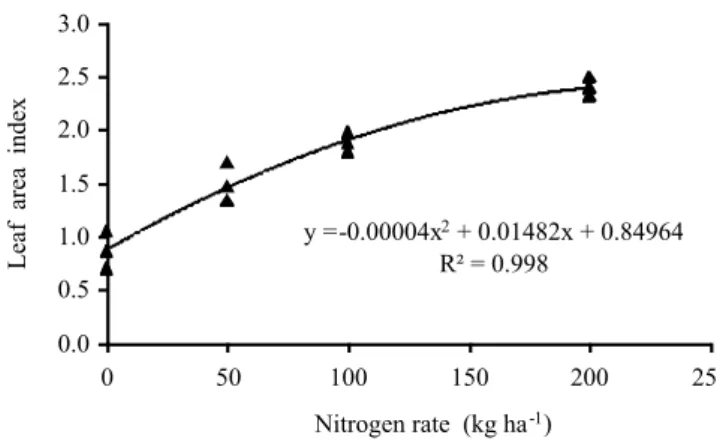
Leaf area index responded to N fertilization quadratically and the maximum value was recorded with
application of 185.3 kg N ha-1 (2.22) (Figure 7). Since LAI
represents the synthesis of the morphogenetic and structural grass characteristics, it reflects the balance of the processes which determine the supply (photosynthesis) and the demand (respiration, accumulation of reserves, synthesis and senescence of tissues) of photoassimilates, which set the growth of the pasture (Nabinger & Pontes, 2001). When nitrogen modifies the structure and morphological composition of the pasture, resulting from the greater number of live leaves per tiller, it promotes increase in the leaf appearance and elongation rates, with positive reflection in their final length, resulting in greater LAI and, thus, efficiency at light absorption and photosynthetic capacity of the sward (Lemaire, 1997). The values recorded were superior to those reported by Costa et al. (2011b) for
non-fertilized A. aureus pastures under different harvest
y = -0.00007x
2
+ 0.02412x + 0.67582
R² = 0.976
0.0 0.5 1.0 1.5 2.0 2.5 3.0 3.5
0 50 100 150 200 250
Leaf
elon
gation
rate
(cm/day
tiller
)
-1
Nitrogen rate (kg ha
-1
)
Figure 5 - Leaf elongation rate of Axonopus aureus according to N fertilization rates.
Figure 6 - Final leaf length of Axonopus aureus according to N fertilization rates.
y = -0.00039x
2
+ 0.1213x + 7.8041
R² = 0.963
0 5 10 15 20 25
0 50 100 150 200 250
Nitrogen rate (kg ha
-1
)
Final
leaf
lenght
(cm
)
Figure 4 - Leaf appearance rate of Axonopus aureus according to N fertilization rates.
Nitrogen rate (kg ha
-1 ) y = -0.000003x
2
+ 0.000951x + 0.08777
R² = 0.997
0 0.02 0.04 0.06 0.08 0.1 0.12 0.14 0.16 0.18
0 50 100 150 200 250
Leaf
appearance
rate
(leaf/day
tiller
)
frequencies (10.6, 13.4 and 14.9 cm2 tiller-1 for 28, 35 and
42 days of regrowth, respectively).
Nitrogen fertilization affected TPD positively and linearly (P<0.05; Figure 8). The correlation between DW yield and TPD was positive and significant(r=0.99;P=0.0032), explaining 90% the increase verified in the grass forage yields according to N fertilization rates. Positive effects of
N fertilization on the TPD of P. maximum cvs. Tanzânia
and Mombasa, regardless of phosphorus fertilization, were reported by Patês et al. (2007) and Garcez Neto et al. (2002), respectively. According to Alexandrino et al. (2010), N intensively interferes with the activation of meristematic tissues (axillary buds); its deficit increases the number of dormant buds, whereas the adequate supply enables maximum grass tillering. For Garcez Neto et al. (2002), tillering is a structural characteristic heavily affected by nutritional, environmental and management factors, which define the morphogenetic characteristics that, in turn, are crucial for the morphogenetic response of forage plants. Yield of new tillers is usually a continuous process accelerated by plant defoliation as a consequence of the improvement of the light environment at the base of the sward (higher red:far-red radiations ratio), controlled by two main factors: supply of energy for the photosynthesis and number and activity of growth spots (Gastal & Lemaire, 2002). Since individual tillers have a limited and variable lifespan, as a result of biotic and abiotic factors, their population can be maintained by a continuous replacement of dead tillers; this mechanism is the key point to grass perenniality.
Leaf senescence rate was affected positively and linearly by N fertilization (Figure 9). Bandinelli et al. (2003)
verified that LSR ofA. lateralis were directly proportional
to N rates (0.169, 0.194 and 0.197 cm/day tiller-1 for 0,
100 and 200 kg N ha-1, respectively). In the absence of
fertilization, plants remained longer with their leaves alive rather than having new leaves, i.e., the senescence process was accelerated with increase in N rates, reducing leaf lifespan, as a consequence of the greater tissue renewal in plants (Gastal et al., 2010). The values recorded were lower than those reported by Costa et al. (2011b), who
estimated a LSR of 0.224 cm/day tiller-1 for A. aureus
plants at 45 days of regrowth, during the rainy period. Senescence is a natural process that characterizes the last developmental period of a leaf started after its complete expansion, whose intensity progressively becomes more pronounced with increase in leaf area, as a consequence of the shading of upper leaves over those at the lower portion of the stem, which have their photosynthetic capacity reduced (Gastal et al., 2010). Despite the negative effect
Figure 7 - Leaf area index of Axonopus aureus according to N fertilization rates.
y = -0.00004x 2
+ 0.01482x + 0.84964
R² = 0.998
0.0 0.5 1.0 1.5 2.0 2.5 3.0
0 50 100 150 200 250
Nitrogen rate (kg ha -1
)
Leaf
area
index
Figure 8 - Tiller population density of Axonopus aureus according to N fertilization rates.
y = 2.1394x + 433.8
R² = 0.925
200 300 400 500 600 700 800 900
0 50 100 150 200 250
T
iller
po
pulation
density
(tiller
m
)
-2
Nitrogen rate (kg ha -1
)
y = 0.0002x + 0.0682
R² = 0.897
0.00 0.02 0.04 0.06 0.08 0.10 0.12
0 50 100 150 200 250
Leaf
senescence
rate
(cm/day
tiller
)
-1
Nitrogen rate (kg ha
-1 )
on the quality of the forage, senescence represents an important physiological process in the grass tissues flow, since about 50% of C and 80% of N can be recycled from senescent leaves and utilized for the yield of new leaf tissues (Carrère et al., 1997; Lemaire & Agnusdei, 2000;
Alexandrino et al., 2011). In T. plumosus pastures, Medina
(1982) verified internal retranslocation of 64% of the N of senescent leaves to those undergoing expansion, whereas Silva & Haridasan (2007), with several native grasses of the savanna, estimated retranslocation efficiency of 34.9, 68.4, 86.9 and 42.2% for N, P, K and Mg, respectively.
Conclusions
Nitrogen fertilization affects forage yield, absolute growth rate, nitrogen content and morphogenetic and
structural characteristics of Axonopus aureus. During the
rainy season, the grass responds positively to nitrogen
fertilization until the rate of 169 kg N ha-1. Grass senescence
process is accelerated by nitrogen fertilization. Nitrogen use efficiency and apparent nitrogen recovery are inversely proportional to nitrogen rates.
References
ALEXANDRINO, E.; CÂNDIDO, M.J.D.; GOMIDE, J.A. Fluxo de biomassa e taxa de acúmulo de forragem em capim Mombaça mantido sob diferentes alturas. Revista Brasileira de Saúde e Produção Animal, v.12, n.1, p.59-71, 2011.
ALEXANDRINO, E.; VAZ, R.G.M.; SANTOS, A.C. Características da Brachiaria brizantha cv. Marandu durante o seu estabelecimento submetida a diferentes doses de nitrogênio. Bioscience Journal, v.26, n.6, p.886-893, 2010.
BANDINELLI, D.G.; QUADROS, F.L.F.; GONÇALVES, E.N. et al. Variáveis morfogênicas de Andropogonlateralis Nees submetido a níveis de nitrogênio nas quatro estações do ano. Ciência Rural, v.33, n.1, p.71-76, 2003.
BARGER, N.N.; D’ANTONIO, C.M.; GHNEIM, T. et al. Nutrient limitation to primary productivity in a secondary savanna in Venezuela. Biotropica, v.34, n.4, p.493-501, 2002.
BRAGA, R.M. A agropecuária em Roraima: considerações históricas, de produção e geração de conhecimento. Boa Vista: Embrapa Roraima, 1998. 63p. (Documentos, 1).
CARRÈRE, P.; LOUAULT, F.; SOUSSANA, J.F. Tissue turnover within grass-clover mixed swards grazed by sheep. Methodology for calculating growth, senescence and intake fluxes. Journal of Applied Ecology, v.34, p.333-348, 1997.
COSTA, N.L.; GIANLUPPI, V.; MORAES, A. Produtividade de forragem e morfogênese de Trachypogon vestitus em diferentes idades de rebrota nos cerrados de Roraima. Revista Brasileira de Saúde e Produção Animal, v.12, n.42, p.935-948, 2011a. COSTA, N.L.; GIANLUPPI, V.; MORAES, A. et al. Produtividade
de forragem e características morfogênicas e estruturais de
Axonopus aureus nos cerrados de Roraima. Amazônia Ciência & Desenvolvimento, v.6, n.12, p.7-22, 2011b.
CUNHA, M.K.; SIEWERDT, L.; SILVEIRA JÚNIOR, P. et al. Doses de nitrogênio e enxofre na produção e qualidade da forragem de campo natural de Planossolo no Rio Grande do Sul. Revista Brasileira de Zootecnia, v.30, n.3, p.651-658, 2001.
DURU, M.; DUCROCQ, H. Growth and senescence of the successive leaves on a Cocksfoot tiller. Effect of nitrogen and cutting regime. Annals of Botany, v.85, p.64S-6S3, 2000.
GARCEZ NETO, A.F.; NASCIMENTO JÚNIOR, D.; REGAZZI, A.J. et al. Respostas morfogênicas e estruturais de Panicum maximum
cv. Mombaça sob diferentes níveis de adubação nitrogenada e alturas de corte. Revista Brasileira de Zootecnia, v.31, n.5, p.1890-1900, 2002.
GASTAL, F.; DAWSON, L.A.; THORNTON, B. Responses of plant traits of four grasses from constrating habitats to defoliation and N supply. Nutrient Cycling in Agroecosystems, v.88, p.245-258, 2010.
GASTAL, F.; LEMAIRE, G. N uptake and distribution in crops: an agronomical and ecophysiological perspective. Journal of Experimental Botany, v.53, n.370, p.789-799, 2002.
GIANLUPPI, D.; GIANLUPPI, V.; SMIDERLE, O. Produção de pastagens no cerrado de Roraima. Boa Vista: Embrapa Roraima, 2001. 4p. (Comunicado Técnico, 14).
GOMIDE, J.A. Morfogênese e análise de crescimento de gramíneas tropicais. In: SIMPÓSIO INTERNACIONAL SOBRE PRODUÇÃO ANIMAL EM PASTEJO, 1997, Viçosa, MG. Anais... Viçosa, MG: UFV, 1997. p.411-430.
GRANT, S.A.; BERTHARM, G.T.; TORVELL, L. Components of regrowth in grazed and cut Loliumperenne swards. Grass and Forage Science, v.36, p.l55-168, 1981.
JEUFFROY, M.H.; NEY, B.; OURRY, A. Integrated physiological and agronomic modelling of N capture and use within the plant. Journal of Experimental Botany, v.53, n.370, p.809-823, 2002.
LEMAIRE, G. The physiology of grass growth under grazing: tissue turnover. In: SIMPÓSIO INTERNACIONAL SOBRE PRODUÇÃO ANIMAL EM PASTEJO, 1997, Viçosa, MG. Anais... Viçosa, MG: UFV, 1997. p.117-144.
LEMAIRE, G.; AGNUSDEI, M. Leaf tissue turnover and efficiency of herbage utilization. In: LEMAIRE, G.; HODGSON, J.; MORAES, A. et al. (Eds). Grassland ecophysiology and grazing ecology. London: CAB International, 2000. p.265-288.
LEMAIRE, G.; GASTAL, F. N uptake and distribuition in plant canopies. In: LEMAIRE, G. (Ed.). Diagnosis of nitrogen status in crops. Heidelberg: Springer-Verlag, 1997. p.3-43.
LEMAIRE, G; SALETTE, J. Relation entre dynamique de croissance et dymamique de prélèvement d’azote pour un peuplement de graminées fourragères. 1. Etude de l’effet du milieu. Agronomie, v.4, p.223-230, 1984.
MEDINA, E. Nitrogen balance in Trachypogon grasslands of central Venezuela. Plant and Soil, v.67, p.305-314, 1982.
NABINGER, C.; PONTES, L.S. Morfogênese de plantas forrageiras e estrutura do pasto. In: REUNIÃO ANUAL DA SOCIEDADE BRASILEIRA DE ZOOTECNIA, 38., 2001, Piracicaba. Anais... Piracicaba: SBZ, 2001. p.755-771.
PATÊS, N.M.S.; PIRES, A.J.V.; SILVA, C.C.F. et al. Características morfogênicas e estruturais do capim-tanzânia submetido a doses de fósforo e nitrogênio. Revista Brasileira de Zootecnia, v.36, n.6, p.1736-1741, 2007.
PETRY, L.; MESQUITA, E.E.; NERES, M.A. et al. Morfogênese de
Panicum maximum cultivares Mombaça, Tanzânia e Millenium sob doses de nitrogênio. In: REUNIÃO ANUAL DA SOCIEDADE BRASILEIRA DE ZOOTECNIA, 42., 2005, Goiânia. Anais... Goiânia: SBZ, 2005. 3p. (CD-ROM).
PRIMAVESI, A.C.; PRIMAVESI, O.; CORRÊA, L.A. et al. Adubação nitrogenada em capim-Coastcross: Efeitos na extração de nutrientes e recuperação aparente do nitrogênio. Revista Brasileira de Zootecnia, v.33, n.1, p.68-78, 2004.
RIPPSTEIN, G.; ESCOBAR, G.; MOTTA, F. Agroecologia y biodiversidad de los Llanos Orientales de Colombia. Cali, Colombia: CIAT, 2001. 302p.
production in a flooded savanna in the Venezuelan Llanos.Journal of Tropical Ecology, v.22, p.203-212, 2006.
SCHEFFER-BASSO, S.M.; FÁVERO, F.; CESARO, E.P. et al. Preliminary evaluation of Paspalum pauciciliatum: seasonal production and nitrogen response. ARS Veterinaria, v.26, n.1, p.53-59, 2010.
SIEWERDT, L.; NUNES, A.P.; SILVEIRA JÚNIOR, P. Efeito da adubação nitrogenada na produção e qualidade da matéria seca de um campo natural de Planossolo no Rio Grande do Sul. Revista Brasileira de Agrociência, v.1, n.3, p.157-162, 1995.
SILVA, J.S.O.; HARIDASAN, M. Acúmulo de biomassa aérea e concentração de nutrientes em Melinis minutiflora P. Beauv. e gramíneas nativas do cerrado. Revista Brasileira de Botânica, v.30, n.2, p.337-344, 2007.
TOWNSEND, C.R. Características produtivas de gramíneas nativas do gênero Paspalum, em resposta à disponibilidade de nitrogênio. 2008. 254f. Tese (Doutorado em Zootecnia) -Universidade Federal do Rio Grande do Sul, Porto Alegre. VALENCIA, H.; HERNÁNDEZ, L. The losses of nutrients by fire