II. ARTICLES
∗
Nuno Crespo*, Nadia Simoes*, José Castro Pinto**
DETERMINANT FACTORS OF JOB QUALITY
IN EUROPE
We analyze the determinants of job quality in Europe based on an individual level approach. Using data from the Fourth European Working Conditions Survey, covering 31 countries, we develop a multidimensional indicator of job quality including eleven dimensional indices, and confirm the influence of worker and company characteristics on the quality of jobs. Among worker characteristics, the factors that most strongly influence job quality are education and whether the worker is self-employed or a wage earner. The economic sector is the most important firm-related characteristic.
Keywords: job quality, Europe, determinant factors, twice-censored Tobit model,
dimensional analysis
DOI: 10.15611/aoe.2017.1.01
1. INTRODUCTION
The importance of the concept and the analysis of job quality on the agenda of international institutions such as the European Union (EU), the International Labour Organization (ILO), and the Organisation for Economic Co-operation and Development (OECD) were decisive for the development of an extensive literature on this topic (Rubery and Grimshaw, 2001; Clark, 2005). Several studies have proposed indicators to quantify the levels of job quality and monitor their evolution over time, responding directly to the needs outlined in the political sphere (for a survey see Bustillo et al., 2009). At a macroeconomic level, measuring job quality is important not only because it allows its monitoring and the evaluation of the effects of economic policies with impact in the labour market, but also because it enables studying how important structural changes such as globalization, technological progress and changes in unionization rates have affected working conditions (Clark, 2005; Green, 2006; Goos et al., 2010; Davis and Harrigan, 2011).
∗ Instituto Universitário de Lisboa (ISCTE – IUL), ISCTE Business School, Economics Department, UNIDE – IUL (Business Research Unit), Lisbon, Portugal
** Instituto Universitário de Lisboa (ISCTE – IUL), ISCTE Business School, Quantitative Methods Department, UNIDE – IUL (Business Research Unit), Lisbon, Portugal
Alongside the analysis that takes job quality indicators calculated at country level as a starting point, another literature strand adopts a microeconomic perspective, putting the focus on the measurement at worker level. The characterization of the quality of jobs based on aspects related to the job-worker pairing allows us to understand, among other things, how workers build the overall assessment of their jobs, the role of expectations in this evaluation, and the influence of this assessment on their labour market decisions. Following this micro-level approach, the main goal of our analysis is to identify the key determinants of job quality.
The individual level of job quality is influenced by the socio-economic characteristics of the worker and by the characteristics of the firm where (s)he works. There is an extensive literature that addresses the impact of these two sets of characteristics on wages. To a lesser degree, some attention has also been given to the influence of these factors on other job quality dimensions such as autonomy, job security, and prospects of promotion.
In trying to fill a gap in the literature, we analyze, in an integrated way, the influence of worker and company characteristics on the overall index of job quality and on each of its dimensions. This allows for, on one hand, a detailed characterization of the influence of the determinant factors on each of the job dimensions and, on the other hand, a clearer understanding of the sources of the aggregate effect.
We develop our analysis based on the Fourth European Working Conditions Survey (EWCS), including data from 31 European countries, and taking as reference a multidimensional job quality index that incorporates 11 objective and subjective dimensions.
The paper is structured as follows. In the next section we discuss some background topics concerning the literature on job quality. Section 3 presents the main theoretical arguments that support the determinant factors considered. Section 4 describes the empirical strategy and discusses the results. The last section provides some final remarks.
2. BACKGROUND
What is a good or bad job? Although widely addressed in several social sciences, there is no consensus on the answer (Cloutier-Villeneuve, 2012; Sutherland, 2012, 2016; Simões et al., 2015). In economics, the measurement of job quality has been addressed through two alternative approaches: macro-level and micro-level indicators.
The development of macro-level indicators (i.e. indicators that select macroeconomic measures for the set of dimensions that are relevant for
characterizing job quality) was mainly driven by the importance of this topic on the international agenda. The goal of “promoting more and better jobs” included in the Lisbon Strategy, the debate on “decent work” motivated by the ILO, and the attention given by the OECD to the need for policies for “more and better jobs” have played a key role in the development of this type of job quality indices. In fact, the emphasis given to this area at policy level has created the need for aggregate indicators that measure job quality at national and international levels. Several proposals for macro-level indicators were presented, including the Laeken indicators, the Good Job Index, and the European Job Quality Index. These proposals are based on a broad concept of job quality that includes dimensions related not only with the job itself but also with the labour market.
Alternatively, the micro-level indicators are based on a definition of job quality that is more worker-focused and considers the characteristics of the job (i.e. objective dimensions) as well as dimensions related with the job-worker relationship (i.e. subjective dimensions).
Obviously some studies based on micro-level indicators also aim to respond to the need that emerged at the international level of measuring the quality of the jobs (the main motivation of the macro-level analysis). However, their motivations are more comprehensive, also including the evaluation of how the dimensional indices influence the overall assessment that workers make of their jobs (Kalleberg and Vaisey, 2005; Hartikainen et al., 2010), the analysis of the influence of norms and expectations on this assessment (Brown et al., 2007), the identification of the determinant factors of some job quality dimensions (Green and McIntosh, 2001; Smith et al., 2008; Hartikainen et al., 2010; Mühlau, 2011), and the study of the usefulness of job quality and job satisfaction indicators as predictors of job separations and quits (Clark, 2001; Delfgaauw, 2007). The present study belongs to the micro-level approach.
In the context of this approach, the most common option is to assume that the best way to characterize the quality of a job is by evaluating its several dimensions, hence a multidimensional approach is often used. Obviously, different studies use different sets of dimensions. However, the analysis of the empirical studies conducted in this area allows us to identify several dimensions that are usually considered, including: (i) pay, autonomy, intensity, job security, physical working conditions, health, learning, and promotion prospects, regarding the objective dimensions; (ii) work-life balance, intrinsic rewards, and interpersonal relations, concerning the subjective dimensions.
The empirical approaches to measuring job quality vary in terms of the importance given to the objective and subjective dimensions. We can consider three main approaches. At one extreme we find proposals that base their analysis on dimensions related to working conditions. In this case the measurement focuses on the objective facets of the job (McGovern et al., 2004; Amossé and Kalugina, 2010). At the other extreme, following a strategy closer to the literature on job satisfaction, there are proposals in which the weight of the subjective dimensions (i.e. dimensions strongly influenced by the perceptions of employees) is predominant (Brown et al., 2007). Finally, the dominant approach combines objective and subjective dimensions (e.g. Kalleberg et al., 2000; Clark, 2005; Green, 2006).
Measuring job quality through micro indicators implies a sequence of methodological options. First, it is necessary to select the dimensions of job quality to include in the analysis. Second, the proxies for each of these dimensions must be chosen. Third, it is necessary to choose between an individualized analysis of each dimension and their inclusion in a composite index. If a composite index is adopted, it is still necessary to choose the weights to assign to each dimension. Concerning this last matter, there are two possibilities: (i) equal weights to all dimensions; and (ii) varying weights, as a function of the relative importance of each dimension to define job quality. The first option is the most common in the literature, as discussed, for instance, by Tangian (2005).
Following a different approach, some researchers consider that the best way to take into account all aspects associated with the job, using a weighting system that is adequate to the preferences of each individual (Hammermesh, 2001), is to consider job satisfaction as a proxy for job quality (Diaz-Serrano and Vieira, 2005; Green, 2006). This approach is criticized, however, for two main reasons. First, it introduces more subjectivity into the analysis. Second, it fails to identify the (qualitative and quantitative) importance assigned to each dimension incorporated in the concept of job quality.
3. POTENTIAL DETERMINANTS OF JOB QUALITY
The main goal of this study is to explain the individual level of job quality as a function of two groups of determinants: the socio-economic characteristics of the workers and the characteristics of the firms. Thus, we have:
(
)
, , , , ,
, , .
Job Quality f Gender Age Nationality Education Employment Status Ownership Sector Firm Size Economic Sector
In this section we provide a survey of the main theoretical arguments that support the influence of these factors on job quality. Subsequently, in Section 4, we discuss their empirical importance in the European case.
3.1. Worker related characteristics
Gender: there is an extensive literature that analyzes the differences
between men and women concerning in particular wages, occupations and promotions (Altonji and Blank, 1999; Blau and Kahn, 2006; Stier and Yaish, 2014). We can consider three main explanations for the gender gap: differences in productivity, differences in preferences, and discrimination in the labour market.
Regarding the first group of explanations, two reasons are usually advanced for the gender differential. The first explains it through the human capital theory (Becker, 1957; Munasinghe et al., 2008), highlighting differences derived from schooling before entering the labour market or the consequences associated with maternity career breaks, which are likely to reduce accumulated experience and vocational training of mothers (Budig and England, 2001; Kalist, 2008). On the other hand, the lower productivity of women may also derive from the division of labour in the family, which traditionally implies the greater participation of women in domestic tasks, reducing their physical and psychological availability and affecting their productivity at work (Becker, 1985).
In terms of preferences, recent studies show that men and women have different preferences for competitive environments. Based on laboratory experiments, Niederle and Vesterlund (2007) and Dohmen and Falk (2011), conclude that women have a lower propensity to choose competitive environments, which can be explained by differences in risk attitudes, confidence, and preferences for performing in this context (Stier and Yaish, 2014). These differences have implications in terms of occupations held by men and women, as well as in the access to top corporate jobs.
The theories of discrimination offer a third rationale for the gender gap. In this case, differences might arise due to “taste discrimination”, i.e. the prejudice-based behaviours of employers (Becker, 1957), or to “statistical discrimination”, i.e. discrimination caused by information asymmetries (Phelps, 1972; Arrow, 1973).
Several empirical studies on the occupational distribution of men and women conclude that women tend to choose occupations with a lower injury or death risk. According to DeLeire and Levy (2004) this evidence stems
from the fact that men and women have different degrees of risk aversion. Mothers tend to choose safer jobs due to their responsibility in raising children. The effect of parenthood also influences men’s behaviour but to a lesser degree than among women.
Taking as reference a wide concept of job quality, Mühlau (2011) obtains evidence of significant differences between genders regarding several working conditions, concluding that men tend to have jobs that involve more investment in human capital, greater autonomy, more complex tasks, more opportunities for career advancement, and more participation. On the other hand, women have less risky jobs and achieve a better balance between family and work. Pointing in the same direction, several studies support the idea that female-dominated occupations are characterized by lower wages and fewer job opportunities (Levanon et al., 2009; Stier and Yaish, 2014).
Age: age is another important determinant of job quality, however the
link between age and job quality must be established indirectly. In fact, age is strongly associated with work experience and seniority (Mumford and Smith, 2004) and these variables are associated with job quality. Taking this evidence as a starting point, the literature on learning in labour markets (Jovanovic, 1979) and on stepping-stone models (Burdett, 1978) suggests a positive relationship between job quality and age through the quality of matches. The learning models assume that workers do not have ex-ante information before the match and therefore the quality of a given job is revealed only with time spent on the job. In this sense, good jobs result in longer matches. The second group of models makes the opposite assumption (perfect ex-ante information) and argues that workers decide to quit jobs when they find a better offer. Thus, the jobs that survive longer are those in which the employee believes that the alternatives are worse than the actual position.
The human capital theory (Becker, 1962), offers another rationale for the negative correlation between tenure and separation rates which is based on the accumulation of specific human capital. Over time, workers acquire relevant knowledge to perform their jobs and this has a positive impact on their productivity. Therefore leaving the firm implies a loss for both employer and employee.
Nationality: a vast literature on migration suggests the existence of a
negative differential in the quality of jobs between migrants and natives. The theoretical arguments for this gap are similar to those presented in the above discussion concerning the gender gap (with the exception of the argument related with preferences, which in this case does not apply). The human
capital theory suggests that the fact that migrants have, on average, lower quality jobs results from problems related with the international transferability of human capital, i.e. the fact that the human capital acquired in the home country is not fully transferable to other countries due to insufficient quality or imperfect adaptation to the context of the destination country. Empirical studies on this issue show that this problem is more important upon arrival in the host country. Subsequently, it is usual to observe a convergence between migrants and natives in terms of wages (Friedberg, 2000) and occupational status (Bauer and Zimmermann, 1999).
A second theoretical argument for this differential derives from discrimination theories. Migrant workers may be discriminated against due to the two reasons mentioned above in the discussion about the influence of gender. Taste-based discrimination can occur when migrants are discriminated against because employers, co-workers, or customers have a dislike for some ethnic groups (Becker, 1957). On the other hand, the statistical discrimination argument justifies this behaviour with imperfect or incomplete information. In such a case, employers make human resources management decisions (e.g. hiring, pay schemes, task assignment, and promotions) using a characteristic easily observed and potentially correlated with unobservable ability.
Education: investment in education yields several returns. A vast
empirical literature quantifies the dimension of the monetary benefits associated with additional years of schooling (for a review see Card, 1999). According to the human capital theory, these gains derive essentially from the positive influence of education on the productivity of the workers (Becker, 1964; Mincer, 1974).
More recently other authors have stressed that the effects of education should be more widely assessed in order to include non-pecuniary dimensions. Regarding these dimensions, education allows important gains in terms of job content, work environments with lower risks to health, job security, and autonomy (Vila, 2000; Fabra and Camisón, 2009). A possible explanation for these gains stems from the fact that education increases job searching ability (Arrow, 1997). High levels of education generate skills that allow individuals to more efficiently reach jobs that better match their aspirations.
Employment status: the choice between working as self-employed or as
an employee can affect the quality of jobs. Recent research on this topic shows that self-employed individuals have higher levels of job satisfaction (Blanchflower and Oswald, 1998; Blanchflower, 2000; Benz and Frey,
2008a), and that this differential is caused by several dimensions associated with the process and content of work, such as greater autonomy, the more effective use of skills, and a more interesting job. This result has led some authors (Frey et al., 2004; Benz, 2008) to suggest the existence of procedural utility (i.e. utility derived from the "procedures and conditions leading to outcomes" – Benz and Frey, 2008b; 446) that may overlap with the outcome utility (i.e. utility derived from income and leisure).
Although these studies point to the better situation of the self-employed compared to wage-earners in terms of job quality, it should be noted that this latter group is not homogeneous. In this context, the type of contract is an important differentiating factor. Several studies have shown important differences between fixed-term contracts and permanent contracts regarding pay, training, and career prospects (Farber, 1999; Brown and Sessions, 2003). As expected, García-Serrano (2004) concludes that this difference also applies to temporary workers who also hold jobs with poorer working conditions than those of permanent workers.
3.2. Firm related characteristics
Ownership Sector: the ownership sector to which the worker’s firm
belongs is a potential determinant of job quality. As with other variables, the distinction between the public and private sector has been established at the level of wages, with broad evidence of a public sector wage premium. This premium is highest for the lower end of the wage distribution and for women. Explanations for this differential include the existence of distinct objectives and different competition levels between the private and public sectors, among other factors, as reviewed comprehensively by Bender (1998) and Gregory and Borland (1999). Moreover, based on a broad concept of job quality, Demoussis and Giannakopoulos (2007) and Ghinetti (2007) conclude that public sector workers have a higher level of satisfaction with their wages, working hours, and especially with the stability of their jobs.
Firm Size: the existence of the positive effect of firm size on wages is
a recognized fact, despite considerable quantitative differences across countries (Lallemand et al., 2007). Several explanations have been advanced for this relationship: (i) large firms hire higher quality workers; (ii) the wage differential is a compensation for poorer working conditions; (iii) higher rent sharing with the workers, enhanced by greater market power held by large firms; (iv) the wage premium aims to reduce monitoring costs; or (v) larger firms have on average higher rates of unionization. Despite the lack of
consensus on the dominant reason for this wage differential, the influence of firm size on the quality of jobs seems clear.
Taking a broader approach, other researchers have found that larger firms not only offer higher wages but also provide more stable jobs (Brown and Medoff, 1989; Oi and Idson, 1999). Various explanations have been presented for this puzzling evidence. For instance, Rebitzer (1986) argues that this evidence reflects the fact that larger firms possess more developed internal labour markets than do smaller firms, offering better prospects in terms of wages, promotions, and opportunities for internal mobility, reflecting the labor market segmentation theory. Winter-Ebmer (2001) emphasizes two alternative explanations: “larger firms employ different workers than small ones. Workers who seek good training opportunities, are risk-averse, and are less willing to change jobs frequently may prefer employment at a large firm. On the other hand, large firms may actively seek stable workers, because otherwise investment into sophisticated capital equipment and firm-specific training will be less useful” (Winter-Ebmer, 2001; p.480).
Economic Sector: as in several of the above-mentioned dimensions, the
analysis of inter-industry differences has its focus on wage differentials. Several studies (e.g. Krueger and Summers, 1988; Genre at al., 2005; Gannon et al., 2007) suggest the existence of a considerable wage inequality between sectors, persisting for long periods of time (Edin and Zetterberg, 1992; Gittleman and Wolff, 1993). This is a stylized fact for many countries, despite its variable magnitude (Hartog et al., 1997), tending to be less pronounced in corporatist countries.
Four main explanations for the importance of this determinant factor can be highlighted: (i) differences in the quality of individuals employed in different sectors; (ii) differences in working conditions; (iii) sectoral differences regarding the propensity to implement mechanisms such as efficiency wages, and (iv) differences in terms of rent-sharing mechanisms which are strongly influenced by the bargaining power of workers.
4. MODEL AND RESULTS 4.1. Methodological approach
The main goal of this study is, as emphasized above, to identify job quality determinants in Europe. To that end, we propose a micro-level multidimensional indicator that incorporates the objective and subjective
dimensions of job quality most often considered in the literature (for a discussion see for instance Hauff and Kirchner, 2014). Specifically, our job quality index includes eleven dimensions
(
d =
1,2, ,11
…
)
grouped into three categories: (i) core objective dimensions, (ii) complementary objective dimensions, and (iii) subjective dimensions.The first group (core objective dimensions) includes five dimensions: (i) pay (D1), i.e. wage and other benefits paid to the worker; (ii) physical working conditions (D2), i.e. a set of aspects related to the physical work environment (e.g. temperature, noise, dirtiness, air quality) and the physical requirements of the job (e.g. tiring or painful positions, carrying or moving heavy loads); (iii) intensity (D3), i.e. the work flow rhythm (captured by perceived work speed and the existence of tight deadlines); autonomy (D4), i.e. the ability to define how, when, and at what speed the work is done; job security (D5), i.e. the level of stability associated with the employment contract.
In the second group of objective dimensions (complementary objective dimensions) we consider three additional dimensions: health (D6), i.e. whether the job has health risks for the worker; promotion opportunities (D7), i.e. prospects for career development; learning (D8), i.e. the opportunity to increase either general or specific human capital.
However, we propose a concept of job quality that in addition to the characteristics of the job also attends to job-worker dimensions (i.e. subjective dimensions): work-life balance (D9), i.e. the balance that the worker is able to keep between family responsibilities and professional life; interpersonal relations (D10), i.e. whether in general terms the perceived environment with co-workers is friendly; intrinsic rewards (D11), i.e. the degree of satisfaction with the work done.
We consider data from the Fourth EWCS. This survey contains evidence for 31 European countries (27 EU Member States plus Croatia, Norway, Switzerland, and Turkey). The sample considered in this study includes 18,816 workers
(
i =1, 2, ,18,816…)
. This sample results from the need to exclude workers who did not respond or did not know how to answer to: (i) the questions that support the assessment of each dimension; and (ii) the questions supporting the explanatory variables included in the model. Table 1 presents the composition of the sample.The individuals comprising the sample are equally divided between the two genders. Most of them are between 25 and 54 years of age, native of the country where they are working, have upper secondary education, work in the private sector, in a small firm, as an employee with an indefinite term
Table 1
Composition of the sample
Variables N % Variables N %
Worker characteristics Economic sector (cont.)
Hotels and Restaurants 810 4.30%
Gender Transport and Communication 1273 6.77%
Female 9295 49.40% Financial Intermediation 708 3.76%
Male 9521 50.60% Real Estate 1425 7.57%
Age group Public Administration and
Defense 1447 7.69%
15–24 1677 8.91% Education and Health 4229 22.48%
25–39 7085 37.65%
40–54 7407 39.37% Country in which the individual works
55–64 2647 14.07%
Nationality Country
Native 18065 96.01% Austria 452 2.40%
Migrant 751 3.99% Belgium 660 3.51%
Education Cyprus 470 2.50%
Primary education 1397 7.42% Czech Republic 459 2.44%
Lower secondary education 2468 13.12% Germany 592 3.15%
Upper secondary education 7655 40.68% Denmark 706 3.75%
Post–secondary education 2101 11.17% Estonia 350 1.86%
Tertiary education 5195 27.61% Spain 568 3.02%
Employment status Finland 879 4.67%
Self–employed – no employees 1596 8.48% France 576 3.06%
Self–employed – with employees 779 4.14% Greece 737 3.92%
Employee – indefinite term
contract 12771 67.87% Hungary 714 3.79%
Employee – fixed term contract 1761 9.36% Ireland 709 3.77%
Employee – Others 1909 10.15% Italy 564 3.00%
Lithuania 546 2.90%
Firm characteristics Luxembourg 364 1.93%
Latvia 681 3.62%
Ownership sector Netherlands 715 3.80%
Private sector 11895 63.22% Malta 406 2.16%
Public sector 5687 30.22% Poland 571 3.03%
Other sectors 1234 6.56% Portugal 581 3.09%
Firm size Sweden 869 4.62%
Small firm 12441 66.12% Slovenia 411 2.18%
Medium firm 3902 20.74% Slovakia 657 3.49%
Large firm 2473 13.14% United Kingdom 525 2.79%
Economic sector Norway 702 3.73%
Agriculture and Fishing 959 5.10% Switzerland 753 4.00%
Manufacture and Mining 3480 18.49% Bulgaria 669 3.56%
Electricity, Gas, Water Supply 333 1.77% Croatia 633 3.36%
Construction 1345 7.15% Romania 609 3.24%
Wholesale and Retail Trade 2807 14.92% Turkey 688 3.66%
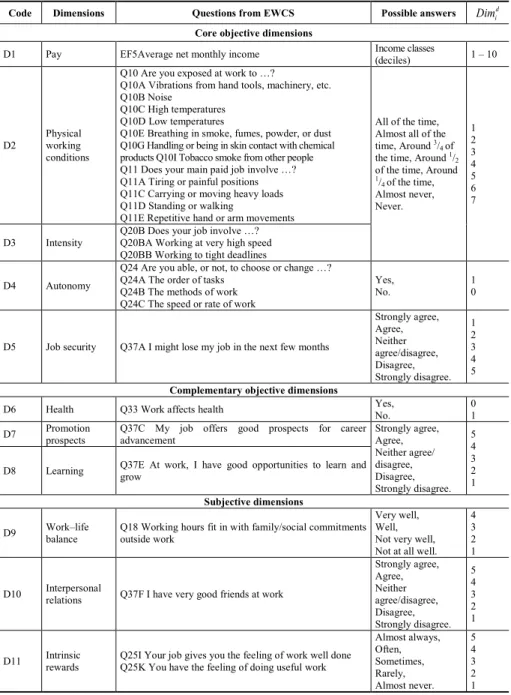
Table 2 Job quality dimensions
Code Dimensions Questions from EWCS Possible answers d i
Dim
Core objective dimensions
D1 Pay EF5Average net monthly income Income classes (deciles) 1 – 10
D2 Physical working conditions
Q10 Are you exposed at work to …?
Q10A Vibrations from hand tools, machinery, etc. Q10B Noise
Q10C High temperatures Q10D Low temperatures
Q10E Breathing in smoke, fumes, powder, or dust Q10G Handling or being in skin contact with chemical products Q10I Tobacco smoke from other people Q11 Does your main paid job involve …? Q11A Tiring or painful positions Q11C Carrying or moving heavy loads Q11D Standing or walking
Q11E Repetitive hand or arm movements
All of the time, Almost all of the time, Around 3/
4 of
the time, Around 1/ 2
of the time, Around
1/ 4 of the time, Almost never, Never. 1 2 3 4 5 6 7 D3 Intensity Q20B Does your job involve …? Q20BA Working at very high speed
Q20BB Working to tight deadlines D4 Autonomy
Q24 Are you able, or not, to choose or change …? Q24A The order of tasks
Q24B The methods of work Q24C The speed or rate of work
Yes,
No. 1 0
D5 Job security Q37A I might lose my job in the next few months
Strongly agree, Agree, Neither agree/disagree, Disagree, Strongly disagree. 1 2 3 4 5 Complementary objective dimensions
D6 Health Q33 Work affects health Yes, No. 0 1 D7 Promotion prospects Q37C My job offers good prospects for career advancement Strongly agree, Agree,
Neither agree/ disagree, Disagree, Strongly disagree. 5 4 3 2 1 D8 Learning Q37E At work, I have good opportunities to learn and grow
Subjective dimensions
D9 Work–life balance Q18 Working hours fit in with family/social commitments outside work
Very well, Well, Not very well, Not at all well.
4 3 2 1 D10 Interpersonal relations Q37F I have very good friends at work
Strongly agree, Agree, Neither agree/disagree, Disagree, Strongly disagree. 5 4 3 2 1 D11 Intrinsic rewards Q25I Your job gives you the feeling of work well done Q25K You have the feeling of doing useful work
Almost always, Often, Sometimes, Rarely, Almost never. 5 4 3 2 1
contract. The sectors with the highest employment shares are Manufacturing and Mining (NACE 2) and Education and Health (NACE 11).
Table 2 identifies the questions used to assess each of the dimensions mentioned above as well as their response scale (which we designate as
d i
Dim ). For some questions it was necessary to invert the EWCS response
scale in order to assure that more favourable situations receive higher classifications.
Since the response scales are different, we normalize them to the interval [0,1] through the max-min method. The dimensional indices normalized are designated as d
i
D . Finally, the job quality index for individual i can be
obtained as: 11 1 . d i d i d JQ β D = =
∑
(2)As highlighted in Section 2, the most common option is to consider equal weights for all dimensions. Following this strategy, we consider βd =1/11.
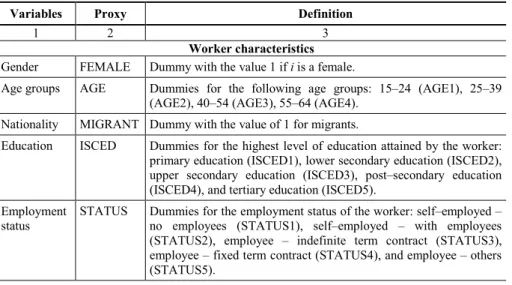
The methodology described above allows us to calculate a job quality index for each worker of the sample. Based on these individual indices, we estimate an econometric model to identify the determinants of job quality in Europe. Table 3 presents the list of explanatory variables used in the empirical analysis.
Table 3
Definition of the explanatory variables
Variables Proxy Definition
1 2 3
Worker characteristics
Gender FEMALE Dummy with the value 1 if i is a female.
Age groups AGE Dummies for the following age groups: 15–24 (AGE1), 25–39 (AGE2), 40–54 (AGE3), 55–64 (AGE4).
Nationality MIGRANT Dummy with the value of 1 for migrants.
Education ISCED Dummies for the highest level of education attained by the worker: primary education (ISCED1), lower secondary education (ISCED2), upper secondary education (ISCED3), post–secondary education (ISCED4), and tertiary education (ISCED5).
Employment
status STATUS Dummies for the employment status of the worker: self–employed – no employees (STATUS1), self–employed – with employees (STATUS2), employee – indefinite term contract (STATUS3), employee – fixed term contract (STATUS4), and employee – others (STATUS5).
Table 3, cont.
1 2 3
Firm characteristics
Ownership
sector PROP Dummies for the type of sector in which the firm operates: private sector (PROP1), public sector (PROP2), and others (PROP3). Firm size SIZE Dummies for the size of the firm in terms of number of employees: small – 1 to 49 employees (SIZE1), medium – 50 to 249 employees (SIZE2), and large – more than 249 employees (SIZE3).
Economic
sector NACE Dummies for the main economic sector of the firm: Agriculture and Fishing (NACE1), Manufacture and Mining (NACE2), Electricity, Gas, and Water Supply (NACE3), Construction (NACE4), Wholesale and Retail Trade (NACE5), Hotels and Restaurants (NACE6), Transport and Communication (NACE7), Financial Intermediation (NACE8), Real Estate (NACE9), Public Administration and Defense (NACE10), and Education and Health (NACE11).
Source: authors’ proposal
When the dependent variable is bounded, the OLS method may result in biased and inconsistent parameter estimates. The twice-censored Tobit regression model (Rosett and Nelson, 1975) is one of the methods available to overcome this problem. The results obtained from the estimation of a Tobit model for our job quality index are presented in Table 4.
Table 4
Determinants of job quality in Europe
JQi
Dimensional Indices Core Objective Dimensions D1
Pay Phy. Work. Cond. D2 Intensity D3 Autonomy D4 Job Security D5
1 2 3 4 5 6 7 FEMALE –0.0165*** (–7.97) –0.2278*** (–43.66) 0.0553*** (20.96) –0.0044 (–0.76) –0.0844*** (–5.06) –0.0057 (–0.65) AGE1 –0.0003 (–0.08) –0.2243*** (–24.24) –0.0091 (–1.96) –0.0093 (–0.90) –0.1712*** (–5.95) –0.0276 (–1.80) AGE2 0.0002 (0.11) –0.0538*** (–9.88) –0.0100*** (–3.62) –0.0326*** (–5.30) –0.0149 (–0.85) –0.0114 (–1.23) AGE4 0.0153*** (5.15) –0.0256*** (–3.43) 0.0327*** (8.68) 0.0586*** (6.97) 0.0649** (2.67) 0.0391** (3.03) MIGRANT –0.0317*** (–6.22) –0.0528*** (–4.15) –0.0449*** (–6.95) 0.0044 (0.30) –0.1338*** (–3.32) –0.0846*** (–3.98) ISCED1 –0.0463*** (–10.67) –0.1589*** (–14.68) –0.0707*** (–12.87) 0.0204 (1.65) –0.2005*** (–5.77) –0.0457* (–2.50) ISCED2 –0.0264*** (–8.41) –0.0961*** (–12.19) –0.0433*** (–10.87) 0.0094 (1.06) –0.1680*** (–6.76) –0.0177 (–1.33) ISCED4 0.0271*** (7.90) 0.0880*** (10.31) 0.0267*** (6.12) –0.0026 (–0.27) 0.1032*** (3.76) 0.0246 (1.68) ISCED5 0.0673*** (26.16) 0.2780*** (42.71) 0.0960*** (29.28) 0.0209** (2.88) 0.3612*** (17.02) 0.0597*** (5.36) STATUS1 0.0202*** (5.17) –0.0419*** (–4.27) 0.0101* (2.04) 0.0693*** (6.25) 0.8151*** (22.56) 0.1361*** (8.03) STATUS2 0.0675*** (13.61) 0.1665*** (13.06) 0.0009 (0.15) –0.0428** (–3.05) 0.8091*** (16.79) 0.2652*** (11.77)
1 2 3 4 5 6 7 STATUS4 –0.0357*** (–10.66) –0.1460*** (–17.42) –0.0073 (–1.71) 0.0167 (1.76) –0.0968*** (–3.69) –0.3127*** (–22.52) STATUS5 –0.0266*** (–7.69) –0.1513*** (–17.32) –0.0153*** (–3.50) 0.0131 (1.33) –0.0778** (–2.86) –0.1426*** (–9.84) PROP2 0.0181*** (6.11) 0.0037 (0.49) –0.0110** (–2.91) 0.0657*** (7.81) 0.0069 (0.29) 0.0899*** (7.05) PROP3 –0.00237 (–0.58) –0.0324** (–3.13) –0.0091 (–1.74) 0.0147 (1.26) –0.0483 (–1.48) 0.0116 (0.66) SIZE2 –0.0051* (–2.06) 0.0630*** (10.18) –0.0079* (–2.49) –0.0482*** (–6.86) –0.0955*** (–4.86) 0.0171 (1.60) SIZE3 –0.0047 (–1.55) 0.1082*** (14.16) –0.0171*** (–4.44) –0.0595*** (–6.95) –0.0701** (–2.91) 0.0086 (0.66) NACE1 –0.0265*** (–5.20) –0.1389*** (–10.81) –0.0265*** (–4.11) 0.0429** (2.98) 0.2388*** (5.57) 0.0967*** (4.46) NACE3 0.0543*** (7.26) 0.0869*** (4.63) 0.0669*** (7.04) 0.0156 (0.74) 0.2315*** (3.82) 0.0292 (0.91) NACE4 0.0012 (0.27) 0.0645*** (6.08) –0.0588*** (–10.90) –0.0381** (–3.18) 0.0945** (2.79) –0.0227 (–1.27) NACE5 0.0203*** (5.98) –0.0322*** (–3.79) 0.0729*** (16.91) 0.1207*** (12.56) 0.1392*** (5.16) –0.0118 (–0.83) NACE6 –0.0128* (–2.47) –0.0204 (–1.57) 0.0160* (2.44) –0.0183 (–1.25) 0.2107*** (5.11) –0.0135 (–0.62) NACE7 0.0029 (0.68) 0.0541*** (5.01) 0.0739*** (13.45) 0.0257* (2.10) –0.1023** (–3.04) –0.0350 (–1.93) NACE8 0.0781*** (14.32) 0.1470*** (10.57) 0.1681*** (23.99) 0.0726*** (4.73) 0.2637*** (5.95) 0.0649** (2.77) NACE9 0.0467*** (11.05) 0.0307** (2.87) 0.1188*** (22.06) 0.0469*** (3.94) 0.2743*** (7.89) 0.0145 (0.80) NACE10 0.0467*** (9.94) 0.0385** (3.28) 0.1196*** (19.99) 0.0795*** (5.98) 0.2118*** (5.65) 0.1373*** (6.70) NACE11 0.0356*** (9.33) –0.0386*** (–4.04) 0.0633*** (13.08) 0.121*** (11.22) 0.2501*** (8.19) 0.1324*** (8.12) Constant 0.6540*** (81.76) 0.7760*** (38.81) 0.6574*** (64.71) 0.3755*** (16.63) 1.2980*** (20.04) 0.9432*** (27.64) Country Dummies Yes Yes Yes Yes Yes Yes Number of observations 18,816 18,816 18,816 18,816 18,816 18,816 Log–likelihood 11,881.68 –8,011.78 6,186.62 –10,117.60 –16,871.29 –14,035.36
σ 0.129 0.313 0.163 0.357 0.892 0.501
Table 4 cont.
Determinants of job quality in Europe (cont.)
Dimensional indices Complementary Objective Dimensions
Dimensional indices Subjective Dimensions D6 Health D7 Promotion Prospects D8 Learning D9 Work–Life Balance D10 Inter. Relations D11 Intrinsic Rewards 1 2 3 4 5 6 7 FEMALE 0.1337*** (3.92) –0.0544*** (–8.39) –0.0261*** (–4.02) 0.0429*** (6.61) –0.0083 (–1.42) –0.0048 (–0.78) AGE1 0.5691*** (9.12) 0.1433*** (12.55) 0.0984*** (8.60) 0.0199 (1.74) –0.0056 (–0.54) –0.0976*** (–9.24) AGE2 0.1043** (2.94) 0.0876*** (12.90) 0.0469*** (6.89) –0.0286*** (–4.22) –0.0022 (–0.35) –0.0342*** (–5.31) AGE4 0.2544*** (5.24) –0.0683*** (–7.31) –0.0244** (–2.63) 0.0719*** (7.68) 0.0150 (1.77) 0.0561*** (6.23) MIGRANT –0.1819* (–2.15) –0.0391* (–2.45) –0.0700*** (–4.41) –0.0386* (–2.45) –0.0008 (–0.05) –0.0385** (–2.59)
1 2 3 4 5 6 7 ISCED1 –0.1677* (–2.38) –0.1070*** (–7.74) –0.1318*** (–9.71) –0.0138 (–1.03) 0.0009 (0.07) –0.0201 (–1.57) ISCED2 –0.0893 (–1.72) –0.0483*** (–4.88) –0.0612*** (–6.25) –0.0118 (–1.20) 0.0005 (0.05) –0.0065 (–0.71) ISCED4 –0.0015 (–0.03) 0.0672*** (6.29) 0.0935*** (8.73) –0.0038 (–0.35) 0.0199* (2.03) 0.0324** (3.16) ISCED5 0.1311** (3.11) 0.1404*** (17.52) 0.1692*** (20.98) 0.0041 (0.50) –0.0174* (–2.38) 0.0071 (0.92) STATUS1 –0.2154*** (–3.38) 0.0117 (0.95) 0.0868*** (7.07) –0.0259* (–2.13) –0.1835*** (–16.73) 0.0973*** (8.22) STATUS2 –0.1030 (–1.27) 0.1844*** (11.90) 0.2230*** (14.12) –0.0678*** (–4.43) 0.0405** (2.85) 0.1873*** (11.86) STATUS4 0.1937*** (3.49) –0.0288** (–2.75) –0.0187 (–1.78) –0.0150 (–1.44) –0.0398*** (–4.21) –0.0215* (–2.20) STATUS5 0.0715 (1.25) –0.0486*** (–4.46) –0.0117 (–1.08) 0.0062 (0.57) –0.0153 (–1.55) –0.0182 (–1.79) PROP2 –0.0564 (–1.16) –0.0048 (–0.51) 0.0462*** (4.98) 0.0539*** (5.78) 0.0407*** (4.80) 0.0242** (2.74) PROP3 –0.1550* (–2.29) 0.0079 (0.61) 0.0168 (1.30) 0.0224 (1.74) 0.0077 (0.66) –0.0052 (–0.43) SIZE2 –0.1181** (–2.91) 0.0100 (1.28) 0.0020 (0.25) –0.0216** (–2.78) 0.0252*** (3.56) –0.0244*** (–3.33) SIZE3 –0.2243*** (–4.52) 0.0337*** (3.56) 0.0168 (1.77) –0.0639*** (–6.74) 0.0323*** (3.72) –0.0230* (–2.57) NACE1 –0.2964*** (–3.57) –0.1678*** (–10.26) –0.1254*** (–7.85) –0.0594*** (–3.79) –0.0323* (–2.25) –0.0237 (–1.58) NACE3 0.1844 (1.51) 0.0985*** (4.24) 0.1242*** (5.33) 0.0803*** (3.39) 0.0691** (3.19) 0.0764*** (3.40) NACE4 –0.3056*** (–4.42) 0.0325* (2.45) 0.0578*** (4.36) –0.0156 (–1.18) 0.0043 (0.36) 0.0475*** (3.77) NACE5 0.3834*** (6.83) 0.0023 (0.22) 0.0016 (0.15) –0.0365*** (–3.46) –0.0170 (–1.76) –0.0358*** (–3.61) NACE6 –0.0751 (–0.89) –0.0520** (–3.20) –0.0591*** (–3.68) –0.1265*** (–7.94) –0.0002 (–0.01) –0.0213 (–1.41) NACE7 0.0068 (0.10) 0.0095 (0.70) –0.0311* (–2.31) –0.0615*** (–4.59) 0.0017 (0.14) 0.0112 (0.88) NACE8 0.4132*** (4.50) 0.1861*** (10.98) 0.140*** (8.16) 0.0695*** (4.02) –0.0190 (–1.23) 0.0184 (1.15) NACE9 0.3950*** (5.63) 0.0859*** (6.52) 0.0982*** (7.39) 0.0228 (1.72) –0.0122 (–1.01) 0.0067 (0.54) NACE10 0.2514** (3.28) 0.0720*** (4.92) 0.0676*** (4.60) 0.0106 (0.72) –0.0249 (–1.86) –0.0014 (–0.10) NACE11 –0.0603 (–0.97) –0.0105 (–0.88) 0.0825*** (6.93) 0.0076 (0.64) 0.0003 (0.03) 0.1095*** (9.61) Constant –0.3880** (–2.97) 0.3750*** (14.98) 0.7025*** (28.07) 0.7811*** (31.25) 0.9419*** (40.96) 0.9291*** (39.76) Country Dummies Yes Yes Yes Yes Yes Yes Number of
observations 18,816 18,816 18,816 18,816 18,816 18,816 Log–likelihood –12,061,40 –12,079,63 –12,155.07 –11,979.87 –10,602.08 –10,169.13
σ – 0.389 0.387 0.383 0.348 0.348
Notes: (1) For the overall job quality index model, the reference category is: male, aged 40-54, non-migrant, with upper-secondary education, working in the wage sector with an indefinite contract, with a job in a micro-firm in the private sector operating in Manufacture and Mining, in Sweden; (2) *, **, *** significant at 10%, 5%, and 1%, respectively.
In order to achieve a more detailed assessment of the determinants of job quality in Europe, the same table presents the effects produced by the two sets of explanatory variables on each of the eleven dimensional indices described above. Regarding the dimension D6 (Health), we consider a logit model because the values assumed in this dimension are 0 or 1. In the case of the other ten dimensions, we estimate twice-censored Tobit models. Country dummies are included in order to control for the possible heterogeneity in terms of job quality between European countries.
4.2. Results – worker characteristics
The first group of variables included in the model refers to several socio-economic characteristics of the worker (gender, age, nationality, education, and employment status). The findings presented in Table 4 show that all these variables have a significant effect on the job quality index.
The human capital theory and the theories of discrimination have similar predictions about the influence of gender on job quality, identifying a lower level of job quality in the case of women. The results obtained in our analysis confirm this theoretical prediction as well as the dominant empirical conclusion (Cloutier-Villeneuve, 2012; Jung and Cho, 2016). The evaluation of the dimensional models suggests that this disadvantage results from four objective dimensions (pay, autonomy, promotion prospects, and opportunities for learning), the penalty being highest in the case of pay. Despite the negative effect associated with these dimensions – with the consequent impact in terms of the overall level of job quality – in line with the results obtained by Mühlau (2011), women show an advantage in three dimensions, namely physical working conditions, health and work-life balance.
Regarding the effect of age, as expected according to the learning and stepping stone models discussed in Section 3, the results show that, in line with evidence for South Korea and Australia (Jung and Cho, 2016), belonging to the 55-64 age group (AGE4) gives access to better jobs. The advantage of this age group stems primarily from a more favorable situation in terms of: (i) work-life balance and satisfaction with the work performed (subjective dimensions); (ii) better physical working conditions, increased autonomy, lower intensity, and higher job security (core objective dimensions); (iii) lower risks for health (complementary objective dimension).
The remaining age groups showed no statistically significant differences in terms of their overall level of job quality. However, the dimensional analysis allows us to identify important differences in terms of specific aspects of the job. For example, the youngest age group (AGE1) shows a much lower level of job quality (compared to the reference category – AGE3) concerning pay, autonomy, and intrinsic rewards, while a positive impact is evident in the case of the three complementary objective dimensions (health, promotion prospects, and learning).
Theoretical and empirical studies on the influence of nationality on wages suggest an important effect of being a migrant on average earnings. The evidence presented in Table 4 allows for a broader assessment of the impact of nationality on several dimensions of working conditions. It is possible to conclude that being a migrant has a negative effect not only on wages but also on other dimensional indices, affecting nine of the eleven indices under analysis, the exceptions being intensity and interpersonal relations, in which there seems to be no statistically significant difference between natives and migrants.
Our results show, in line with the evidence provided by Simões et al. (2015), that education is a key determinant of job quality, introducing a considerable level of inequality between the individuals. As expected, additional levels of education enormously increase the quality of jobs, with the effect being monotonous in the case of all objective dimensions. The gains associated with higher levels of education stem primarily from an advantage in terms of pay, autonomy, promotions, and learning. Our results confirm, therefore, the evidence presented by several empirical studies suggesting the existence of considerable non-monetary benefits associated with additional education levels (McMahon, 1998; Vila, 2000; Fabra and Camisón, 2009; Jung and Cho, 2016).
Finally, let us consider the effect associated with the employment status. Consistent with the studies that compare job satisfaction levels of self-employed and wage earners (Blanchflower and Oswald, 1998; Blanchflower, 2000; Benz and Frey, 2008a; Millán et al., 2013), our results show that self-employed individuals (both employers and self-self-employed with no employees), have, on average, better jobs than waged workers. The dimensional analysis shows, confirming the results obtained by Simões et al. (2015), that this advantage results from a much higher level of autonomy (the employment status is the variable that most strongly influences this dimensional index) and greater satisfaction with job content (intrinsic rewards). This result points to the existence of the gain in terms of job quality derived from how the work is developed, as suggested by the concept
of procedural utility. Job security and learning are other important dimensions to explain the positive gap between self-employed and wage earners. This last conclusion is in opposition to the evidence obtained in the study of Millán et al. (2013), which finds that self-employed individuals are less likely to be satisfied in that what concerns job security.
On the other hand, it is important to note the existence of differences in the average level of job quality between employees depending on their type of contract. As expected, in this group those with more permanent contracts have access to better jobs (mainly because of the more favourable situation in terms of pay, autonomy, job security and promotion prospects).
4.3. Results – company characteristics
The second group of variables included in the model concerns company characteristics (ownership sector, firm’s size and economic sector). All these variables are statistically significant in the model that assesses the overall level of job quality. The most pronounced effect is caused by the economic sector.
With regard to the ownership sector to which the firm belongs, the results presented in Table 4 show, in line with the empirical findings of Demoussis and Giannakopoulos (2007) and Ghinetti (2007), that the best jobs are in the public sector (PROP2). The advantage of this sector is expressed in terms of both objective and subjective dimensions. Concerning the objective dimensions, the evidence suggests that in the public sector, work is less intense, more stable, and presents more chances for learning. The superiority of the public sector jobs is also clear at the level of all subjective dimensions (work-life balance, interpersonal relations, and intrinsic rewards). It is interesting to see that the private sector shows a higher level of job quality only in terms of physical working conditions.
Regarding the size of the firm, Díaz-Chao et al. (2016) verify, considering evidence from Spain that workers in small and medium firms have better jobs. In the present study with data for 31 European countries we reach a conclusion with different contours. In fact, our results suggest that medium-size firms (SIZE2) have the worse jobs. However, this effect is quantitatively reduced, pointing to a small difference in the levels of job quality as a function of firm size. Nevertheless, the dimensional analysis allows us to confirm that, despite this small difference in the overall index, there are significant differences at the level of individual dimensions. An important conclusion emerging from this analysis is that, with the exception of autonomy, job security, learning, and intrinsic rewards, job quality
dimensions depend uniformly on the firm size. Thus, we may conclude that, considering smaller firms, there is a decrease in wages, a slight improvement in physical working conditions, a decrease in the intensity of work, greater autonomy for workers, better work-life balance and intrinsic rewards, and a deterioration of interpersonal relations.
As emphasized above, the economic sector is a key determinant of job quality with important differences emerging not only in what regards wage differentials (Gannon et al., 2007) but also other working conditions (Simões et al., 2015). In this context, the evidence in Table 4 allows some important conclusions. First, the influence of the sector occurs mainly through the objective dimensions. Second, service sectors exhibit a clear advantage in terms of job quality, with the exception of the Hotels and Restaurants sector (NACE6). The Agriculture and Fishing sector (NACE1) is the one that penalizes most the quality of jobs, while the highest levels of job quality are found in the Financial Intermediation and the Electricity, Gas, and Water Supply sectors (NACE8 and NACE3, respectively). Third, an analysis of the impact of the sectors on the dimensional indices suggests a partial confirmation of the dual labour market theory. According to this perspective, there is a division of the labour market into two segments: the segment of good jobs (which are taken as a combination of good characteristics) and the segment of bad jobs (combination of bad characteristics). Striving for a more detailed evaluation of this determinant factor, we summarize in Table 5, the effects caused by the sectors on the dimensions of job quality.
Table 5
Effects of economic sectors on the dimensional indices
Ranking Sectors D1 D2 D3 D4 D5 D6 D7 D8 D9 D10 D11 1 NACE1 – – + + + – – – – – NS 2 NACE6 NS + NS + NS NS – – – NS NS 3 NACE7 + + + – NS NS NS – – NS NS 4 NACE4 + – – + NS – + + NS NS + 5 NACE5 – + + + NS + NS NS – NS – 6 NACE11 – + + + + NS NS + NS NS + 7 NACE10 + + + + + + + + NS NS NS 8 NACE9 + + + + NS + + + NS NS NS 9 NACE3 + + NS + NS NS + + + + + 10 NACE8 + + + + + + + + + NS NS
Notes: (+) represents a positive coefficient; (–) is a negative coefficient; (NS) corresponds to a non significant effect.
In Table 5 the sectors are presented in a hierarchical way in terms of the coefficients estimated in Table 4 regarding the effect of the economic sector on the overall index of job quality. An analysis of Table 5 shows that, in the four sectors in which jobs are best (NACE8, NACE3, NACE9, NACE10), they clearly appear to be bundles of good characteristics suggested by the dual labour market theory (Cain, 1976). Nevertheless, the same is not true in the case of sectors with low and intermediate levels of job quality.
CONCLUSIONS
Considering an index that captures the main objective and subjective dimensions of job quality discussed in the literature, this study used data from the EWCS to identify the key determinants of job quality in Europe.
The evidence obtained allows us to conclude that: (i) education, employment status, and economic sector are the most critical variables to explain job quality; (ii) women have lower quality jobs than men, with the difference attributable to the effect on core objective dimensions, namely pay, autonomy, and promotion prospects; (iii) older workers have, on average, better jobs than younger workers; (iv) being a migrant implies holding lower quality jobs, with a negative effect in nine out of the eleven dimensions considered (greatest in the case of autonomy and job security); (v) higher levels of education have a strong and positive effect on all objective dimensions of job quality; (vi) the self-employed have better jobs than wage earners, with autonomy, intrinsic rewards, and job security being critical to explain this difference; (vii) workers with indefinite contracts have access to better jobs, with a favourable situation concerning pay, autonomy, job security, and promotion prospects; (viii) job quality increases if the firm belongs to the public sector, due to both objective and subjective dimensions; (ix) workers in medium-size firms have worse jobs, despite the fact that the impact is quantitatively reduced; (x) firm size has important dimensional impacts – small firms showing an advantage regarding physical working conditions, intensity, autonomy, work-life balance, and intrinsic rewards and a disadvantage in terms of pay and interpersonal relations; (xi) the economic sector is an important determinant of job quality, mainly due to objective dimensions; (xii) better jobs are found in the sectors of Electricity, Gas, and Water Supply (NACE3) and Financial Intermediation (NACE8).
In a broader sense, the analysis conducted in this study highlights the importance of an integrated assessment of the determinants of job quality, involving simultaneously the evaluation of the impact of these factors on the
overall level of job quality and on each of its components. Other options could lead to misleading or only partial interpretations of a phenomenon which, by definition, is complex and multidimensional. On the one hand, the analysis of the job quality determinants in aggregate terms impedes the knowledge of the channels through which such an overall effect occurs. On the other hand, an evaluation focused exclusively on some critical dimensions precludes a broader interpretation regarding both the effects on other dimensions and on the overall index of job quality. We therefore argue that a more detailed analysis requires that the two types of assessment are pursued in a simultaneous and integrated way.
REFERENCES
Altonji, J., Blank, R., Race and Gender in the Labor Market [in:] Ashenfelter, O., Card, D. (eds.)
Handbook of Labor Economics, Vol. 3C, pp. 3143–3259. North-Holland, Amsterdam,
1999.
Amossé, T., Kalugina, E., Work Quality Indicators and Job Dynamics: Is There a Trade-off?
A Micro-econometric Analysis on 10 European Countries. XXVIII Journées de
Microéconomie Appliquée Working paper, 2010.
Arrow, K., The Theory of Discrimination [in:] Ashenfelter, O., Rees, A. (eds.),
Discrimination in Labor Markets, pp. 3–33. Princeton University Press, Princeton, 1973.
Arrow, K., The Benefits of Education and the Formation of Preferences [in:] Behrman, J., Stacy, N. (eds.), The Social Benefits of Education, pp. 11–16. University of Michigan Press, Ann Arbor, 1997.
Bauer, T., Zimmermann, K., Occupational Mobility of Ethnic Migrants. IZA Discussion Paper No. 58, 1999.
Becker, G., The Economics of Discrimination. University of Chicago Press, Chicago, 1957. Becker, G., Investment in Human Capital: A Theoretical Analysis, “Journal of Political
Economy”, 70, pp. 9–49, 1962.
Becker, G., Human Capital: A Theoretical and Empirical Analysis with Special Reference to
Education. University of Chicago Press, Chicago, 1964.
Becker, G., Human Capital, Effort, and the Sexual Division of Labor, “Journal of Labor Economics”, 3, pp. 33–58, 1985.
Bender, A., The Central Government-private Sector Wage Differential, “Journal of Economic Surveys”, 12, pp. 177–220, 1998.
Benz, M., The Relevance of Procedural Utility for Economics [in:] Frey, B., Stutzer, A. (eds.),
Economics and Psychology: A Promising New Cross-disciplinary Field, pp. 199–228.
MIT Press, Cambridge, 2008.
Benz, M., Frey, B., Being Independent is a Great Thing: Subjective Evaluations of
Self-employment and Hierarchy, “Economica”, 75, pp. 362–383, 2008a.
Benz, M., Frey, B., The Value of Doing What You Like: Evidence from the Self-employed in
Blanchflower, D., Self-employment in OECD countries, “Labour Economics”, 7, pp. 471–505, 2000.
Blanchflower, D., Oswald, A., What Makes an Entrepreneur? “Journal of Labor Economics”, 16, pp. 26–60, 1998.
Blau, F., Kahn, L., The U.S. Gender Pay Gap in the 1990s: Slowing Convergence, “Industrial & Labor Relations Review”, 60, pp. 45–66, 2006.
Brown, A., Charlwood, A., Forde, C., Spencer, D., Job Quality and the Economics of New
Labour: A Critical Appraisal Using Subjective Survey Data, “Cambridge Journal of
Economics”, 31, pp. 941–971, 2007.
Brown, C., Medoff, J., The Employer-size Wage Effect, “Journal of Political Economy”, 97, pp. 1027–1059, 1989.
Brown, S., Sessions, J., Earnings, Education, and Fixed-term Contracts, “Scottish Journal of Political Economy”, 50, pp. 492–506, 2003.
Budig, M., England, P., The Wage Penalty for Motherhood, “American Sociological Review”, 66, pp. 204–225, 2001.
Burdett, K., A Theory of Employee Job Search and Quit Rates, “American Economic Review”, 68, pp. 212–220, 1978.
Bustillo, R., Férnandez-Macías, E., Antón, J., Esteve, F., Indicators of Job Quality in the
European Union. European Commission: Directorate-General for Internal Policies,
2009.
Cain, G., The Challenge of Segmented Labor Market Theories to Orthodox Theory: A Survey, “Journal of Economic Literature”, 14, pp. 1215–1257, 1976.
Card, D., The Causal Effect of Education on Earnings [in:] Ashenfelter, O., Card, D. (eds.),
Handbook of Labor Economics, Vol. 3A, pp. 1801–1863. North-Holland, Amsterdam,
1999.
Clark, A., What Really Matters in a Job? Hedonic Measurement Using Quit Data, “Labour Economics”, 8, pp. 223–242, 2001.
Clark, A., Your Money or Your Life: Changing Job Quality in OECD Countries, “British Journal of Industrial Relations”, 43, pp. 377–400, 2005.
Cloutier-Villeneuve, L., Job Quality in Quebec and the United Kingdom: Trends by Sex and
Family Status, 1998–2008, “International Labour Review”, 151, pp. 61–84, 2012.
Davis, D., Harrigan, J., Good Jobs, Bad Jobs, and Trade Liberalization, “Journal of International Economics”, 84, pp. 26–36, 2011.
DeLeire, T., Levy, H., Worker Sorting and the Risk of Death on the Job, “Journal of Labor Economics”, 22, pp. 925–954, 2004.
Delfgaauw, J., The Effect of Job Satisfaction on Job Search: Not Just Whether, But Also
Where, “Labour Economics”, 14, pp. 299–317, 2007.
Demoussis, M., Giannakopoulos, N., Exploring Job Satisfaction in Private and Public
Employment: Empirical evidence from Greece, “Labour”, 21, pp. 333–359, 2007.
Díaz-Chao, Á., Ficapal-Cusí, P., Torrent-Sellens, J. (2016). Did Small and Medium
Enterprises Maintain Better Jobs During the Early Years of the Recession? Job Quality Multidimensional Evidence from Spain, “European Management Journal”, forthcoming.
Diaz-Serrano, L., Vieira, J., Low Pay, Higher Pay and Job Satisfaction within the European
Union: Empirical Evidence from Fourteen Countries, IZA Discussion Paper No. 1558,
2005.
Dohmen, T., Falk, A., Performance Pay and Multidimensional Sorting: Productivity,
Preferences, and Gender, “American Economic Review”, 101, pp. 556–590, 2011.
Edin, P., Zetterberg, J., Inter-industry Wage Differentials: Evidence from Sweden and a
Comparison with the United States, “American Economic Review”, 82, 1341–1349, 1992.
Fabra, M., Camisón, C., Direct and Indirect Effects of Education on Job Satisfaction: A
Structural Equation Model for the Spanish Case, “Economics of Education Review”, 28,
pp. 600–610, 2009.
Farber, H., Alternative and Part-time Employment Arrangements as a Response to Job Loss, “Journal of Labor Economics”, 17, pp. 142–169, 1999.
Frey, B., Benz, M., Stultzer, A., Introducing Procedural Utility: Not Only What, But Also
How Matters, “Journal of Institutional and Theoretical Economics”, 160, pp. 377–401,
2004.
Friedberg, R., You Can't Take It with You? Immigrant Assimilation and the Portability of
Human Capital, “Journal of Labor Economics”, 18, pp. 221–251, 2000.
Gannon, B., Plasman, R., Rycx, F., Tojerow, I., Inter-industry Wage Differentials and the
Gender Wage Gap: Evidence from European Countries, “Economic and Social Review”,
38, pp. 135–155, 2007.
García-Serrano, C., Temporary Employment, Working Conditions and Expected Exits from
Firms, “Labour”, 18, pp. 293–316, 2004.
Genre, V., Momferatou, D., Mourre, G., Wage Diversity in the Euro Area – An Overview of
Labour Cost Differentials across Industries, ECB Occasional Paper No. 24, 2005.
Ghinetti, P., The Public-private Job Satisfaction Differential in Italy, “Labour”, 21, pp. 361– 388, 2007.
Gittleman, M., Wolff, E., International Comparisons of Inter-industry Wage Differentials, “Review of Income and Wealth”, 39, pp. 295–312, 1993.
Goos, M., Manning, A., Salomons, A., Explaining Job Polarization in Europe: The Roles of
Technology, Globalization and Institutions, CEP Discussion Papers No. 1026, 2010.
Green, F., Demanding Work: The Paradox of Job Quality in the Affluent Economy. Princeton University Press, Princeton, 2006.
Green, F., McIntosh, S., The Intensification of Work in Europe, “Labour Economics”, 8, pp. 291–308, 2001.
Gregory, R., Borland, J., Recent Developments in Public Sector Labor Markets [in:] Ashenfelter, O., Card D. (eds.), Handbook of Labor Economics, Vol. 3C, pp. 3573–3630. North-Holland, Amsterdam, 1999.
Hammermesh, D., The Changing Distribution of Job Satisfaction, “Journal of Human Resources”, 36, pp. 1–30, 2001.
Hartikainen, A., Anttila, T., Oinas, T., Nätti, J., Is Finland Different? Quality of Work among
Finnish and European Employees, “Research on Finnish Society”, 3, pp. 29–41, 2010.
Hartog, J., van Opstal, R., Teulings, C., Inter-industry Wage Differentials and Tenure Effects
Hauff, S., Kirchner, S., Cross-national Differences and Trends in Job Quality: A Literature
Review and Research Agenda, Universität Hamburg Discussion Paper No. 13, 2014.
Jovanovic, B., Job Matching and the Theory of Turnover, “Journal of Political Economy”, 87, pp. 972–990, 1979.
Jung, H., Cho, J., Quality of Jobs for Female Workers: A Comparative Study of South Korea
and Australia, “Applied Research in Quality of Life”, 11, pp. 1–22, 2016.
Kalist, D., Does Motherhood Affect Productivity, Relative Performance, and Earnings?, “Journal of Labor Research”, 29, pp. 219–235, 2008.
Kalleberg, A., Vaisey, S., Pathways to a Good Job: Perceived Work Quality among the
Machinists in North America, “British Journal of Industrial Relations”, 43, pp. 431–454,
2005.
Kalleberg, A., Reskin, B., Hudson, K., Bad Jobs in America: Standard and Nonstandard
Employment Relations and Job Quality in the United States, “American Sociological
Review”, 65, pp. 256–278, 2000.
Krueger, A., Summers, L., Efficiency Wages and Inter-industry Wage Structure, “Econometrica”, 56, pp. 259–293, 1998.
Lallemand, T., Plasman, R., Rycx, F. (2007). The Establishment-size Wage Premium:
Evidence from European Countries, “Empirica”, 34, pp. 427–451.
Levanon, A., England, P., Allison, P., Occupational Feminization and Pay: Assessing Causal
Dynamics Using 1950–2000 US Census Data, “Social Forces”, 88, pp. 865–892, 2009.
McGovern, P., Smeaton, D., Hill, S., Bad Jobs in Britain, “Work and Occupations”, 31, pp. 225–249, 2004.
McMahon, W., Conceptual Framework for the Analysis of the Social Benefits of Lifelong
Learning, “Education Economics”, 6, pp. 309–346, 1998.
Millán, J., Hessels, J., Thurik, R., Aguado, R., Determinants of Job Satisfaction: A European
Comparison of Self-employed and Paid Employees, “Small Business Economics”, 40, pp.
651–670, 2013.
Mincer, J., Schooling, Experience and Earnings. Columbia University Press, New York, 1974.
Mühlau, P., Gender Inequality and Job Quality in Europe, “Management Revue”, 22, pp. 114–131, 2011.
Mumford, K., Smith, P., Job Tenure in Britain: Employee Characteristics versus Workplace
Effects, “Economica”, 71, pp. 275–297, 2004.
Munasinghe, L., Reif, T., Henriques, A., Gender Gap in Wage Returns to Job Tenure and
Experience, “Labour Economics”, 15, pp. 1296–1316, 2008.
Niederle, M., Vesterlund, L., Do Women Shy Away from Competition? Do Men Compete Too
Much?, “The Quarterly Journal of Economics”, 122, pp. 1067–1101, 2007.
Oi, W., Idson, T. (1999). Firm size and wages [in:] Ashenfelter, O., Card, D. (eds.),
Handbook of Labor Economics, Vol. 3B, pp. 2165–2214. North-Holland, Amsterdam,
1999.
Phelps, E., The Statistical Theory of Racism and Sexism, “American Economic Review”, 62, pp. 659–661, 1972.
Rebitzer, J., Establishment Size and Job Tenure, “Industrial Relations”, 25, pp. 292–302, 1986.
Rosset, R., Nelson, F., Estimation of the Two-limit Probit Regression Model, “Econometrica”, 43, pp. 141–146, 1975.
Rubery, J., Grimshaw, D., ICTs and Employment: The Problem of Job Quality, “International Labour Review”, 140, pp. 165–192, 2001.
Simões, N., Crespo, N., Pinto, J. C., Determinants of Job Quality—Evidence for European
Country Groups, “Acta Oeconomica”, 65, pp. 299–323, 2015.
Smith, M., Burchell, B., Fagan, C., O’Brien, C., Job Quality in Europe, “Industrial Relations Journal”, 39, pp. 586–603, 2008.
Stier, H., Yaish, M., Occupational Segregation and Gender Inequality in Job Quality:
A Multi-level Approach, “Work, Employment & Society”, 28, pp. 225–246, 2014.
Sutherland, J., Job Attribute Preferences: Who Prefers What?, “Employee Relations”, 34, pp. 193–221, 2012.
Sutherland, J., Job Quality in Scotland, “Scottish Affairs”, 25, pp. 337–371, 2016.
Tangian, A., A Composite Indicator of Working Conditions in the EU-15 for Policy
Monitoring and Analytical Purposes, WSI Discussion Paper No. 135, 2005.
Vila, L., The Non-monetary Benefits of Education, “European Journal of Education”, 35, pp. 21–32, 2000.
Winter-Ebmer, R., Firm Size, Earnings, and Displacement Risk, “Economic Inquiry”, 39, pp. 474–486, 2001.
Received: September 2012, revised: November 2016
Acknowledgements: We acknowledge the financial support from FCT PEst-OE/