DETERMINANTS OF EARNINGS MANAGEMENT
IN THE HOTEL INDUSTRY: AN INTERNATIONAL
PERSPECTIVE
Inna Sousa Paiva*, Isabel Costa Lourenço*
*Lisbon University Institute (ISCTE-IUL), Portugal
Abstract
This paper analyzes the determinants of the level of earnings management in a wide sample of listed firms from the hotel industry in 15 countries. The empirical study relies on the discretionary accruals, as an indication of earnings management, and examines the firm and country characteristics that are potentially associated with those discretionary accruals. The results suggest that firm characteristics, including the leverage ratio, cash flow from operations, investment opportunities and the frequency of losses, are the major determinant of earnings management in the hotel industry around the world. Our results also show that firms with five star hotels have different incentives to manipulate earnings, when compared to firms holding lower quality hotels. The hotels’ star rating also seems to play a different role in explaining the level of earnings management in common-law countries, when compared to code-law countries. This paper contributes to the accounting literature by examining the determinants of earnings management of a large panel of firms from the hotel industry and by focusing on the characteristics of the firm and its institutional environment.
Keywords: Earnings Management, Firm Characteristics, Country Characteristics, Hotel Industry, Hotel Star Rating
Acknowledgments
We would like to thank the valuable comments on previous versions of this paper that were made by participants at the European Accounting Association Annual Conference, Maastricht 2016, and at the Tourism & Management Studies International Conference, Algarve 2014
1. INTRODUCTION
Earnings management has attracted much attention from policymakers and regulators in the last years following several so known financial scandals. A substantial body of research in accounting is dedicated to understanding the causes and consequences of earnings management (Dechow, Hutton, Kim, & Sloan, 2012). Questions as why managers manipulate earnings, how they do so and for what purpose, have been widely studied in the empirical literature (Bharath, Sunder, & Sunder, 2008; Burgstahler, Hail, & Leuz, 2006; Francis, LaFond, Olsson, & Schipper, 2004; Healy & Wahlen, 1999; Leuz, Nanda, & Wysocki, 2003).
Although earnings management is a major research topic in the accounting field, this stream of research has directed only limited attention to accounting behaviour in the hotel industry (Jang & Park, 2011; Park & Jang, 2014). Prior research has focused mainly on the hotels’ efficiency (Oliveira, Pedro, & Marques, 2013) and on their financial performance (Chen et al., 2012; Xiao et al., 2012; Ray & Phillips, 2005).
Over the last decades, tourism has been growing and became a key industry in the world economy. The international tourism revenue has increased from about 2 billion dollars in 1950 to 1.197 billion dollars in 2013 (UNWTO Word Tourism Barometer, 2015). Nowadays, this industry
represents more than one third of the world exports of services and it is an important driver of economic growth and prosperity.
The hotel industry shows higher sales volatility, higher incidence of losses and lower earnings quality (Parte-Esteban & Garcia, 2014). However, not much is known about the incentives to management earnings in this industry (Park & Jang, 2014). We aim to fill this gap in the literature, by analysing the firm and country characteristics that play an important role in explaining the level of earnings management in the hotel industry.
The empirical analysis relies on a sample of listed firms from the tourism industry in 15 countries. We focus on the level of discretionary accruals, namely the modified Jones model suggested by Kothari, Leone and Wasley (2005), as a dimension of earnings management that is particularly responsive to firms’ financial reporting incentives.
The empirical findings show that firm characteristics are the major determinant of earnings management in the tourism industry. More specifically, our results demonstrate that firms with more investment opportunities, with more financial leverage, with greater cash flow from operations and with more incidences of losses are associated to a higher level of earnings management. These results add to the previous literature indicating that firm characteristics are important incentives in
explaining earnings management variations across firms from different countries (Parte-Esteban & Garcia, 2014; Chen, Tang, Jiang, & Li, 2010; Gaio, 2010; Sánches-Ballesta & García-Meca, 2007).
Regarding the country level variables, we found that firms located in more developed countries and in common-law countries are associated with a lower level of earnings management, which is consistent with previous research on the determinants of earnings management worldwide (e.g. Ball, Robin, & Wu, 2003; Leuz et al., 2003; Gaio, 2010).
Our results also show that incentives to manage earnings by firms with five star hotels are quite different, when compared to firms holding lower quality hotels. The hotels’ star rating also seems to play a different role in explaining the level of earnings management in common-law countries, when compared to code-law countries.
This study adds to the knowledge about the hotel industry by examining the firm-level and country-level characteristics that determine the level of earnings management. It has the novelty of investigating the incentives for managing earnings in top hotels worldwide, particularly the influence of star rating. This paper helps the understanding of earnings management choices in hotels around the world.
The remainder of this paper is organised as follows. Section 2 reviews the literature on the determinants of earnings management and develops the hypotheses. Section 3 describes the research design. Section 4 analyses the results and section 5 presents the concluding remarks.
2. PRIOR LITERATURE AND HYPOTHESES
Based on previous literature, we present a set of hypotheses about the relationship between firm and country characteristics and the level of earnings management.
2.1.
Firm-level
determinants
of
earnings
management
Type of hotels (based on the star rating). The
star rating of hotels aims to harmonize international standards in order to differentiate and improve hotel facilities and services. Having a greater number of stars suggests more luxury, and better services, food and beverages, entertainment, panoramic views and a variety of rooms of different sizes. Additional requirements, such as spa centres and fitness facilities, as well as location, are also commonly considered in the definition of a good standard. Holding five star hotels is associated with foreign assets and investors who bring better management techniques and attracted more attention from customers and analysts. Empirical studies suggest that greater number of stars is associated to greater efficiency and greater profitability. Ray and Phillips (2005) show that a greater number of stars is associated with better financial performance in hotels. Assaf and Agbola (2011) suggest a positive relationship between the number of stars and efficiency of hotels. Given that a greater number of stars attract more attention from a wide range of stakeholders, we expect that greater number of stars is associated to a lower level of earnings management.
We, thus, hypothesize that there is a negative association between firms having five star hotels and the level of earnings management.
Size. Firm size is usually believed to influence
the relationship between firms’ ownership and earnings management (Burgstahler & Dichev, 1997; Verrecchia, 1983; Watts & Zimmerman, 1990). Large firms take into account their concern about reputation and visibility. Verrecchia (1983) supports the idea that managers of larger firms are likely to sense that the cost of supplying non-proprietary information to the public is minimal, when compared with managers of smaller firms. In fact, the cost of generating, assembling and disseminating detailed information is believed to be higher for smaller firms than for larger ones (Singhvi & Desai, 1971), because the latter generally already collects this information for internal purposes. Because large firms attract more attention from financial analysts and the press, it is more difficult for them to conceal their earnings management behaviour (Healy & Wahlen, 1999). Hence, the cost of engaging in earnings management will be higher for large firms.
We, thus, expect to find a negative association between firms’ size and the level of earnings management.
Leverage. The relationship between earnings
management and leverage is often ambiguous (Healy & Palepu, 2001). Based on the agency theory, financial leverage can act as a self-disciplining internal governance mechanism to mitigate the costs of debt among owners, managers and creditors (Jensen & Meckling, 1976). Francis et al. (2004) state that firms more dependent on external financing tend to achieve a higher quality of accounting figures, because they believe this will lead to a lower cost of external financing. However, the firm’s debt is usually regulated through formal written contracts, which, in many cases, set some terms for the firm, i.e. covenants. The linking of these clauses is connected to the financial information, since they are based on financial ratios. Therefore, managers can be encouraged to manage the earnings to avoid the penalties considered in the covenants. Authors like Sweeney (1994), Dichev and Skinner (2002) and Bharath et al. (2008) find that there is a higher level of earnings management when firms have higher levels of debt.
Therefore, we hypothesize that there is a positive association between firms’ leverage and the level of earnings management.
Investment opportunities. The relationship
between investment opportunities and earnings management seems to be not consensual. On the one hand, firms with high growth potentials are generally dependent upon raising equity or debt capital to fund profitable investment projects. A greater need for external financing creates incentives to improve earnings quality so as to benefit from the lower cost of capital (Bhattacharya, Hazem, & Welker, 2003; Francis et al., 2004). On the other hand, some prior studies find that firms with high growth opportunities present more important investment opportunities, which encourages managers to influence the probability of obtaining the future financing needs through the exercise of accounting discretion. In this regard, Sánches-Ballesta and García-Meca (2007) suggest that firms with a high market to book ratio may have higher
discretionary accruals than firms with a low market to book ratio. Skinner and Sloan (2002) find that the market severely penalises growth firms in the case of negative earnings surprises. Therefore, growth firms have relatively strong incentives to meet earnings benchmarks, perhaps to avoid increases in the cost of capital or to maintain access to it.
We, thus, hypothesize that there is a positive association between change in firms’ growth rate and the level of earnings management.
Cash flow from operations. According to
Roychowdhury (2006), managers also use cash flow from operations to manipulate real earnings activities during the year to meet certain earnings targets. García and Steban (2014) in line with Francis, LaFond, Olsson and Schipper (2005), states that greater cash flow from operations is associated with more uncertainty in the operation environment, which means there is a higher probability of manager judgment and error estimation and thus, poorer accruals quality.
We, thus, expect to find a positive association between firms’ cash flow from operations and the level of earnings management.
Frequency of negative earnings. Previous
literature states that negative earnings may induce managers to use more accruals to mitigate the impact of losses, which leads to greater incentives of accounting manipulations. Park and Shin (2004) show that firms facing financial constraints or distress have an incentive to adjust earnings in order to avoid the disclosure of a financial problem leading to a potential loss. Roychowdhury (2006) find evidence that managers manipulate real activities to avoid reporting annual losses. Gaio (2010) also find that more incidence of losses negatively affect accounting quality.
Therefore, we hypothesize that there is a positive association between firms’ frequency of negative earnings and the level of earnings management.
2.2. Country-level
determinants
of
earnings
management
Economic development. Existing literature
indicates that economic development affects financial reporting quality (Ball et al., 2000; Leuz et al., 2003). Ball et al. (2000) find that poorer economic development is too costly to support credible accounting information. Consequently, this could aff ect managerial incentives to produce high-quality financial information, leading to firms located in poorer economically developed countries having stronger incentives for earnings management. According to the Leuz et al. (2003), earnings management is more pervasive in countries where the economic development is poor, because managers and insiders in these countries enjoy private control benefits and hence have stronger incentives to obfuscate firm performance. In the same vein, Gaio (2010) determines that firms in less developed countries have lower earnings quality rankings.
Hence, we expect to find a negative association between economic development and the level of earnings management.
Origin of country. La Porta, Lopes-de-Silanes,
Shleifer and Vishny (1998) classify the countries based on the origin of their commercial laws, which
is historically predetermined. In general, commercial laws derive from common-law tradition, which is English in origin, and civil-law tradition, which draws from Roman law. Laws vary greatly across countries, partly due to differences in legal origin. According La Porta et al. (1998) legal systems have also been influencing the demand for accounting information in countries over the years. Several empirical studies provide empirical evidence that a common-law country’s legal system and consequently higher degree of enforcement in a country is associated with lower earnings management (Ball et al., 2000; Ball, Robin, & Wu, 2003; Leuz et al., 2003).
Therefore, we expect to find a negative association between firms located in common-law countries and the level of earnings management.
3. RESEARCH DESIGN
3.1. The Sample
The empirical study relies on the worldwide set of listed firms from the hotel industry with accounting information available in the Thomson Worlscope Database. Given the focus of the analysis, the quality of accounting information, and in order to guarantee the homogeneity of the data, we considered only those countries where firms are required to apply the International Financial Reporting Standards when preparing such accounting information.
Given the need to use data from many years to apply the earnings management model, we based our analysis on firms with accounting information available at least for seven consecutive years. To ensure that the regression results are not influenced by unusual or extreme observations, we first winsorize the extreme values of all variables (1%); then we remove the observations for which the absolute value of the studentized residual is higher than two. The final sample is an unbalanced panel comprising 568 firm-year observations over the period 2007-2013.
Table 1 presents the sample composition by country. Croatia is the most dominant country (24%), followed by Bulgaria (11%), and Cyprus (10%). The smallest representations are for the Bahrain, Peru, Spain, Turkey and United States. Due to concerns regarding that the empirical findings would be dependent on the effect of countries with a large number of firms, we re-estimate the empirical model eliminating firms from Croatia. The main results are not affected by this sample variation.
Table 1. Sample composition by country
Country N. observations % Australia Bahrain Bulgaria Croatia Cyprus France Greece New Zealand Oman Peru Philippines South Africa Spain Turkey United States 47 14 65 135 54 42 33 21 45 11 28 37 14 12 10 8 2 12 22 9 8 6 4 8 2 6 6 3 2 2 Total 568 100
3.2. Variables
Dependent variable. The dependent variable
used in this study is the level of earnings management, measured by the commonly used magnitude of the absolute value of discretionary
accruals (ABS_DAi,t). We compute this measure by using the modified Jones model, with current-year ROA (Return on Assets), according to Kothari et al. (2005). We started by computing the total accrual (TAi,t) of firm i, in year t, as indicated in the equation:
(1) where, ∆CAi,t is the change of current assets for
firm i between year t-1 and year t; ∆Cash i,t is the change in cash for firm i between year t-1 and year t; ∆CL i,t is the change of current liabilities for firm i between year t-1 and year t; ∆STDEBT i,t is the change in debt in current liabilities for firm i between year t-1 and year t; DEPN i,t is the depreciation and amortization expense for firm i, year t. All the variables are scaled by the average
total assets for firm i, year t-1 (Ai,t-1) to overcome heteroskedasticity.
We regress total accruals (TAi,t) on the change in revenues for firm i between year t-1 and year t (∆REV i,t), the level of gross property, plant and equipment for firm i in year t (PPE i,t ) and return of assets for firm i in year t (ROAi,t ), scaled by lagged total assets (Ai,t-1), as indicated in the equation:
(2) The parameters are generated into
equation (2). The regression residuals (the equation’s prediction error) are the discretionary accruals. Mathematically, abnormal accruals for firm i in year
t, (AAi,t) are calculated as the difference between the actual total accruals (TAi,t) and the estimated normal accruals (NAi,t):
(3)
where, AAi,t is the abnormal accruals in year t; other variables are previously defined.
We use the absolute value of abnormal
accruals, ABS_DA, as the dependent variable to proxy for earnings management in the regression model:
ABS_DA= |AAi,t| (4)
A higher magnitude of absolute discretionary accruals corresponds to a greater level of earnings management, or lower accounting quality, and vice versa. Our measure of earnings management, the modified Jones model with ROA, has some limitations (Dechow, Ge & Sharand, 2010). In order to further validate our results, we also calculated other earnings management variables: the absolute value of discretionary accruals estimated by Jones (1991) model, the absolute value of discretionary accruals estimated by modified Jones model suggested by Dechow, Sloa and Sweeney (1995) and modified Jones model with book-to market (BM) and cash flow from operation (CFO) by Larcker and Richardson (2004). However, the main results of our study remain unchanged.
Independent firm-level variables. A set of
independent firm-level variables is used to test the hypotheses related to the association between firms’ characteristics and the level of earnings management. Based on prior literature, we hypothesize that there is a negative association between the firms’ size and the level of earnings management, and a positive association between the firms’ leverage, investment opportunities, cash flow from operations and frequency of negative earnings and the level of earnings management.
We thus use the following set of firm-level variables: SIZE, LEVERAGE, GROWTH, CFO and NEGNIBE. The variable SIZE is measured by the natural logarithm of the firm’s total assets, and LEVERAGE is the firm’s total debt divided by the
market capitalisation. The variable GROWTH is the annual percentage change in sales. The CFO is the cash flow from operations scaled by total assets and NEGNIBE is the frequency of negative earnings measured as the number of the firm-year observations with negative net income before extraordinary items (NIBE) divided by the total number of the firm-year observations.
We also use an industry specific firm-level variable that distinguishes firms based on the hotels features. Previous empirical literature suggests that hotel classification (based on the star rating) play an important role in explaining the performance and efficiency of hotels (Ray and Phillips, 2005; Assaf and Agbola, 2011). We use a similar binary variable, CLASS, that assumes 1 if the firm hold five-star hotels and 0 otherwise.
Independent country-level variables. A set of
independent country-level variables is used to test the hypotheses related to the association between country characteristics and the level of earnings management. Based on prior literature, we hypothesize that there is a negative association between the level of economic development and the legal origin of countries and the level of earnings management. We thus use the following country-level variables: DEVELOPMENT and ORIGIN. DEVELOPMENT is the natural logarithm of gross domestic product per capita for each country. ORIGIN is a binary variable that assumes 1 if the firm is domiciled in a common-law country and 0 otherwise.
, ( , ,) ( , ,) ,
i t i t i t i t i t i t
TA CA Cash CL STDEBT DEPN
, ,
, , , 1 2 3 4 , , 1 , 1 ,1 ,1 ,1 1 i t i t i t i t i t i t i t i t i t i t i t REV AR TA PPE ROA A A A A A 1 2 3 4 ˆ ˆ, ,ˆ ˆ,
, ,
, , , , 1 2 3 4 , 1 , 1 , 1 , 1 1 ˆ ˆ ˆ ˆ ( i t i t i t i t) i t i t i t i t i t i tREV AR PPE ROA
AA TA A A A A
3.3. Research model
In order to analyse the firm-level and country-level characteristics that play an important role in
explaining the level of earnings management in the hotel industry, we estimate the following model: ABS_DAi,t=β0+β1CLASSi,t+β2SIZEi,t+β3LEVERAGEi,t+β4GROWTHi,t+β5CFOi,t+6NEGNIBEi,t+β7DEVELOPME
NTi,t+ β8ORIGINi,t+ β9YEARi,t+ β10COUNTRYi,t+εi,t (6) where, ABS_DAi,t is the absolute value of
discretionary accruals (MJM with ROA) estimated by Kothari et al. (2005). The independent variables are computed as shown in the previous section. The regression is estimated with year and country fixed effects.
4. EMPIRICAL RESULTS
4.1. Descriptive Analysis
Table 2 presents the descriptive statistics for the variables used in this study.
Table 2. Descriptive statistics
Panel A: Descriptive statistics of alternative dependent variables (ABS_DA)
Mean Std Dev 10% 25% Median 75% 90%
Jones model (JM)
Modified Jones model (MJM) Modified Jones model with BM and CFO (MJM with BM and CFO) Modified Jones model with ROA (MJM with ROA) 0.036 0.037 0.036 0.037 0.036 0.036 0.035 0.034 0.004 0.005 0.005 0.005 0.011 0.011 0.012 0.012 0.026 0.026 0.026 0.027 0.049 0.049 0.047 0.050 0.086 0.87 0.081 0.082
Panel B: Descriptive statistics of independent variables
Mean Std Dev 10% 25% Median 75% 90%
CLASS SIZE LEVERAGE GROWTH CFO NEGNIBE DEVELOP ORIGIN 0.680 11.872 54.177 0.345 0.054 0.380 3.181 0.300 0.467 1.697 85.936 4.690 0.073 0.345 0.502 0.458 - 10.000 0.000 -0.255 -0.012 0.000 2.526 - - 10.792 3.978 -0.055 0.011 0.000 2.943 - - 11.660 26.220 0.039 0.037 0.330 3.039 - - 12.743 69.135 0.154 0.087 0.670 3.608 - - 14.398 124.333 0.518 0.151 0.830 3.780 - Jones model (JM) is the absolute value of discretionary accruals estimated by Jones (1991); Modified Jones model (MJM) is the absolute value of discretionary accruals estimated by Dechow et al. (1995); Modified Jones model with BM and CFO (MJM with BM and CFO) is the absolute value of discretionary accruals estimated by Larcker and Richardson (2004); Modified Jones model with ROA (MJM with ROA) is the absolute value of discretionary accruals estimated by Kothary et al. (2005). CLASS is a binary variable that assumes 1 if the firm hold five-star hotels and 0 otherwise. SIZE is the natural logarithm of total assets in dollars. LEVERAGE is the firm total debt divided by its total market capitalisation. GROWTH is the annual percentage change in sales. CFO is the cash flow from operations scaled by total assets. NEGNIBE is the frequency of negative earnings measured as the number of firm-year observations with negative NIBE divided by the total number of firm-year observations. DEVELOPMENT is the natural logarithm of gross domestic product per capita. ORIGIN is a binary that assumes 1 if the firm is domiciled in a common-law country and 0 otherwise. The number of observations is 568.
Panel A reports the descriptive statistics for the alternative dependent variables used in the empirical analysis. The mean (median) value of the main dependent variable, ABS_DA (Modified Jones Model with ROA), is 0.037 (0.027), which is consistent with prior literature on earnings management (e.g. Esteban and Devesa, 2011).
Panel B reports the descriptive statistics for the firm-level and country-level variables. Regarding the firm-level variables, we found that SIZE has a mean (median) value of 11.87 (11.66), LEVERAGE has a mean (median) value of 54.18 (26.22), GROWTH has
a mean (median) value of 0.345 (0.039), CFO has a mean (median) value of 0.054 (0.037) and NEGNIBE has a mean (median) value of 0.38 (0.33). Sánches-Ballesta and García-Meca (2007) and Gaio (2010) report similar results for most of these variables. We also found that 68% of the firms included in our sample hold five star hotels. Regarding the country-level independent variables, we found that DEVELOP has a mean (median) value of 3.181 (3.039) and 30% of the firms are domiciled in a common-law country. Table 3 shows the Pearson correlations among all the variables included in our study.
Table 3. Pearson Correlations
ABS_DA CLASS SIZE LEVERAGE GROWTH CFO NEGNIBE DEVELOP ORIGIN VIF
ABS_DA CLASS SIZE LEVERAGE GROWTH CFO NEGNIBE DEVELOP ORIGIN 1.000 0.034 -0.069 0.064 0.099 0.090 0.060 -0.104 -0.120 1.000 0.090 0.132 -0.028 -0.041 0.080 0.214 0.117 1.000 0.139 0.017 -0.011 -0.116 0.246 0.142 1.000 0.063 -0.029 0.021 0.038 0.160 1.000 0.104 -0.049 0.097 0.062 1.000 -0.596 0.100 0.121 1.000 -0.165 -0.146 1.000 0.243 1.000 1.094 1.114 1.079 1.029 1.587 1,632 1,208 1,121
ABS_DA is the absolute value of discretionary accruals estimated by Kothary et al. (2005). CLASS is a binary variable that assumes 1 if the firm hold five-star hotels and 0 otherwise. SIZE is the natural logarithm of total assets in dollars. LEVERAGE is the firm total debt divided by its total market capitalisation. GROWTH is the annual percentage change in sales. CFO is the cash flow from operations scaled by total assets. NEGNIBE is the frequency of negative earnings measured as the number of firm-year observations with negative NIBE divided by the total number of firm-year observations. DEVELOPMENT is the natural logarithm of gross domestic product per capita. ORIGIN is a binary that assumes 1 if the firm is domiciled in a common-law country and 0 otherwise. The number of observations is 568. Boldface denotes significance at the 1% and 5% level.
These results show that the dependent variable, absolute value of discretionary accruals (ABS_DA), is negatively correlated with the variables DEVELOP and ORIGIN, which is consistent with prior research on earnings management (e.g. Gaio, 2010; Ball et al. 2000). It seems that firms from more developed countries and firms from common-law origin countries are less likely to exercise accounting discretion in order to manipulate earnings.
We also found that ABS_DA is positively related to GROWTH and CFO, which means that firms with greater cash flow from operations and firms with more investment opportunities are more likely to stimulate managers’ opportunities to manipulate earnings. These findings are also consistent with prior literature on earnings management (e.g. Sánches-Ballesta & García-Meca, 2007; Ali, Chen & Radhakrishman, 2007).
Regarding the variable CLASS, we found that firms holding five star hotels are larger, more leveraged and they predominate in more developed countries and in common-law countries.
The results presented in Table 3 show there are no pairwise correlation coefficients in excess of 0.80, indicating that the threat of multicollinearity is limited. The highest coefficient represents the value
– 0.596 between NEGNIBE and CFO. However, we also conduct a formal test to ensure that multicollinearity is not present in our sample. In particular, we calculate the Variance Inflation Factor (VIF) for each independent continuous variable included in the estimated model. Kennedy (1992) suggests that a VIF greater than ten is indicative of problematic multicollinearity. The highest VIF value presented in Table 3 is 1.632, which is well below 10. Overall, the correlation values are low, which suggests that our independent variables capture different aspects of business and countries environment characteristics.
4.2. Regression Analysis
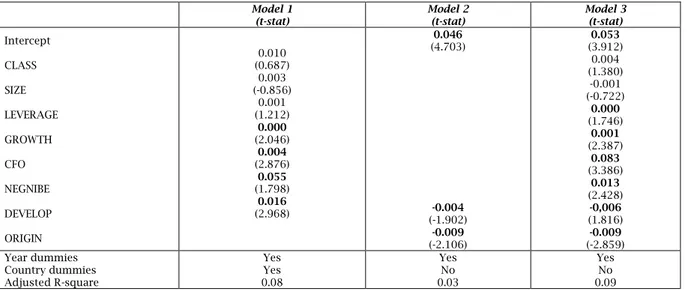
Table 4 presents the results of the regression analysis. The dependent variable in all the models is the absolute value of discretionary accruals (ABS_DA) estimated by Kothari et al. (2005). The independent variables are estimated in three models. Model 1 includes only the firm-level variables, model 2 includes only country-level variables and model 3 brings together firm-level and country-level variables.
Table 4. Regression results (all sample)
Model 1
(t-stat) Model 2 (t-stat) Model 3 (t-stat)
Intercept CLASS SIZE LEVERAGE GROWTH CFO NEGNIBE DEVELOP ORIGIN 0.010 (0.687) 0.003 (-0.856) 0.001 (1.212) 0.000 (2.046) 0.004 (2.876) 0.055 (1.798) 0.016 (2.968) 0.046 (4.703) -0.004 (-1.902) -0.009 (-2.106) 0.053 (3.912) 0.004 (1.380) -0.001 (-0.722) 0.000 (1.746) 0.001 (2.387) 0.083 (3.386) 0.013 (2.428) -0,006 (1.816) -0.009 (-2.859) Year dummies Country dummies Adjusted R-square Yes Yes 0.08 Yes No 0.03 Yes No 0.09
CLASS is a binary variable that assumes 1 if the firm hold five-star hotels and 0 otherwise. SIZE is the natural logarithm of total assets in dollars. LEVERAGE is the firm total debt divided by its total market capitalisation. GROWTH is the annual percentage change in sales. CFO is the cash flow from operations scaled by total assets. NEGNIBE is the frequency of negative earnings measured as the number of firm-year observations with negative NIBE divided by the total number of firm-year observations. DEVELOPMENT is the natural logarithm of gross domestic product per capita. ORIGIN is a binary that assumes 1 if the firm is domiciled in a common-law country and 0 otherwise. The number of observations is 568. Boldface denotes significance at the 1%, 5% and 10% level.
The firm-level variables have higher explanatory power of earnings management (adjusted R2 = 8%), when compared to the
country-level variables (adjusted R2 = 3%). It seems that firm
characteristics are the major determinant of earnings management in the hotel industry worldwide. These results are consistent with those of Gaio (2010), who examine the role of firm and country characteristics in explaining earnings quality in a sample of firms from different industries.
Regarding the firm-level variables, our findings demonstrate that the hotels star rating (CLASS) and the firms size (SIZE) are not statistically related to the level of earnings management. The other firm-level variables coefficients are statistically
significant although not always at 1% level. Consistent with our hypotheses, the variables investment opportunities (GROWTH), firms leverage (LEVERAGE), cash flow from operations (CFO) and frequency of negative earnings (NEGNIBE) are positively related to the absolute value of discretionary accruals.
It seems that firms with more investment opportunities and the firms with more financial leverage, greater cash flow from operations and more incidence of losses, are associated with a higher level of earnings management. These findings are consistent with previous studies indicating that greater cash flow from operations seems to create more uncertainty in the operation environment
(Francis et al., 2004). Consequently, there is a stronger probability of manager judgment and error estimation, which increases managers’ opportunities to exercise accounting discretion. Regarding the frequency of negative earnings, our results indicate that managers use more accruals to mitigate the impact of losses, which would affect the earnings management decisions (Park & Shin, 2004).
Regarding the country level variables, we found that firms located in more developed countries (DEVELOP) and firms located in common-law countries (ORIGIN) are associated with a lower level of earnings management. It seems that managers
and insiders in less developed countries and in code-law countries, which usually have a lower level of enforcement, enjoy private control benefit and hence have stronger incentives to obfuscate the firms performance.
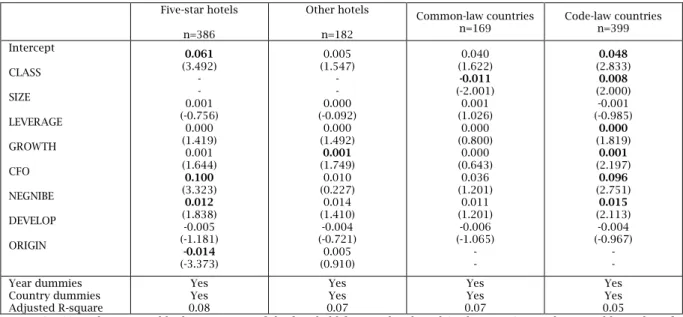
In order to investigate whether different firms from the hotel industry (based on the star rating) have different incentives to engage in earnings management behaviour, we split the sample into two groups: firms holding five-star hotels and firms not holding five star hotels. Table 5 presents the results of this analysis.
Table 5. Regression results (sub-samples)
Five-star hotels n=386 Other hotels n=182 Common-law countries n=169 Code-law countries n=399 Intercept CLASS SIZE LEVERAGE GROWTH CFO NEGNIBE DEVELOP ORIGIN 0.061 (3.492) - - 0.001 (-0.756) 0.000 (1.419) 0.001 (1.644) 0.100 (3.323) 0.012 (1.838) -0.005 (-1.181) -0.014 (-3.373) 0.005 (1.547) - - 0.000 (-0.092) 0.000 (1.492) 0.001 (1.749) 0.010 (0.227) 0.014 (1.410) -0.004 (-0.721) 0.005 (0.910) 0.040 (1.622) -0.011 (-2.001) 0.001 (1.026) 0.000 (0.800) 0.000 (0.643) 0.036 (1.201) 0.011 (1.201) -0.006 (-1.065) - - 0.048 (2.833) 0.008 (2.000) -0.001 (-0.985) 0.000 (1.819) 0.001 (2.197) 0.096 (2.751) 0.015 (2.113) -0.004 (-0.967) - - Year dummies Country dummies Adjusted R-square Yes Yes 0.08 Yes Yes 0.07 Yes Yes 0.07 Yes Yes 0.05 CLASS is a binary variable that assumes 1 if the firm hold five-star hotels and 0 otherwise. SIZE is the natural logarithm of total assets in dollars. LEVERAGE is the firm total debt divided by its total market capitalisation. GROWTH is the annual percentage change in sales. CFO is the cash flow from operations scaled by total assets. NEGNIBE is the frequency of negative earnings measured as the number of firm-year observations with negative NIBE divided by the total number of firm-year observations. DEVELOPMENT is the natural logarithm of gross domestic product per capita. ORIGIN is a binary that assumes 1 if the firm is domiciled in a common-law country and 0 otherwise. Boldface denotes significance at the 1%, 5% and 10% level.
In the group of firms holding five star hotels, cash flow from operation (CFO) and frequency of negative earnings (NEGNIBE) are positively associated to the level of earnings management, while firms from common-low countries (ORIGIN) are less likely to manipulate earnings.
In the group of firms not holding five star hotels, only investment opportunities (GROWTH) are associated to the level of earnings management. It seems that firms providing a lower quality service, mainly in less developed countries and with higher growth potentials, are more likely to need external financing funds, which may create strong incentives for earnings management.
We also investigate whether firms from differences type of countries (common-low versus code-law) have different incentives to manipulate earnings by splitting the sample into two groups: firms from common-law countries and firms from code-law countries. Table 5 also presents the results of this analysis.
In the group of firms from common-law countries, only the type of firm (firms holding versus not holding five star hotels) is significantly associated to the level of earnings management. According to the World Hotel Rating Agency, a greater number of stars suggests more luxury and
better services, entertainment, panoramic views, a variety of rooms of different sizes and facilities. Hence, firms with five star hotels have more visibility and they attract great attention from the market, which could limit earnings management behaviour.
In the group of firms from code-law countries, leverage ratio (LEVERAGE), investment opportunities (GROWTH), cash flow from operation (CFO) and frequency of negative earnings (NEGNIBE) are positively associated with the level of earnings management. However, we also found that firms with five star hotels seem to engage in a higher level of earnings management. A possible explanation for this opposite result, when compared to common-law countries, is that in code-law countries the effect of the lower level of enforcement predominates, when compared to the market attention and pressure for transparency.
5. CONCLUSIONS
This paper examines the firm-level and country-level determinants of earnings management in the hotel industry across 15 countries. We provide empirical evidence that firm characteristics, including the
leverage ratio, cash flow from operations, investment opportunities and the frequency of losses, are the major determinant of earnings management in the hotel industry around the world. Our results also show that firms with five star hotels have different incentives to manipulate earnings, when compared to firms holding lower quality hotels. The hotels’ star rating also seems to play a different role in explaining the level of earnings management in common-law countries, when compared to code-law countries.
Our findings contribute to the accounting literature by examining the determinants of earnings management of a large panel of firms from the hotel industry and by focusing on the characteristics of the firm and its institutional environment and, specially, by providing new evidence on the role of the hotel quality and reputation in understanding of earnings management choices in hotels around the world.
Our findings do not attempt to imply that firm characteristics substitute country characteristics in explaining earnings management. Although firm and country characteristics play different roles, they interact in determining earnings management. In future research, it would be interesting to analyse the economic effect of the differences in firm-level determinants of earnings management in the hotel industry around the world.
REFERENCES
1. Ali, A., Chen, T. & Radhakrishnan, S. (2007). Corporate disclosure by family firms. Journal of Accounting and Economics, 44(1-2), 238-286. 2. Assaf, A., & Agbola, F. (2011). Modelling the
performance of Australian hotels: a DEA double bootstrap approach. Tourism Economics, 17(1), 73-89.
3. Ball, R., Robin, A., & Wu, J. S. (2003). Incentives vs. standard: Properties of accounting income in four East Asian countries and implication for acceptance of IAS. Journal of Accounting and Economics, 36(1), 235-270.
4. Ball, R., Kothari, S. P., & Robin, A. (2000). The effect of international institutional factors on properties of accounting earnings. Journal of Accounting and Economics, 29(1), 1-51.
5. Bharath, S., Sunder, J., & Sunder, S. (2008). Accounting quality and debt contracting. The Accounting Review, 83(1), 1-28.
6. Bhattacharya, U., Hazem, D. & Welker, M. (2003). The world pricing of earnings opacity. The Accounting Review, 78(3), 641-678.
7. Burgstahler, D. C. & Dichev, I. (1997). Earnings management to avoid earnings decreases and losses. Journal of Accounting and Economics, 24(1), 99-126.
8. Burgstahler, D., Hail, L., & Leuz, C. (2006). The importance of reporting incentives: earnings management in European private and public firms. The Accounting Review, 81(5), 983–1016.
9. Chen, H., Tang, Q., Jiang, Y., & Lin, Z. (2010). The role of International Financial Reporting Standards in accounting quality: Evidence from the European Union. Journal of International Financial Management and Accounting, 21(3), 220-278. 10. Chen, M.H., Hou, C.L. & Lee, S. (2012). The impact
of insider managerial ownership on corporate performance of Taiwanese tourist hotels.
International Journal of Hospitality Management, 31(2), 338-349.
11. Dechow, P. M., Ge, W., & Schrand, C. (2010). Understanding earnings quality: A review of proxies, their determinants and their consequences. Journal of Accounting and Economics, 50(2), 344-401.
12. Dechow, P. M., Hutton, A. P., Kim, J. H. & Sloan, R. G. (2012). Detecting earnings management: a new approach. Journal of Accounting Research, 50, 275-334.
13. Dechow, P.M., Sloan, R. G., & Sweeney, A. P. (1995). Detecting earnings management. The Accounting Review, 70(2), 193-225.
14. Dichev, I., & Skinner, D. (2002). Large-sample evidence on the debt covenant hypothesis. Journal of Accounting Research, 40(4), 1091-1123. 15. Francis, J., LaFond, R., Olsson, P. & Schipper, K.
(2004). Cost of equity and earnings attributes. The Accounting Review, 79(4), 967-1010.
16. Francis, J., LaFond, R., Olsson, P. & Schipper, K. (2005). The market pricing of accruals quality, Journal of Accounting and Economics, 39(2), 295-327.
17. Gaio, C. (2010). The relative importance of firm and country characteristics for earnings quality around the world. European Accounting Review, 19(4), 693-738.
18. Healy, P. M. & Palepu, K. G. (2001). Information asymmetry, corporate disclosure and the capital markets: A review of the empirical disclosure literature. Journal of Accounting and Economics, 31(1-3), 405–440.
19. Healy, P.M. & Wahlen, M. (1999). A review of earnings management literature and its implications for standard setting. Accounting Horizons, 13(4), 365-383.
20. Jang, S. & Park, K. (2011). Hospitality finance research during recent two decades: subjects, methodologies, and citations. International Journal of Contemporary Hospitality Management, 23(4), 479-497.
21. Jensen, M. & Meckling, W. (1976). Theory of firm: Managerial behaviour, agency costs and ownership structure. Journal of Financial Economics, 3(4), 305-360.
22. Jones, J. (1991). Earnings management during import relief investigations. Journal of Accounting Research, 29(2), 193–228.
23. Jones, K., Krishnan, G. & Melendrez, K. (2008). Do models of discretionary accruals detect actual cases of fraudulent and restated earnings? An empirical analysis. Contemporary Accounting Research, 25(2), 499-531.
24. Kennedy, P. (1992). A guide to econometrics (3rd edition), Oxford, UK: Basil Blackwell Ltd.
25. Kothari, S., Leone, J. & Wasley, E. (2005). Performance matched discretionary accruals measures. Journal of Accounting and Economics, 39(1), 163-197.
26. La Porta, R., Lopes-de-Silanes, F., Shleifer, A. & Vishny, R. (1998). Law and Finance, Journal of Political Economy, 106(6), 1113-1155.
27. Larcker, D. F. & Richardson, S. A. (2004). Fees paid to audit firms, accruals choices, and corporate governance. Journal of Accounting Research, 42(3), 625-658.
28. Leuz, C., Nanda, D. & Wysocki, P. (2003). Earnings management and investor protection: an international comparison. Journal of Financial Economics, 69(3), 505–527.
29. Leuz, C. & Verrecchia, R. (2000). Economic consequences of increased disclosure. Journal of Accounting Research, 38(SUPP), 91-124.
30. Oliveira, R., Pedro, M. I., & Marques, R. C. (2013). Efficiency and its determinants in Portuguese hotels in the Algarve. Tourism Management, 36, 641-649.
31. Park, K. & Jang, S. (2014). Hospitality and managerial accounting research. Suggesting and interdisciplinary research agenda. International Journal of Contemporary Hospitality Management, 26(5), 751-777.
32. Park, Y. W., & Shin, H. H. (2004). Board Composition and Earnings Management in Canada. Journal of Corporate Finance, 10(3), 431-457. 33. Parte-Esteban , L. & Devesa, M.J. (2011). Earnings
management in the Spanish hotel industry. Cornell Hospitality Quarterly, 52(4), 466-479.
34. Parte-Esteban, L., & Garcia, C.F. (2014). The influence of firm characteristics on earnings quality. International Journal of Hospitality Management, 42, 50-60.
35. Ray, P., & Phillips, P. (2005). Performance comparisons of hotels in China. International Journal of Hospitality Management, 24(1), 57-73. 36. Roychowdhury, S. (2006). Earnings management
through real activities manipulation. Journal of Accounting and Economics, 42(3), 335-370. 37. Sánchez-Ballesta, J. & García-Meca, E. (2007).
Ownership structure, discretionary accruals and the informativeness of earnings. Corporate
Governance: An International Review, 15(4), 677-691.
38. Schipper, K. (1989). Earnings Management. Accounting Horizons, 3(4), 91-102.
39. Singhvi, S. & Desai, H. (1971). An empirical analysis of the quality of corporate financial disclosure. The Accounting Review, 46(1), 129– 138.
40. Skinner, D. & Sloan, R. (2002). Earnings surprises, growth expectations, and stock returns or don’t let an earnings torpedo sink your portfolio. Review of Accounting Studies, 7(2), 289-312.
41. Sweeney, A. (1994). Debt-covenant violations and managers’ accounting responses. Journal of Accounting and Economics, 17(3), 281-308. 42. UNWTO World Tourism Barometer (2015),
Tourism Highlights, January 2015, Volume 13, http://dtxtq4w60xqpw.cloudfront.net/sites/all/fil es/pdf/unwto_barom15_01_january_excerpt.pdf 43. Verrecchia, R.E. (1983). Discretionary disclosure.
Journal of Accounting and Economics, 5(3), 179-194.
44. Xiao, Q., O´Neill, J.W., & Mattila, A.S. (2012). The role of hotels owners: the influence of corporate strategies on hotel performance. International Journal of Contemporary Hospitality Management, 24(1), 122-139.