1
ECSE International Report
Educational Challenges in Southern Europe. Equity
and efficiency in a time of crisis
Coordinator: João Sebastião Researchers: João Sebastião
Luís Capucha Maria Álvares Patrícia Ávila Pedro Abrantes
Susana da Cruz Martins Ana Raquel Matias Sofia Amândio Ana Rita Capucha Pedro Estêvão Alexandre Calado Ana Rita Matias
Research Group II - Knowledge Society, Competencies and Comunication From 01/06/2013 to 30/11/2015 Fundação para a Ciência e a Tecnologia (FCT)
2
Research team
Portuguese team CIES-IUL / ISCTE-IUL
Coordinator João Sebastião
Researchers Sebastião, João
Capucha, Luís
Álvares, Maria Ávila, Patrícia Abrantes, Pedro
Martins, Susana da Cruz
Estêvão, Pedro Calado, Alexandre
Grantholders Matias, Ana Raquel
Amândio, Sofia
Capucha, Ana Rita
Begining/ending date: 15-01-2014 – 31-01-2015 Begining/ending date: 15-01-2015 – 30-11-2015 Begining/ending date: 15-07-2013 – 30-11-2015
Collaborator Matias, Ana Rita Begining/ending date: 15-07-2015 - 30-11-2015
International teams
Spain Universidad Complutense
Consultant Rafael Feito Alonso
Italy Università Cattolica del
Sacro cuore, Milan
Consultant Maddalena Colombo
Researchers Mariagrazia Santagati
Marta Cordini
Greece Panteion University of
Social and Political Sciences
Consultant Vasiliki Kantzara
The project
Research lines Line II - Knowledge society and patterns of competencies
Begining date 01/06/2013
3
Project type Funded research
Funding entities
Fundação para a Ciência e a Tecnologia (FCT)
4
Contents
Introduction ... 9
National Education Agendas and Process of Europeanization... 10
Dynamics convergence of southern Europe in schooling and educational outcomes ... 12
Financial constraints the educational ideology: what changed education in Southern Europe during the Crisis? ... 16
The ECSE report ... 20
Chapter 1 Objectives and Methodology ... 22
Chapter 2. A comparative approach: Southern Europe characterization. Context and Educational Systems. ... 35
2.1. Crisis on Europe's southern countries ... 37
2.2 Qualification and employment ... 43
2.3 Southern Europe’s educational systems ... 58
Chapter 3. The “education quality” policies in Southern Europe and its impacts over teachers’ and students’ lives ... 93
3.1 Students’ competences assessment ... 97
3.2 Teachers evaluation ... 103
3.3 School evaluation ... 106
Chapter 4. Equity and education: public policies and their results in Southern Europe . 111 4.1 Education: participation and access ... 117
4.2 Access Pre-Schooling/ Pre-Primary ... 125
4.3 Adults education ... 127
4.4 School´s diversity - Special Education ... 139
4.5 Success, performances and fragilities in Southern Europe ... 150
4.6 Strategies for promoting success and equity ... 163
4.7 Dynamics on Education expenditure and funding ... 167
Chapter 5- Equity in times of crisis and Political Choices... 181
5.1 Tendencies in Southern Europe: Convergence within a context of Globalization and Europeanization ... 181
5.2 Convergence and Southern European´s countries educational results ... 185
5.3 Political cycles and educational policy-making ... 190
Conclusion ... 208
6
Content of figures and tables Chapter 1 Objectives and Methodology
Table 1. Variables, dimensions and indicators.
Chapter 2. A comparative approach: Southern Europe characterization. Context and Educational Systems. Figures
Figure 2.1.1 Evolution of real growth rates of GDP and unemployment in Greece, Spain, Italy and Portugal (%), between 2003 and 2014
Figure 2.1.2 Evolution of educational attainment (%), by ISCED, 25-64 years, between 2000, 2008 and 2013, in Greece, Spain, Italy, Portugal and EU-27.
Figure 2.1.3 Evolution of the employment and unemployment rate (%), pop. age 25-64 years, between 2000 and 2013, in Greece, Spain, Italy, Portugal and European Union 27
Figure 2.1.4 Trends in the Gini coefficient in the south European countries (2003-2012).
Figure 2.1.5 People at risk of poverty (60% of median equivalised income after social transfers) and income inequality (Gini coefficient), EU-28, 2012
Figure 2.1.6 Youth neither in employment nor in education and training (NEET) rate, age group 15-24 and income inequality (S80/S20), in EU-28, in 2012
Figure 2.1.7 Annual expenditure on public and private educational institutions compared to GDP per capita Figure 2.1.8 Public Expenditure on Education, as % GDP
Figure 2.1.9 Private expenditure on education, as % GDP
Figure 2.1.10 Financial aid to pupils and students as % of total public expenditure on education
Figure 2.1.2a Evolution of educational attainment (%), by ISCED and age (25-64 years), between 2000 and 2013, in Portugal, Spain, Italy and Greece.
Figure 2.1.6a Evolution of the employment and unemployment rate (%), by age groups and ISCED, between 2000 and 2013, in Portugal, Spain, Italy and Greece.
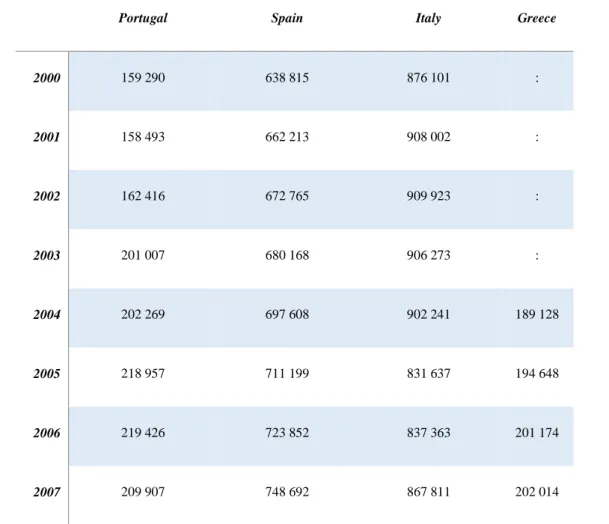
Figure 2.2.1 Number of student’s evolution in Portugal, Spain, Italy and Greece, by level of education, between 2000 and 2012.
Figure 2.2.2 Participation/ enrolment in education of students between primary (ISCED 1) and tertiary education (ISCED 6), as % of corresponding age population (15 to 24 years old).
Figure 2.2.3 Number of teachers and academic staff evolution, by ISCED levels, in Portugal, Spain, Italy and Greece, between 2000 and 2012
Figure 2.2.4 Financial support for special education (in EUR, mainland Portugal (2009-2014)
Figure 2.2.5 Evolution of the number of students with SEN, by cycles and levels of education, Mainland Portugal (2009-2014)
Figure 2.2.5 Percentage of students with disability per level and scholastic year (2001/02-2013/14) Figure 2.2.6 Percentage of adult students in total, in Portugal, Spain, Italy and Greece, 2000-2012
Figure 2.2.1a Participation/ enrolment in education of students between primary (ISCED 1) and tertiary education (ISCED 6), as % of corresponding age population, by age group.
Figure 2.2.2.b Participation/ enrolment in education of students between primary (ISCED 1) and tertiary education (ISCED 6), as % of corresponding age population, by sex.
Figure 2.2.2b. Participation/ enrolment in education of students in primary education (ISCED 1), as % of corresponding age population.
Figure 2.2.2c. Participation/ enrolment in education of students in primary education (ISCED 1), as % of corresponding age population.
Figure 2.2.2d. Participation/ enrolment in education of students in upper secondary (ISCED 3), as % of corresponding age population.
Figure 2.2.2e Participation/ enrolment in education of students in post-secondary education (ISCED 4), as % of corresponding age population.
7
Figure 2.2.2f Participation/ enrolment in education of students in tertiary education (ISCED 5&6), as % of corresponding age population.
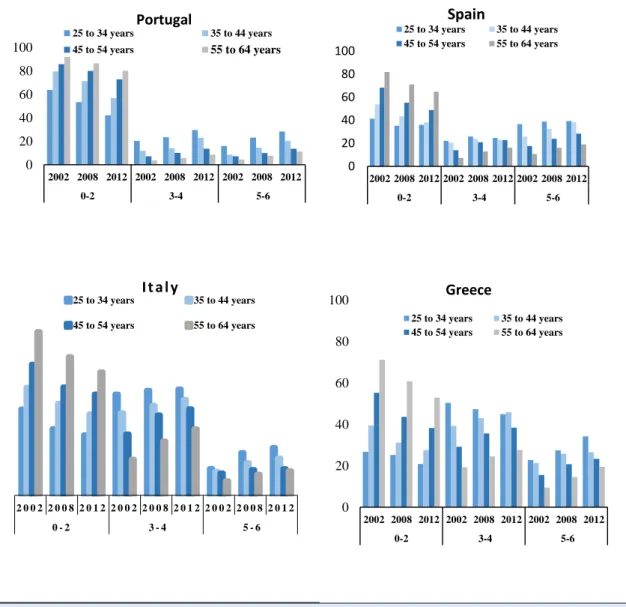
Figure 2.2.6a. Evolution between 2000 and 2012, of the number of adults studding in Portugal, according to age groups.
Figure 2.2.6b. Evolution between 2000 and 2012, of the number of adults studding in Spain, according to age groups.
Figure 2.2.6c. Evolution between 2000 and 2012, of the number of adults studding in Italy, according to age groups.
Figure 2.2.2d. Evolution between 2000 and 2012, of the number of adults studding in post-secondary in Portugal, Italy and Greece, according to age groups.
Figure 2.2.2e Evolution between 2000 and 2012, of the number of adults studding in tertiary education (ISCED 5&6) in Portugal, Spain, Italy and Greece, according to age groups.
Tables
Table 2.1.1 risk of poverty rate, according to age group, in the southern countries of Europe, 2004-2013 Table 2.2.1 Number of teachers and academic staff evolution in Portugal, Spain, Italy and Greece
Table 2.2.2 Number of Resource Centres for Inclusion, supported organizational units and number of students with SEN covered
Table 2.2.3 Number of Resource Centres for Inclusion (CRI - Centro de Recursos para a Inclusão), supported organizational units (UO – Unidades orgânicas apoiadas) and number of students with SEN covered, by NUTS 2 regions. 2013/2014
Table 2.2.4 Applicants and holders (No.) of financial support (subsídio) for special education, by NUTS 2 regions, between 2009 and 2014
Table 2.2.5 Percentage of students with Special Educational Needs in Spain, in 2012-2013 Table 2.2.6 Students with disabilities per regional area and kind of dependency (2013/14), in Italy
Chapter 4 Equity and education: public policies and their results in Southern Europe Figures
Figure 4.1 Evolution of educational attainment (%), in EU27, Greece, Spain, Italy and Portugal, between 2000-2013.
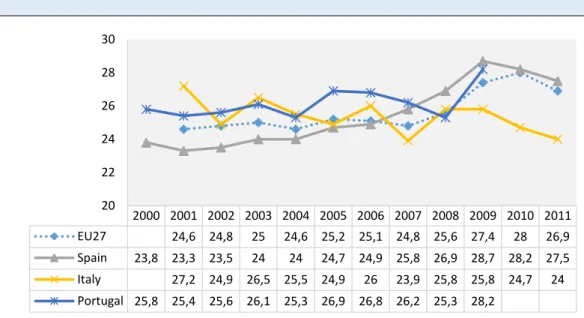
Figure 4.2 Participation/enrolment in education, of population between 15-24 years old, in EU-27, Greece, Spain, Italy and Portugal (2000-2012)
Figure 4.2.1 Participation/enrolment in education, of population between 15-24 years old, by sex, in EU-27, Greece, Spain, Italy and Portugal (2000-2012)
Figure 4.3 Participation/ Enrolment in education on Upper Secondary - General Courses and Vocational path, as % of all students at ISCED level 3
Figure 4.4 Number of student (total), between 15 and >40 years old, that enrolled in tertiary system (ISCED 5 and 6) (2000-2011)
Figure 4.5 Pre-school enrolment, between 2000 - 2012
Figure 4.6 Number of students in Lower Secondary with more than 20 years old, in Greece, Spain, Italy and Portugal, between 2002 and 2012.
Figure 4.7 Number of students in Upper Secondary, in Greece, Spain, Italy and Portugal, between 2002 and 2012. Figure 4.8 Participation rate in education and training (last 4 weeks), for population with 25-64 years old (2000-2013).
Figure 4.9 Participation rate of adults in education and training (25-64 years), 2000-2013.
Figure 4.10 Data from NESSE (2012) regarding pupils identified as having SEN as a percentage of the total school population in selected European countries.
8
Figure 4.12 Upper secondary and post-secondary non-tertiary education attainment level (%), in Greece, Spain, Italy and Portugal, between 2002 and 2012.
Figure 4.13 Percentage of population aged 25-64 below secondary attainment
Figure 4.14 Tertiary education attainment level (%), in Greece, Spain, Italy and Portugal, between 2002 and 2012. Figure 4.15. Early school leaving (ESL), in EU27, Greece, Spain, Italy and Portugal, between 2000 and 2013. Figure 4.16 Reading, mathematics and science literacy, in OCDE (average), Greece, Italy, Portugal and Spain, 2000-2012
Figure 4.17 Mathematics literacy (average), according to index of economic, social and cultural status (ESCS) by quartiles
Figure 4.18 Averages for mathematics, age 15 years, by Index immigration status, 2003-2012
Figure 4.19 Public Expenditure on Education, as % GDP, in Greece, Spain, Italy and Portugal, between 2000 and 2010.
Figure 6.20 Financial aid to pupils and students as % of total public expenditure on education, in Greece, Spain, Italy and Portugal, between 2000 and 2011
Figure 6.21 Annual expenditure on public and private educational institutions per pupil/student compared to GDP per capita, based on full-time equivalents
Tables
Table 4.1 Adults Policies and results between 2000-2013
Table 4.2 Numbers certified population at Basic Education (ISCED 1 and 2) and at secondary level (ISCED 3), in Portugal (2004-2013).
Table 4.3 Number of Resource Centres for Inclusion
Table 4.4 Applicants and holders (No.) of financial allowances for special education Table 4.5 Students with SEN (%) in Spain, between 2012-2013
Table 4.6 Relative proportion of public and private expenditure on educational institutions by level of education 2005, 2011, 2012 – primary, secondary and pos- secondary non tertiary
Chapter 5 Equity in times of crisis and Political Choices Figures
Figure 5.1 Population with Tertiary attainment (25-64 years old), Index 100=2000
Figure 5.2 Students within the vocational areas as a percentage of the total of students ISCED 3) Index= 1998 Figure 5.3 Students within the vocational areas as a percentage of the total of students ISCED 3) Index= 1998 Figure 5.4 PISA results in mathematics, for OCDE average, Germany, Greece, Spain, Italy, Portugal, Sweden and United Kingdom, between 2000 and 2012.
Figure 5.5 Participation rate in education and training (last 4 weeks), % total population aged 25-64, Index=2000 Figure 5.6 Southern European Constitucional Governments between 2000 and 2014
Figure 5.7 Southern European Political Cycles –Policies in Education Figure 5.8 Southern European main policies and results
9
Introduction
The financial crisis in 2007 in the US has rapidly evolved into a global systemic crisis with profound impacts in various regions of the world and in various economic and social sectors. For Europe, entangled in a complex process of political, economic and monetary integration, the impact of the financial crisis has highlighted a number of structural weaknesses and latent tensions, especially when it became clear the need for a single, effective response in a context of globalization of markets financial. The absence of such common answer putted in evidence the ambiguities, conflicts, resentments, selfishness and prevailing prejudices between countries and major European political families.
The neoliberal and conservative orientation of most national governments, and therefore the European institutions, meant that they adopt a rigid logic of austerity aimed at the sole purpose of supporting the financial system. We moved from a financial crisis to a broader crisis that did not solve the problem of financial sustainability, while caused, particularly in countries most affected by the crisis, a strong negative impact on social policies and, in general, as usually designated by the European social model.
The aim of this report is showing that the evolution of education indicators in southern European countries were improving and recovering for the last decades. This process was not at all uniform, neither considering the rhythm nor the factors, nor even the policy and institutional choices of each of the four countries (Portugal, Spain, Italy and Greece). The empirical evidence also shows that the EU was – in more than one way – a relevant actor in this matter, uncovering the Europeanization process that helps to explain how European orientations impacted differently the four countries (Radaelli, 2003). But it was effective until the crisis, and the European and national policies to deal with it, put an end (or at least a long break) to the process. The main question to be answered, comparing the four countries’ education systems evolution, is about the trade-off between the financial constraints imposed by the austerity programs and the ideological orientations of national governments affecting the policy reforms. Did the financial crises play an important role in educational policymaking, or was this mainly the result of political choices, eventually justified by the context of the crises?
10
National Education Agendas and Process of Europeanization
Throughout the 1990s, a positive period for European integration, there is an evident strive for the deepening of the Union in economic and also social and political matters, strongly driven by the European Commissioner Jacques Delors. The Lisbon Summit in 2000 was the zenith of this trend.
In the context of a global knowledge economy and information society, one relevant dimension of the political agenda, both at the European and the UE Member States level, was the objective of school expansion and rise of qualifications. On one hand, this was supposed to increase some kind of sense of “European citizenship” that is still missing. On the other hand, it was a priority to address the problem of the skills demand, the growth of high complex jobs demanding increasing capabilities, mainly in those countries where there were persistent traces of social selectivity and poor educational quality - e.g., low level of qualifications’ structure, low levels of adults’ engagement in lifelong learning activities, high rates of early school leaving, bad results in international measuring of youngsters competencies and wide school failure - as it was the case in southern Europe. This group of countries accepted the “qualifications challenge” and the results were, as we will see, encouraging.
By 2005 the impetus for a social Europe and for the convergence of social and educational standards had cooled down. The slowdown of economic growth and the rise of liberal parties across Europe lead to a focus displacement of the social (employment and social inclusion) concerns towards economic and monetary policies. In the mid-term review of the Lisbon strategy the triangular dynamic in which it was based had become bipolar – linking employment to economic growth - and social policies left the core agenda. But southern Europe was still making its path, mainly with Portugal joining the peer countries. The 2007/2008 crises have put an end to the process. At the beginning, European Institutions decided to launch the “automatic stabilizers” and education benefited from this. But since 2010 the debts crisis promoted the budget orientation consensus to “launch automatic hard austerity programs that had particularly hardship consequences in southern Europe and Ireland. This had huge impacts in the trajectories of the southern European countries in education achievements, and reinforced the debate about the relevance of education policies in Europe.
The way in which each southern country reacted to the crisis and decided to affect education with austerity restrictions varied widely. This was expected, given that over the last decades were built different educational systems. We do not find, in fact, in this regard, any support for the defence of the existence of a typical Social State of Southern Europe (Ferrera, 2000), like other authors advocate to analyze other materials, as part of a controversy that extended to model of education
11 systems and their results, such as we find in Andy Green (2013, 2009, 1999). In fact, the similarities are just at the level of the image of a region with less qualified people, which is only true in some cases and less interested in qualify, which has been proving to be also a stereotype with no empirical evidence.
The qualification deficits of the population of the Southern European countries are structural attributes that are associated with historical processes that include late industrialization (albeit with many regional variations), the low levels of productivity and economic competitiveness and specialization based on intensive jobs labor, high levels of social inequality, the belated realization of universal social protection systems and the postponement of construction of educational systems with universal vocation, partly due to the extension to mid 70's conservative dictatorships, based in authoritarian states, but with underdevelopment functions. The full European integration of these countries (except for Italy, a founding member), following rupture processes with dictatorships, constituted an outright declaration of intent on their part in bringing the institutional and political as well as the levels and average standards European life, a fact that led to the reorientation of many of its historical affinities.
This desire to "Europeanization" (Featherstone & Radaelli, 2003) is exemplary when it comes to put into action national governments towards convergence, regardless of the action of the European institutions, which in education did not pass production some program guidelines, small budgets to fund certain segments of the systems (such as vocational education) and the approval of the Bologna Declaration in 1999 and the Lisbon Strategy in 2000 (Featherstone and Kazamias, 2000).
This fact definitely contributes to maintaining a high diversity of arrangements and peculiarities in education systems, as well as significant differences in their performances, since they are strongly conditioned by what has come to be called "path dependency". This diversity and disparity between European education systems is particularly relevant when comparing the educational levels of the northern, central and southern Europe.
Not aiming to discuss all modernization vectors that the Europeanisation and the convergence efforts triggered in southern Europe, we know that the effects initiated by this process led to important stimuli in the field of political orientations, the institutional frameworks and the positioning of the actors face the education systems. Moreno-Fuentes (2013) report that the phenomenon of Europeanization as referral mechanism in peripheral societies undergoing modernization, triggered almost naturally convergence processes and different paths, because some structural source data was in itself distinct. Relevant elements of this process were also made by the action of international agencies that triggered the education promotion programs
12 (UNICEF) or triggered performance benchmarking processes of education systems and their impact on economic competitiveness (such as the OECD and the World Bank) (Valter Lemos, 2014). Other initiatives, such as the development of European statistical systems specifically devoted to education (Eurydice) came also to highlight the need for sustained investment in reducing the educational backwardness and catch up with the European average. This evidence was also based on the theories of human capital in an increasing complexity of the context of the competitiveness of national economies in the global knowledge-based economy (Drucker, 1993). It was therefore within a complex framework that Southern European countries were able to effectively modernize and develop their societies and the main typical political systems of Europe more developed despite having begun the process of convergence under match conditions clearly more unfavourable, since they had completed the "thirty glorious" after the end of war and the exceptional conditions for growth and social justice that Europe experienced in the period) (Capucha). This was being done, at least in the field of education and skills, when the path was abruptly interrupted by the crisis.
Dynamics convergence of southern Europe in schooling and educational outcomes
Analysis of the convergence trend in the results of the Southern European countries in the field of education and qualification, takes two analytical vectors: (1) First, these countries, towards the countries of Central Europe and North America have persistent structural weaknesses in their performances. This can be checked, for example, in the most difficult of completion of compulsory schooling (Martins, Susana), or the most significant part of the workforce that exhibits lower educational qualification levels (as it will come later). (2) Secondly, the entry into the European Community influenced modernization processes of social, economic and educational structures with clear objectives to converge from the average standards of peer to reference objectives for these areas. The claim that there was a convergence of the four southern European countries with regard to the results in education and improving the performance of education systems is supported by the analysis of the four indicators relating to these qualifications in 2020: dropout rate early school; graduates rate in tertiary; rate of adults involved in education and training actions; and rate of students involved in vocational education.
A simple analysis of the labour force qualification structure (25 to 64 years) in four countries of Southern Europe into consideration in this report brings out a common structural deficit, with the predominance of the lowest educational qualifications.
13 In 1993 the equivalent qualifications to primary education were quite significant, especially Portugal for the highest percentage (80%), immediately followed by Spain (74.8%). Greece and Italy, who also had high percentages (60.9 %% and 67.5 %% respectively) both showed more encouraging results with regard to the population the equivalent of secondary education (26.1% and 25.7% respectively). Made exception to Italy a few years had passed since joining the EEC and still showed clearly the consequences of historical backwardness in educational development in these countries in the process of consolidating democracy and building the institutional complex of the education system, translated into priority given to reforms that would promote access and mass participation at the lower levels of the system, at a time when the north and centre of Europe educational priorities had already been reoriented to the massification of higher levels of education.
The efforts made by countries of the South in 2003 allowed important part of starting delay had been recovered and may be identified rapid growth of the percentage of the population with secondary education and a retreat of the population with only primary education. There is, too, that these national efforts have developed at different rates, as can be seen with the less favourable results and pace "slower" of Portugal. Then also begin to shape up trends that are clearly oriented to the average European standard (secondary growth and higher education): the cases of Greece and Italy, with a preponderance of the population with secondary education (37.33% and 36.13% respectively) are those that most closely match the European average (44.7%), while Spain at the level of higher education completion results recorded were above the European average (20.4% of European average, and 25.4% in Spain), joining him to Greece with an increase of more than 10 percentage points this level of education (18.5%).
In 2013 remains the greatest weakness of Italy and Portugal in pursuing higher education rates but still, the recovery effort is notorious (16.2% and 19.3% respectively and the EU average of 28,4%). On the other hand, the best results in terms of secondary education are found in Italy and Greece (41.9% to 39.8%). Spain leads in higher education, with the highest percentage of population with this education level (33.7%). In turn, Portugal presents a great recovery between 2003 and 2013 at all educational levels (less levels below secondary and growth of secondary and higher education). However, Portugal remains as the country of Southern Europe that has the worst educational performance.
According to the goals of Agenda 2020, it is expected that the percentage of graduates with higher education among people aged between 30 and 34 years is 40% that year.
Portugal has a more fragile position concerning this indicator. It is, however, the country where the struggle for recovery has been proportionately more effective. The increased rates of graduates
14 (25 to 64) of 8.8% in 2000 to 19.3% in 2013, indicate it. It appears that, particularly from 2006 to 2007, Southern Europe has not shown an upward trajectory even when the crisis began. Generally, there are two main premises: (1) countries with worse outcomes in higher education data - Portugal and Italy – present obvious effort; (2) the common trend is above the average growth seen in the US, but it also shows a growth trajectory.
Incidentally, in terms of results, the evolution of the southern European countries is equivalent or even more positive than that observed in the countries of northern and central Europe. Any of the countries of Southern Europe shows similar rates of progress or superior to Sweden, Denmark, Germany and the UK, over the last 13 years. Portugal raised its graduate’s rate by 10.5 pp. Also, policies of Vocational Education and Lifelong Learning have had a central place in the European agenda as well as in other leading international organizations (OECD, for example). By extension, this is also true for national educational agendas. These policies have been consistently referred to as strategic tools for a quality of society, citizenship and social integration: To face the needs of labour markets in a competitive manner, in the context of the knowledge economy and information society.
Southern countries are converging with the European standard. The growth of schooling and tertiary qualifications are one indicator. This convergence presents however relevant differences between them and the results, either in periodization the rhythms of this convergence.
The increase of students entering Vocational Education pathways is evident in specific cases. Spain and Portugal increased by 24 percentage points and 18.2 percentage points, respectively the number of students who opt for this educational segment (Spain, Portugal and 45.5%, 43.8% in 2012). Italy, in turn, shows a decrease 4.4 percentage points, in line with the US average (a decrease of 4.3 percentage points). In 2000, Italy, however, presents a percentage above this medium (Italy: 63.6% and EU 27: 54.5% in 2000), having invested earlier this education segment. Greece has the opposite situation, where Vocational Education has increased slightly, below 50.2% of the EU average in 2012 (33.1%).
Despite these differences point to the existence of differing priorities of education policy at different time cycles, as well as different rhythms in the evolutionary trends within the Southern Europe, when included in the comparative analysis other member states of the EU, the evolution of the percentage of students who are part of the vocational areas within the total students in secondary education based on 1998 once again confirmed the general trend of the four southern countries have been at all similar to that seen in other countries in Europe.
15 In the case of Portugal, the New Opportunities program (Carneiro, 2011a, 2011b), appeared in 2006 in order to qualify and facilitate access of adults to education and increasing education levels. This program produced an extremely positive impact, with an increase of this rate by 6.4 pp (9.8% in 2013). From 2011 this indicator begins to sag result of national policy options, which led to the end of the New Opportunities program without that there was to be replaced by any other measure of equal size in the field of adult education and training.
Italy and Greece grew only slightly 1.4 pp and 1.9 pp respectively, with lower participation rates and a slower evolution. Greece has one of the lowest rates in Europe of 27 (2, 9%). It should be noted that both countries recorded declines in the first years after the crisis, returning to previous levels after 2011.
When we put in evidence the comparison with the other four European countries so far used to complement the analysis, we found that are northern countries that stand out for the highest participation rates (Sweden 28.1% and 31.5% Denmark in 2013) well above the EU average (10.5%), along with the UK at the rate of 20.5% (although it has fallen 4.4 percentage points in the considered time interval). Germany appears this panorama with values closer and even below those found in Southern Europe (registering 7.8% in 2013).
Nevertheless, southern European effort did not produce results distant from their northern peers. The rate of "early school leaving" calculated from data collected by the "Labour Force Survey" concerns the proportion of the population aged 18 to 24 who have not completed the secondary education and is not in a current education or training. It is a key instrument for the monitoring of education and training systems with regard to its quality and level of fostered success.
Italy (17.6%,) is closer to the EU average rate (12.8%) and Greece has the best position, with a rate of 11.4%, integrating the group formed by all the other countries represented here, of which only Denmark (9.1%) and Sweden (the only country that has worsened compared to 2000, from 7.3% to 7.5%) are below the European objective for 2020. The recovery in terms of the convergence of Portugal, Spain, Italy and Greece in respect of early school leavers is therefore unambiguous.
Once again we find a positive development allowing readings of quality of learning, the PISA tests, a test conducted by the OECD for youth skills with 15 years in mother tongue and mathematics. In both areas of competence is clear the positive developments in Southern Europe, which apart from some variations, stabilizes in results indicating improvement courses, but with more global inconsistency by Greece.
16 Skills in the use of mother tongue show that Southern Europe rises gradually after a period of oscillation, approaching the score of 498 the OECD average. On the contrary, other countries that were traditionally known for their best performance of education systems saw the PISA results decline. It is the case with Sweden (results now put this country under Portugal, Italy and Spain) related to the radical educational transformations in this country after the 1990s.
Concerning mathematics, results are generally more homogeneous in the four countries. Southern Europe follows OECD member’s tendencies. In particular Portugal and Italy to demonstrate significant progress (Portugal rises 33 points, with a score of 487, and Italy goes up 28 points, with a score of 485) and approaching the average OECD score of 494. Southern Europe (apart from Greece) is in "counter cycle". They do not follow the general trend of decrease in these results, to which only Germany escapes.
In short, we can identify convergent paths of Southern Europe towards their European partners, translated by a clear pattern of approach of educational performance of the European Union average and OECD average. The convergence of results analyzed here comes mainly from national political efforts, partly driven by the European influence and the political effect of international comparisons. Against this background of diversity, but convergence proven, and the current context of crisis and the consequent impact of austerity policies in Southern Europe, it is relevant to understand the extent of the impacts over the Education sector.
Financial constraints the educational ideology: what changed education in Southern Europe during the Crisis?
The convergence process of Southern Europe is based on visible results of improved populations qualification levels and performance of education systems. This process was only interrupted in the case of Life Long Learning. Among all indicators, this one was the only indicator aggravated. This happens despite the existence of budget cuts pronounced resulting from the austerity policy, this divestment trend materializes in accordance with the so-called "adjustment policies" structural, particularly the state deficit, which are contrary to public proclamations promotion of qualifications and investment in human capital. Are illustrative of this European double the statements of German Chancellor Angela Merkel told Bloomberg financial agency in November 2014, which states that Portugal and Spain have too many graduates and should therefore retreat in obtaining this degree as a priority, focusing rather on the level of vocational training secondary (Public Journal, 04/11/2014). As if the South were to accept an accrual low capacitating profile -
17 and consequently lower employment income - compared with its partners from northern Europe and from the centre.
The impact of austerity was felt in the evolution of expenditure on education as a percentage of GDP for a number of EU countries in the last 20 years. The evolution of expenditure had been stabilizing in the European Union since 1995, with Southern Europe to registering a lower investment but approaching progressively the European average and already recording levels similar to countries such as Germany or the United Kingdom, while Denmark and Sweden have been always kept at a distance, including after slight further decline in 2009. With the advent of economic and financial crisis of 2007/8, we are witnessing an increasing global trend investment, which takes place until 2010. Meanwhile, the year 2011 is marked by the reversal of this trend, registering a reduction in spending in all countries included in the sample and the European average, which was higher fall in southern Europe.
This change has its origin in the European Council of 17 June 2010, which marks the turn to austerity on Europe's crisis response policies, establishing the need to "give priority to fiscal consolidation strategies favourable to growth and focused mainly on spending restraint "(European Council, 2010: 2), by strengthening the role of the Stability and Growth Pact in defining the goals, measures and national budgets. Note that this advice comes to frame external assistance for Portugal and Greece by the IMF, ECB and European Commission, and also the implementation of austerity measures packages in Spain and Italy, due to pressure from the European Commission that sense.
But as we can see, the impact on the results is not visible. The effects of changes in education policies only in term will be felt fully. For example, only in recent years we have seen Sweden suffer from the reform of the 90s. While the improvement of the Germany PISA results cannot turn off the effort to increase the frequency of school way of teaching that wished to balance the excessive by the dual system. It is therefore likely that the impact of budget cuts now checked is only fully reflected on the performance indicators of Southern Europe in a few years. This is a matter relevant to follow up. But you can also argue, more consistently with the data already available, that positive performance in Southern Europe is not proportional to the increase in expenditure, which stabilized or increased only slightly. Therefore, there are policy options, which appear to have the greatest potential impact.
But there is one country, Portugal, which is a particularly interesting case study. It is the country that showed more pronounced structural delays and where there has been a recent trend more pronounced, as a result of an intense dynamics at the policy level, but also one in which one of the performance indicators, the ALV, worsened significantly after the crisis.
18 What happened in Portugal in order that, in such a short time, unlike other countries where the crisis does not seem to have affected key performance indicators, this is accomplished? In fact, in the Portuguese case, there was a brutal shift of orientation in education policies. The context of the crisis worked more like a justification than as a cause of imposing an ideological agenda that reversed the course that had to be followed.
Indeed, a careful reading of the Memorandum of Understanding (MoU) signed between the Portuguese government and the troika ECB-IMF-EC in May 2011, hardly allows us to anticipate this trend. On the contrary, the single point specifically dedicated to education - 4.10 - underlines the need for the Government to continue with the efforts to fight low literacy and early school leaving and to improve the quality of secondary education and teaching professional qualification. These priorities take the objective of "increasing efficiency in the education sector, improving the quality of human capital and to facilitate adaptation to the labour market" (MoU 2011: 21). It will not have been the Ministry of Education to trigger the start of a new tightening cycle and investment in education policies that he did not foresee. On the one hand, it opened a lock-up period, in which the concern with the management of austerity measures imposed to education overrides the concern about the performance of the education and training system. On the other hand, it takes place a crescendo of important tax measures of the conservative paradigm (logic of the debtor's "back to basics" American 60s) education by content, typical of a selective system - growing one that seems less be linked to specific financial constraints as the implementation of a conservative-oriented political agenda, which is representing the reversal of policies that were the basis of the convergence process.
The analysis of the Portuguese government expenditure on education captures the restriction laid down trend, and the impact of the austerity policy in state investment in this area. Public investment in education has been progressively increasing between 2000 and 2007, following the dynamics of system expansion. The advent of the financial and economic crisis of 2007/8 is matched, first, with increasing public investment in education, increasing from a value of 7.2321 billion euros in 2007 to 7348.6 in 2008 and 8507.4 in 2009. This option appears under the first phase of European guidelines to respond to the crisis with stimulus to the economy, for example in Portugal, through the modernization program of schools and the Technological Plan in Education.
With the introduction of the 2010 austerity package, which constitutes the second stage of this process, appears the decline in public investment, visible in the progressive reduction of the expenditure between 2010 and 2013, which changed from 8559.2 to 7108.4, foreseeing even a fall to 6.9591 billion euros in 2014. This same trend can be verified by analyzing the government
19 expenditure as a percentage of GDP. In 2009 the expense equals the maximum value of this century, if encrypting us 4.8%, falling progressively in the following years, registering a value of 4.2% in 2013.
In terms of content, reversing policies towards the introduction of a conservative educational agenda, translated into a set of measures that stand out:
Adult education: Termination of the “Novas Oportunidades” programme and lack of alternative effective measures.
Human resources: Significant reduction in numbers of teachers;
Policies termination: Integrated training programmes such as the “Plan of Action for Mathematics”; Student support measures and scholar success promoting: Extracurricular areas such as “Accompanied study”; The “citizenship education”, course, which provided the time for schools developing different kinds of activities and projects; Ending of the Program of modernization of the buildings; Ending of the technological plan for education;
Budgetary measures: Increasing the number of students per class; Reduction of the number of Teachers; Asymmetrical treatment on funding regarding with the reinforcement of the private sector education (“association contracts”);
System design: Introduction of mandatory national exams at the end of the first and second cycles of basic education (9 year-olds & 11 year-olds); Introduction of “vocational courses”, partially inspired in the German dual system, addressed for children aged 12 years old in risk of school failure, creating from very early stages a system with two separate tracks. These measures, which aim at its base the social selectivity of students in ever earlier stages of their school paths are implemented in a framework in which the European authorities recommend improving education levels, "in particular seeking to reduce the dropout rate to below 10% and increasing to at least 40% the proportion of people aged between 20-34 years old having completed tertiary or equivalent education "(European Council, 2010: 12).
Evidence shows, therefore, that despite an official discourse promoting qualifications, the net result of the policies for education and training are the reduction of the investment and the reversal of policies that were in the know of the observed convergence. We are witnessing the subordination of education and training for macroeconomic solutions to the crisis and the political and economic future of Europe. We must therefore reflect on the link between the crisis, disruption of policies that promoted the convergence of southern European countries and the labeling process to which we have been witnessing since 2008. Even without translation
20 indicators such as AEP, the PISA or completion of higher education, but there are clear signs of the negative impact of political change. According to the National Board of Education school retention (the best predictor of future abandonment), while for the first time in the last four decades, the number of entrants in higher education was reduced in the academic year 2015/12016. We have seen, however, as the indicator of ALV not because the austerity program determines it, but only because the government saw no interest in adult education and training on a large scale.
The ECSE report
The aggregating label of Southern Countries in a specific political-institutional model has little resemblance to the reality of the respective companies, their education and training systems and their performance. Despite sharing a path of convergence with European benchmarks, the way down this path is quite different from each other. Further, the analysis of the indicators allows us to verify the grouping of these countries, as a single, indistinct reality has no analytical consistency.
The consolidated convergence in recent decades is now at risk due to the imposition of austerity measures, which brings us to the core of labelling people of these countries as lazy, as supposedly demonstrate the "resistance" to the qualification (labelling it is part of the PIGS tag). In fact, what is intended with this labelling is the application and solidification of a narrative of the crisis and, most importantly, on what should be the solution to the crisis. This narrative is intended to explain the crisis by the failure of Southern Europe, whose resistance to the qualification would make their economies less competitive and therefore their public finances, including protection policies, less sustainable.
But this narrative runs counter to the verification of educational convergence effort, forcing find other factors probably associated with the financial system, the profile of economic specialization and the prevailing discrimination in the agents of the markets, the explanation for the intensity who have been harmed by the crisis and the austerity policies
Still, at least for now, the negative impacts that have occurred in the Budget Plan are not visible in the performance indicators of education systems of these countries. In fact, where there is already evidence, everything seems to point to a greater influence of the ideological orientation of governments in the establishment of political priorities and their outcomes.
21 The report has 4 chapters. The first chapter presents the objectives and methodology of the project. It focuses the diachronic period from 2000-2013/ 2014. The analysis of these periods, before and after the crisis, focuses on adaptations and continuities of education policies.
The second chapter refers to the contextualization of Southern Europe and is divided in two parts. First, the characterization of these countries is produced at the light of a battery of socioeconomic indicators, further framed by social inequalities notions. Second, the characterisation of the education systems is done taking into consideration school offer and scholar pathways, as well as number of students and teachers. A further comparison is presented and discussed.
The following chapters focus on the comparison between two big themes, quality and equity. On the one hand, the third chapter is related to the Monitoring and Evaluating the quality of educational systems in Southern European countries. On the other hand, the forth chapter discusses equity and political achievements, agendas and outcomes.
Finally, the fifth chapter analyses, in conclusive terms, the weight of policies and political cycles over our exploratory variables.
22
Chapter 1 Objectives and Methodology
The educational systems’ performance in Southern Europe showed, over the last decades, differentiated rhythms and paths, although sharing a significant improvement and convergence towards the European schooling trends. These achievements are illustrated trough the evolution of some key indicators, such as the early school leaving decline, the improvement in achieving tertiary education, or the development of long life learning policies. However, when comparing Southern European countries with other member states, the first still present educational results below the European average. This means that there is still a necessity for some amount of effort at the political domain mainly, in order to accomplish the main goal of achieving international demands and bettering the domestics’ results.
Our preliminary analysis for the four Southern European Countries (Portugal, Spain, Italy and Greece) suggests two main points: First, a substantial effort to overhaul their Educational and Training systems and increase its performance. Consensually, increasing the population´s qualification and bettering the educational performance serves both to social cohesion and economic development aims (Martins, 2012) – and this is a perspective fostered within the European initiatives such as the Lisbon Strategy, or the Europe 2020 strategy. Second, a considerable gap remains in achieving educational levels similar to the Central and Northern European counterparts. (Education at Glance 2012, 2013, 2014)
During the 1970s, Europe developed important political instruments towards a communitarian consolidation. During this period, Education emerges as a concerning and a central political point, particularly in case those countries with the weakest economies and the lowest educational performances. With the Maastricht Treaty in 1992, and
particularly its article 1261, Education became a priority for future intervention, entering
1 ARTICLE 126
“1) The Community shall contribute to the development of quality education by encouraging cooperation between Member States and, if necessary, by supporting and supplementing their action, while fully respecting the responsibility of the Member States for the content of teaching and the organization of education systems and their cultural and linguistic diversity
2) Community action shall be aimed at:
-developing the European dimension in education, particularly through the teaching and dissemination of the languages of the Member States
- encouraging mobility of students and teachers, inter alia, by encouraging the academic recognition of diplomas and periods of study
23
the European politics dominion through a mutual agenda planning member states’ orientations towards the so-called “Europe of Knowledge”.
This political conception reflected the economic influence on education and training, with countries’ performance (meaning schooling rates) beginning to be presented as an economic growth indicator. Lisbon Strategy remains as one of the most important processes on showing the benefit of economic development and modernization of Europe, approaching Education and Training as one of its major targets, well centred on political communitarian domain. Nowadays, countries with the most developed economic structures, better labour markets structures and a positive economic productivity index are also those with the best performances on education.
“The most competitive and dynamic knowledge-based economy in the world capable of sustainable economic growth with more and better jobs and greater social cohesion “
Lisbon Strategy, 2010. The Lisbon Strategy represented an action plan devised in 2000, which set a framework until 2010. At this point, the concerning was: to increase Europe’s competitiveness by investing in a knowledge-based and productive society; respond to the challenges of the Information Societies and Globalization (meaning: demographic changes, social inequalities, educational quality and effectiveness); improve compatibility between educational systems structures; Lifelong Learning developed in all member states; creating a common reference for recognition of qualifications and competences. The targets were “employment rates”, “gender equality on employment”, “economic growth”, as well as on education and training reforms and investments.
As it is well known, recently Greece and Portugal were both involved in rescue plans with the intervention of TROIKA at 2010/2011; Spain signed a stabilization pact in 2010; and Italy experienced several internal budget restrictions. We may question the effects from the austerity measures implemented in these countries ever since; from the budgetary
-promoting cooperation between educational establishments
- developing exchanges of information and experience on issues common to the education systems of Member States
- encouraging the development of youth exchanges and the exchange of socio-educational instructors -encouraging the development of distance education” (Article 126 of the Treaty on European Union).
24
restrictions, currently intensified with the political crisis being experienced in Greece. Once these countries had primary economic and social fragilities the feasibility of these international intervention in small and peripheral countries became a matter of concern. In fact, on one hand, we have to considerer that some changes were the result of a direct response, or a process of adaptation which took in account the negative economical outcomes from the crisis and international impositions, and one the other hand, we also have to considered the internal political dynamics and the internal political priorities in each southern country.
Summing up, the Southern European Countries were engaged in a process and trajectory of convergence regarding education and training performance’s and results, process interrupted since the burst of the crisis. Austerity has been, after 2010, one main political response to the crisis, curtailing the public investment and thus the state funding towards education. On the other hand, mass unemployment, drastic slowdown in economic activity and the significant decrease in workers income have also potentially changed both the will and ability of families and investors to invest in Education and Training (Guerreiro, 2011).
Considering the current scenario of economic and budget crisis, one should question to which extent are, in fact, the signs of public disinvestment on education observed in these countries, of if we are facing financial restrains with mainly severe aspects of adaptation on funding and public budget. Further, one should ask in which extent these adaption measures can actually explain the changes observed in policies and educational outcomes. The present report is the result from the international project research, “Educational Challenges in Southern Europe. Equity and efficiency in a time of crisis”- ECSE Project, coordinated by a Portuguese Team from CIES-ISCTE- IUL and with partners/consultants from Spain, Italy and Greece. Mainly, the ECSE project focus on the crisis´s impacts in southern European countries on the educational matrix, stretching out the impact of the common recession on the outcomes of these countries’ education and training systems. The project was developed between 2013 and 2015, focusing on period between 2000 and 2014 in order to sustain a diachronic analyses, distinguishing the period preceding the crisis – mostly, by reporting the educational achievements fostered since Lisbon Strategy - and the recent period within a crisis context – represented by the several budget
25
cuts and national policies restructuring. The main aim is, thus, to identify the major changes and adaptations that Southern European countries faced during the overall period.
The negative outcomes of the aforementioned budget crisis on education, particularly those looking into the funding and the levels of expenditure (OECD, 2013; OECD, 2012) or in the educational efficiency, have been a matter of discussion. The ECSE project focus was the political framework and the existing response towards the crisis. Departing from the interpretation of specific data and using a diachronic perspective, we analysed in which way southern European countries were affected, as well as the main differences and regularities identified among those countries. This way, the relevance of the project concerns also in its approach on Southern Europe as region with specific characteristics in the European educational framework.
A project that highlights the crisis impacts on education is easily justified by the current geopolitical context but also by the importance of education within the European framework, particularly since the Lisbon Agenda, in particular the re-emergence of human capital theories linked with economic development and educational performance
and attainment (Schultz, 1961 ); the development of an “European Educational Space”
(Dale, R. 2002, 2004, 2005; Martins, 2012), the emergence of Lifelong Learning agendas, the intensification of the discussion over the globalization impacts, and the Europeanization process (Featherstone, Kazamias, 2000 ) on education and national policies (Meyer, J., Ramirez, F, Soysal, y. 1992 ; Dale, 2002, 2004 ; Green, 2006, 2013 ; Martins, 2012; Azevedo, 2007; Antunes, Fátima, 2004, 2005); and secondly, considering the specific characteristics of southern societies and its educational outcomes, with structural problems still characterizing these societies (such as the population´s qualification; early school leaving highest rates, or the highest school failure rates.) The ECSE project innovates in two main fields. Firstly, the education and training structures, processes and outcomes are put in relation to the impact of macroeconomic trends, a theme that has not been sufficiently addressed and that is of great actuality; in the second place, it innovates in the methodological approach, in two ways: the comparative analyses between the four countries is based not only on international data, but also in deep national based research – sustained by the work developed all over the
26
years by the team members, particularly by the coordinator team - the conceptual and methodological framework for the comparisons will be built mainly upon the contribution of researchers from the southern countries. As it was said, the range of the ECSE project is the four of southern Europe countries: Portugal, Spain, Italy and Greece. Treating these Southern European countries as a group for analytical proposes is justified on several accounts. Firstly, these countries share a similar economic, social and political background, including relatively recent authoritarian experiences, recent welfare states (Ferrera, 2000 ) as well as economies hampered by productivity and competitiveness problems (Capucha, 2014; Niemeyer, 2007;). Secondly, the economic crisis has been especially severe in these countries. What are the consequences of this crisis in both the achievement of educational goals and the design of educations and training systems, and what are the consequences for the fight against the crisis, are the two main questions envisaged by the project.
The project methodology and data´s analyses, follows the importance of a fluid vision concerning the general policies and the diachronic analysis, combined with specific indicators that have shown more accurate results. The first one, allows us to understand the main political changes and its impacts on policy-making in a more generic way, and the second to isolate some results stressing differences between the southern countries in some educational dimensions. Table 1 resumes the variables, dimensions and indicators.
27
Table 1. Variables, dimensions and indicators.
The research hypothesis figures two main dimensions: democratization vs selectivity. Both dimensions are contributing to the comprehension of educational equity in southern European countries and their educational systems. We assume, and it is our main argumentation, that crisis and political governance (in the form of the several governments in last years, in all four countries) both had great influence on educational systems and its results. Which of these two explanatory variables were the most relevant on policy-making changes and educational results, between 2000 and 2013? It has been a central goal to understand how educational systems in Southern Europe, within a context of crisis, have been able to promote, through its political mechanisms, durable processes of equity in education. Adding, had the impacts of the current context of crises,
28
leaded to greater selectivity in education? Considering the data analysis method, as well as the indicators used, we achieved, on one hand, to results within a diachronic perspective allowing to compare the four countries, and on the other hand, to consider the autonomous impacts of the policies that have been implemented.
Indicators and Dimensions
Our main dimension – earlier defined - were analysed and materialised through a set of indicators. These indicators were mainly chosen considering several studies developed in Education and its relation with equity and quality, particular from OECD: “Equity and quality in education” (OECD, 2012); “What´s equity in education?” in Education at Glance 2012: Highlights, (OEDC, 2012); Key Data in Europe (Eurydice, 2012, 2013); “Funding of Education in Europe – the impact of the economic crisis 2000-2012.” (Eurydice, 2012).
The indicators, both quantitative and qualitative, were analysed to capture the signs of adaptation, or rupture within the educational policies and in relation to the context of crisis. Considering the diachronic analyses mentioned before, the year of 2000 was chosen as the “ year zero” mostly because of the impact of the Lisbon Agenda (2001), which allowed to benchmark the position of the four countries and capture a specific moment concerning European educational policy. Among the areas analysed we can generally identify: (1) access to the education system and educational system and its diversification; (2) success and school results; (3) access of specific segments of the population: with special educational needs and adult population;(4) a set of organizational and institutional aspects, concerning educational systems, their designs and the processes of evaluation and quality; which, finally, allowed the discussion of the levels of equity and quality in Educational systems of southern Europe.
In a more specific way, and according to our initial plan presented in the project proposal/application (PTDC/IVC-SOC/5079/2012), the indicators were distributed within the follow main areas, or aspects:
29 (1) all education and training pathways available to students up until the start of their
active life (be it at primary, secondary or tertiary level) as well as existing devices and strategies to prevent early school leaving;
(2) the adult education and lifelong learning, dealing with education and training paths,
targeting population aged over 25 as well as the range of devices for recognition and validating of qualifications;
(3) The transparency of qualifications and the articulation between the education and
training systems. Mainly seen in tracking, educational pathways and access to tertiary system.
(4) the structure of services and benefits aiming at guaranteeing universal access to the
education and training systems, as well as, the specific national programmes towards the educational success and equity promotion– such as scholarships, transportation, feeding, housing, studying materials, special education for disabled persons and also social support to underprivileged pupils.
Within these areas, the following key dimensions of analysis were considered: (a) in diversity and relative importance of available pathways within the system (including institutional design which concerns system governance, learning mechanisms and institutions); (b) in curricula, transitions and levels of success - which is linked with the organization, flexibility and transparency of the structure of courses and educational options; (c) in human resources, comprising large numbers (teaches, pupils, staff), teachers’ training and working conditions of the learning agents, which are linked with the issues of Quality; (d) funding circuits, which concerns the origin (public, or private) and magnitude of the financial resources channelled into the educational sectors.
The goal here was to capture how Southern European states have steered the policies regarding the investment in equity and social inclusion, as well as the responses that were set in place to deal with the effects of the crisis.
30
Considering the national report structure the dimensions were simplified in a more flexible matrix considering the indicators and themes/subjects treated. (Please see in Appendix – section 1 – The contents of the reports)
Research Plan and stages of the investigation
The research plan comprised four stages: (I) Model of Analysis - the development of the theoretical, analytical and methodological models of the research project. In this stage, a set of indicators were signalized concerning the main dimensions above described. A common analytical grid was assembled, comprising the main areas to be analysed in the national studies as well as the national reports structure, discussed and worked with all partners at the end of the second meeting/workshop. The collecting of the main information/data from international data bases, which has served the national reports production, were made namely from UNESCO/OCDE/Eurostat, Eurydice, ESSPROS (Integrated System of Social Protection Statistics) and CEDEFOP (European Centre for the Development of Vocational Training) the main sources for information in order to guarantee data comparability between the four countries. ; (II) Parameterization of data collecting – preparing the national data packages by the Portuguese team, that functioned as the main support for the development of the each national studies. These data were complemented with other information collected by each team, especially concerning national educational policies. Each section of the national report had a specific excel document containing data, graphics, figures and metadata (III) National Studies - the production of the four national studies, the basis of the ultimate comparative report. Each team had made one national report, following the main dimensions. (Please see in “Appendix” – section 4 the four national reports) (VI) Comparative analyses - The analysis of results obtained in the national studies and production of a comparative study, in a form of these ultimate international and comparative report; and (V) dissemination and public discussion of the results – several public presentations were made, 8 conferences and communications; two articles were published and, until now, two other articles are being closed for international submission. Adding, each team is preparing one article concerning its own national report (national publication) and 3 other articles (for international publication) after the final report´s submission.
31 Analytical focus
Considering the crisis and its impacts on the education system performance and on policy-making trends, as the key axes of the project, the project focus on working in an analytical framework with three major dimensions:
1) Indicators of Performance (2000 – 2013) – collecting and analysing major indicators
on access, success and quality within the Educational System, as well their dynamics and key agents involved;
2) Change and Innovation in Policy making (2000 - 2013) – establishing a timeline in
what has been produced on the education policy field (2000 - Lisbon Strategy), which includes international demands or agendas; establishing or detecting differences on policies or even trends in educational policy; and at last but not least, developing the diachronic perspective as a comparative method for analyses ; Analysing the specific policies that could explain the results and the main figures previous analysed.
3) Effects of the crisis on the system’s ability and capacity for promoting educational
equity.
Working on an open analytical framework assured that national specificities were considered in all the analytical dimensions and, simultaneously, that the comparative goal was also achieved, allowing to describe the effects of the crisis on education and predict tendencies of evolution.
Two main concepts underlined the project objectives and premises. Each team was free to present their own perspectives, based on their own contexts and national lines of investigation of equity and quality in education, however, and in order to keep the comparative goal, Equity was generically referred to effective, as opposed to formal equal
educational opportunities, implying the focus in dimensions of inclusion and fairness
present in the educational system, i.e., population characteristics and socioeconomic context such as family and cultural background, or even ethnical background and disability - as factors that promote or hinder equal opportunities in the access and participation in education and in school results (for instance, at an internal level – students