Ecological drivers of plant genetic diversity at the southern edge of
geographical distributions: Forestal vines in a temperate region
Michel J. F. Barros
1, José Alexandre F. Diniz-Filho
2and Loreta B. Freitas
1 1Department of Genetics, Universidade Federal do Rio Grande do Sul, Porto Alegre, RS, Brazil.
2Department of Ecology, Universidade Federal de Goiás, Campus II, Goiânia, GO, Brazil.
Abstract
The Tropical Niche Conservatism hypothesis is one of the most relevant theories to explain why tropical diversity is high, although the mechanisms underlying this hypothesis require further clarification. A possible research avenue to address the underlying mechanisms includes determining population-level processes associated with such a hy-pothesis, in particular by trying to identify how adaptation may occur in extreme niche conditions at the edges of spe-cies ranges. However, the determinants of molecular diversity at the edges of geographical distributions of tropical taxa are still poorly known. Here we assessed which environmental variables determine diversity in nuclear and plastid genetic markers for populations of fourPassiflora species in the southern limit of their geographical distribu-tions. Climatic factors can drive genetic diversity, and their importance varies according to the marker. The primary predictors are variables representing higher temperatures during cold periods of the year and higher precipitation during dry periods. We concluded that, although these species are present in colder areas at the edge of their range, Tropical Niche Conservatism acts as a restraining force on genetic diversity in southern populations ofPassiflora.
Keywords: Distribution edges, genetic diversity,Passiflora,niche conservatism, environmental drivers.
Received: February 07, 2017; Accepted: June 12, 2017.
Introduction
Understanding the limits of geographical distribution of species and how these limits are determined is of special interest to answer several questions in evolution and popu-lation genetics (Angert, 2009). Distribution limits vary among the different levels of evolutionary organization (among species in clades, among clades) and across the ge-ography per se (Sheth and Angert, 2014) and several hy-potheses have been proposed to clarify these differences. Many studies have associated the limits of geographical range to limiting environmental variables (Angert, 2009), and range limits for many species are at least partially im-posed by climate gradients that will shift directionally un-der climate change (Parmesan, 2006; Klimeš and Doleal, 2010).
The Rapoport’s rule states that species can have nar-rower tolerances in more stable climates, leading to smaller ranges and allowing coexistence of more species (Sizlinget al., 2009), and the pattern of average range size in a clade
would decrease from temperate to tropical areas (Sheth and Angert, 2014). Conversely, tropical species could have
more specialized habitat requirements and narrower toler-ances than temperate taxa (Stevens, 1989). Thus, according to Angert (2009), species distribution can be viewed as a spatial manifestation of the niche, where the geographical range represents a mapping of fitness as a function of abiotic and biotic environment on landscape.
The tropical niche conservatism (TNC) hypothesis has frequently been used to explain why tropical ecosys-tems are biologically more diverse (Wiens and Donoghue, 2004; Diniz-Filhoet al., 2007; Oliveira-Filhoet al., 2013;
Hawkinset al., 2014). Among other statements, this model
suggests that dispersal into temperate regions has been lim-ited because adaptation to colder temperatures appears to be uncommon (Smithet al., 2012). Yet, despite its
impor-tance, the mechanisms underlying TNC are still poorly understood, in large part because many studies address macroecological data only.
Plant families that originated in the South generally exhibit higher TNC values and include many lineages re-stricted to the Neotropics, whereas several northern-origin groups occur both in the Neotropics and in Nearctic regions (Smithet al., 2012). Accordingly, the TNC model states
that few tropical groups expanded and adapted to temperate environments (Wiens and Donoghue, 2004). Therefore, the influence of factors such as demographic stochasticity might participate in shaping the distribution of diversity at the margins of species’ ranges (Hampe and Petit, 2005). DOI: http://dx.doi.org/10.1590/1678-4685-GMB-2017-0031
Send correspondence to Loreta Brandão de Freitas, Laboratory of Molecular Evolution, Department of Genetics, Universidade Fed-eral do Rio Grande do Sul, Av. Bento Gonçalves 9500, PO Box 15053, Porto Alegre, 91501-970, RS, Brazil. E-mail: [email protected].
PassifloraL. is the largest genus in Passifloraceae
and encompasses ca. 560 wild species distributed primarily in the Neotropical region (Ulmer and MacDougal, 2004). Only approximately 5% of these species are distributed outside of tropical Central and South America (Abraham-czyket al., 2014). The most recent molecular phylogeny
has organizedPassifloraspecies into four subgenera that
are fully supported by morphological traits (Muschneret al., 2012). Two of them present several important genetic
differences, such as genome size (Yotokoet al., 2011) and
organellar inheritance (Muschner et al., 2006). The Passifloraspecies have been used to explain the origin of
existing forests in the temperate zone in southern Brazil (Rambo, 1961), and they are related to the biogeography of this region (Moreiraet al., 2011).
The Brazilian state of Rio Grande do Sul (RS) is the extreme southern limit of 16 species ofPassiflora(Cervi,
2006; Mondinet al., 2011), and here we selected these to
investigate environmental variables that determine variability in nuclear and plastid genetic markers for popu-lations at the southern limit of Passiflora species’
geo-graphical distribution and associate them to different physiographical regions.
Materials and Methods
Studied areas
We defined our study region to assess the differentia-tion of physiographic regions from the north of Rio Grande do Sul, Brazil (Figure S1) as described in Fortes (1959). We focused on the region called `Portal de Torres’, a transi-tional area for diversity in the eastern tropical forests of Brazil (Pinheiroet al., 2011) and, to the west, the Upper
Paran and Uruguay Rivers. These are the areas in which
Passifloraspecies occur in the extreme south of Brazil. We
also sampled information from the east of Rio Grande do Sul, representing a more humid area at the southern limit of the distribution of many species within thePassiflora
ge-nus (Mondinet al., 2011; Moreiraet al., 2011).
Data sampling and handling
We extracted environmental data and biogeogra-phical information for the entire region wherePassiflora
species are found, from the Portal de Torres to the west, and environmental and genetic information from the east repre-senting the southern limit for four Passifloraspecies (P. caerulea L. and P. tenuifila Killip, representing the Passiflora subgenus, and P. misera Kunth and P. capsularisL., representing theDecalobasubgenus).
For the environmental analyses we obtained informa-tion on climate and altitude variables in occurrence areas of
Passiflorato assess the degree of variance in different
envi-ronmental factors in the studied region and search for multivariate environmental differentiation among major ar-eas. We used altitude and bioclimatic variables obtained
from WORDCLIM (http://www.worldclim.org/). More specifically, 19 variables representing distinct properties of climate such as temperature- and precipitation-specific niche characteristics were included in this study. These variables are widely used for modelling niches of species and other taxa because they represent specific environmen-tal factors that can influence the geographical distribution of taxa on large and small scales. We used layers with a res-olution of 2.5 arc minutes (~4.5 km) and extracted average values per grid cell. We transformed point data into grid files by implementing the re-sampling circular neighbor-hood technique (as suggested by Zonneveldet al., 2012),
which we applied in Diva-GIS 7.5.0 (Hijmanset al., 2002).
To access genetic variability, we selected two rele-vant markers for our analyses: the nuclear ribosomal DNA internal transcribed spacers (ITS) and the plastid intergenic spacertrnH-psbA. The ITS sequences present moderate to
high intraspecific genetic variability inPassiflora(Mäder et al., 2010; Giudicelliet al., 2015), andtrnH-psbAis one
of the most variable regions in Angiosperm genomes (Storchov and Olson, 2007). DNA sequences were ob-tained using primers and protocols described by Lorenz-Lemkeet al.(2005). We obtained sequences from 31
indi-viduals fromP. caerulea,30 fromP. tenuifila,18 fromP. misera,and 26 from P. capsularis. Geographical
coordi-nates obtained from previous fieldwork represented all in-dividuals (Supplementary Material Table S1). To avoid incorrecta prioridefinitions of populations, we included
molecular richness grouping data from all four species, de-fined according to their occurrence in distinct spatial units, so that these data included all sequence types per marker (see also Miraldoet al., 2016). Specifically, we mapped the
richness of sequences in the grid cells and used the richness scores as response variables representing the genetic struc-ture of markers. As the same individuals were used to repre-sent both genetic markers, we developed two grids layers, formed by 134 cells each, at 0.3 degrees of resolution. The cells obtained were the same ones used for the extraction of values of environmental factors, which we applied for the subsequent analyses, including modelling of genetic diver-sity.
Data analyses
We used principal component analyses (PCA) based on the values of climate and altitude variables in each grid cell with occurrence ofPassiflorato assess the degree of
variance in different environmental factors in the studied region and search for multivariate environmental differen-tiation among major areas. The four resulting PCs were used to establish K-means clusters for two and three groups, consecutively. Biogeographical cluster analyses were implemented based on a presence/absence matrix of the species ofPassiflorafollowing occurrences reported by
Mondinet al.(2011) in the 11 physiographic regions
UPGMA (Hammeret al., 2001) based on the Euclidian
dis-tance among physiographic regions and bootstrapped with 1000 randomizations. Subsequently, to provide additional robustness to the presence/absence matrix, we integrated this dataset with a matrix for the genusMikania(Ritter and
Waechter, 2004), which also takes into account the physio-graphic regions defined by Fortes (1959).
The sequences of both genetic markers were automat-ically aligned using Muscle as implemented in MEGA 6.0 (Tamuraet al., 2013). Molecular diversity indices were
cal-culated in DnaSP 5.0 (Librado and Rozas, 2009) for the four species. Sequence richness was used for estimating ge-netic diversity within species and for spatial analysis be-cause it has already been shown as strongly correlated to species definition as well as environmental predictors (Papadopoulouet al., 2011). Nucleotide diversity was also
estimated, but it was not high enough to be used in correla-tion analyses.
We applied three spatial regression methods (see Diniz-Filhoet al., 2009) to search for regional and local
predictors of diversity: ordinary least squares (OLS), si-multaneous auto-regressive (SAR) models, and geographi-cally weighted regressions (GWR), all implemented in the software SAM 4.0 (Rangelet al., 2010) using the grid cells
as geographical units. For OLS and SAR, we normalized the distributions of the variables’ values to homogenize the variances (i.e., create homoscedasticity) by applying
aver-age environmental values per diversity class obtained in the diversity grids (e.g., using all grid cells represented by one
sequence type, we computed the average values of the envi-ronmental variables; we did this for each diversity class). We used Shapiro-Wilk, Jarque-Bera, Chi-square, and An-derson-Darling tests to assess the normality of the distribu-tions, as implemented in PAST 2.17 (Hammeret al., 2001).
To select models and to identify the most relevant en-vironmental predictors from autoregressive models, we used the Akaike information criterion (AIC), which takes into account both predictive power and complexity (Rangel
et al., 2010). In addition to the total coefficients obtained by
OLS and SAR, we used GWR to obtain local and spatially explicit model parameters for each grid cell, based on ITS andtrnH-psbAmarkers. We grouped together all
environ-mental predictors in SAR models selected by AIC for both genetic markers. Next, the inclusion of additional variables for GWR was assessed regarding its power to predict the di-versity, minimizing the residuals, and increasing the model effectiveness. In GWR, according to a predefined function, all data points within a given bandwidth can be weighted according to their spatial distance from a focal point. The distance decay of the weight adopted was a Gaussian func-tion with a fixed bandwidth established via AIC optimiza-tion. We assessed the residuals of the GWR models for each grid cell and at distinct distance classes for both models representing the molecular markers.
Results
Clustering biogeographical and habitat areas
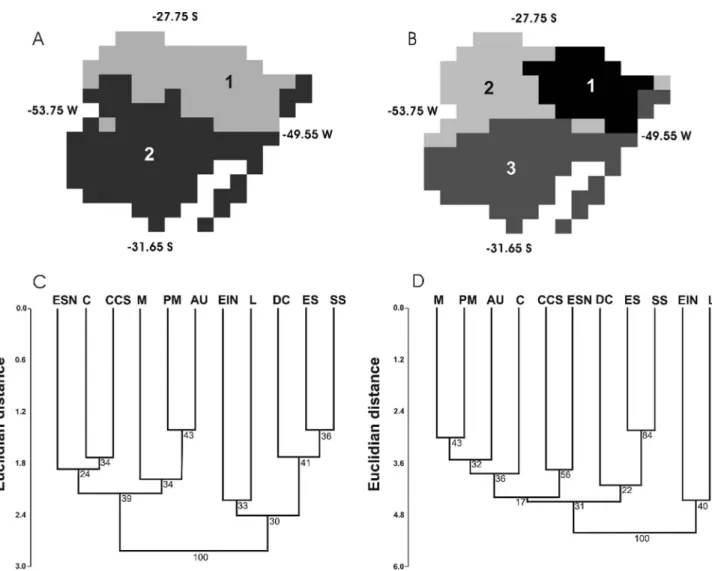
Individuals ofPassiflorawere found in three physio-graphical regions according to the classification by Fortes (1959) for southern Brazil: Encosta Inferior do Nordeste (EIN), Encosta Superior do Nordeste (ESN) and Litoral (L), and these were included in the genetic analyses (Table S1). A distinction between eastern and western physio-graphical areas proposed by Fortes (1959) was confirmed in geographical analyses (Figure 1A). A similar separation did not appear in the K = 2 environmental groups (Figure 1A), but became more evident in the K = 3 (Figure 1B). The cluster analyses of phytogeographical regions, based on the presence/absence matrix of species ofPassiflora(Figure 1C) andPassiflora+ Mikania(Figure 1D), validated the separation between the east and west that the biogeo-graphical groups largely defined (full bootstrap; Figure 1C,D). These groups primarily consisted of separate west-ern and eastwest-ern portions of northwest-ern forests in Rio Grande do Sul, which are part of the Atlantic Forest domain.
The four principal components determined by PCA based on environmental data, which were also used for clustering analyses (K-means), explained ~92% of the total environmental variance (Table 1). PC 1 alone accounted for ~56% of the total variance and was principally formed by altitude and the following bioclimatic variables: mean tem-perature of the warmest quarter, annual precipitation and annual mean temperature. Therefore, most of the differenti-ation among niches identified in the geographical cluster-ing analyses uscluster-ing altitude and bioclimatic variables derived from these specific variables because their vari-ances and explanatory power were higher (Table 1). The eastern areas are more heterogeneous and most likely pres-ent more diverse niches; this becomes more evidpres-ent with K = 3 than with K = 2 (Figure 1A,B). Additionally, there is a differentiation between eastern and western niches. Fol-lowing this environmental configuration, a group repre-senting the Pampas and Coastal ecosystems appears as a separate unit (Figure 1B; group 3) and includes most of the modelled genetic diversity. Although it was not our objec-tive here, we highlight that more variance can be found within this last group, which separates the resting plus rain forest physiognomies in the littoral zone from the Pampas grassland.
Diversity and niche predictors
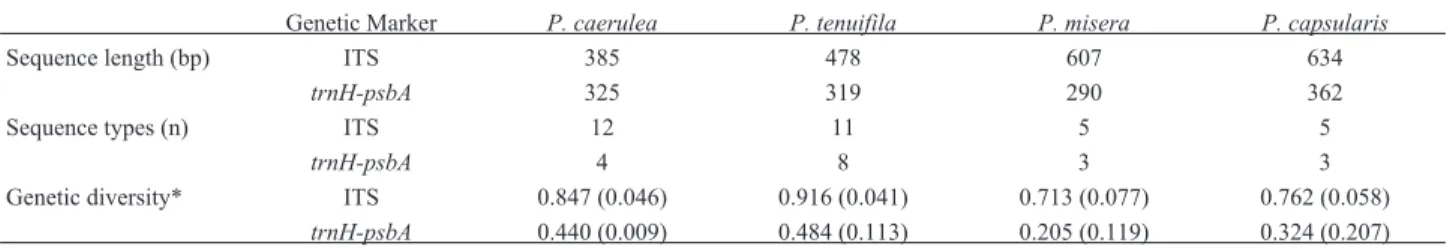
Total genetic diversity is presented in Table 2. Re-sampling sequence richness was useful to the study of both markers. Sequence richness for the ITS grid was repre-sented by values ranging from 1 to 23. ThetrnH-psbAgrid
Figure 1- Geographical clusters derived from the four most relevant principal components under K = 2 (A) and K = 3 (B). Cluster analyses for vegetation
groups based on a paired group algorithm using Euclidian distances bootstrapped by 1000 randomizations based on either allPassifloraspecies occur-rence (C) orPassifloraandMikania, incorporating the distance matrix from Ritter and Waechter (2004) (D). The physiographical regions according to Fortes (1959): Litoral (L), Depresso Central (DC), Encosta Inferior do Nordeste (EIN), Campos de Cima da Serra (CCS), Encosta Superior do Nordeste (ESN), Misses (M), Planalto Médio (PM), Alto Uruguai (AU), Campanha (C), Serra do Sudeste (SS), and Encosta do Sudeste (ES).
Table 1- The most relevant niche contributors identified by principal component analysis. The values of environmental variables were extracted for each
grid cell. Here we present the four principal components, which explained most of the total environmental variance (91.66%). The variance (V) and eigenvalues (E) are shown for each PC, while we presented the loadings (L) for each identified contributor.
V (%) E Environmental contributors L
PC1 55.56 11.11 Altitude 0.28
Mean Temperature of Warmest Quarter -0.27
Annual Precipitation 0.27
Annual Mean Temperature -0.26
PC2 16.47 3.29 Mean Temperature of Wettest Quarter 0.44
Mean Diurnal Range 0.36
Precipitation of Coldest Quarter -0.32 Mean Temperature of Driest Quarter -0.30
PC3 12.7 2.55 Precipitation Seasonality -0.38
Temperature Annual Range 0.35
Mean Diurnal Range 0.33
Precipitation of Driest Quarter 0.31
PC4 6.87 1.37 Temperature Annual Range 0.44
and underestimates were observed for the prediction of plastid diversity. To select the most relevant predictors, we looked at the models that presented the lowest AIC values in SAR. These models indicated that diversity in the ITS marker was highly correlated with temperature predictors, while precipitation variables better explained the occur-rence of plastid diversity (Table 3). These niche determi-nants reflected the adaptation of Passiflora to tropical
warm and humid climates. The diversity variables were strongly correlated with the amount of higher temperatures and the elevated occurrence of precipitation in harsh annual periods.
GWR analyses revealed similar patterns of localR2
for both DNA markers, and the inclusion of temperature and precipitation variables identified in SAR (Table 3), plus altitude, was the combination that minimized model residuals (Figure 2). However, the coefficients estimated based on ITS data predicted diversity principally in the northwest, northeast coastal, and southwestern areas of species distributions (Figure 2A,B), whereas higher pre-dictions for plastid markers were obtained in the eastern, coastal, and northwest regions (Figure 2C,D). The auto-correlation of residuals was minimized for distant re-gions and when the variable altitude was included. However, even with the inclusion of altitude, it remained high in the first distance class (Figure 2E). Anyway, most of the grid cells with high degrees of residual variance were outside the predicted hotspots of diversity (Figure 2B,D).
Discussion
Dealing with spatial autocorrelation in genetic diversity
Spatial patterns can be better interpreted when auto-correlation in trait values is considered. Legendre (1993; see also Dormannet al., 2007) postulates that spatial
ana-lysts may interpret spatial autocorrelation as an opportunity or a challenge. In fact, it is an important property of biologi-cal diversity that can result from evolutionary and ecologi-cal phenomena. Therefore, our findings were successful in combining simultaneous autoregressive (SAR) models to identify predictors and geographically weighted regres-sions (GWR) analysis of local correlations to search for ecological drivers of genetic variability at the scale of grid cells.
Although the studied areas belong to a region with a temperate climate, genetic patterns found based on molecu-lar diversity ofPassifloraare more closely related to
repre-sentative variables of environmental conditions from tropical zones. This suggests that, despite reaching temper-ate zones in the southern limit of the genus’ geographical distribution, these species only occur in suitable (tropi-cal-like) conditions and do not present patterns driven by the temperate climate itself. Instead, they may be con-strained by the typical temperate climate (broadly includ-ing subtropical climates). The use of AIC allowed us to select the minimum adequate autoregressive models and suggested that increases in the values of temperature vari-ables better predict diversity in the nuclear marker ITS, while the amount of precipitation is positively associated with plastid variability (Table 3). All these findings suggest a dependency of tropical climate for diversification,
dem-Table 2- Characteristics of DNA sequences and summary of genetic diversity of fourPassifloraspecies.
Genetic Marker P. caerulea P. tenuifila P. misera P. capsularis
Sequence length (bp) ITS 385 478 607 634
trnH-psbA 325 319 290 362
Sequence types (n) ITS 12 11 5 5
trnH-psbA 4 8 3 3
Genetic diversity* ITS 0.847 (0.046) 0.916 (0.041) 0.713 (0.077) 0.762 (0.058)
trnH-psbA 0.440 (0.009) 0.484 (0.113) 0.205 (0.119) 0.324 (0.207) *Standard deviation in parenthesis
Table 3- Selected values of correlation coefficients. The best SAR models were selected based on minimizing AIC values.
Genetic marker Niche variables SAR OLS AIC p
ITS Mean Diurnal Range (BIO2) 0.458 0.513 152.78 0.016
Min Temperature of Coldest Month (BIO6) 0.562 0.418 149.58 0.054
Temperature Annual Range (BIO7) 0.334 0.408 155.33 0.061
trnH-psbA Precipitation of Driest Quarter (BIO17) 0.905 0.522 125.68 0.012
Precipitation of Driest Month (BIO14) 0.999 0.453 10.626 0.032
onstrating the possibility that TNC plays an important role to genetic variability ofPassiflorain the edge of its
distri-bution. However, more species and markers within the ge-nus should be tested in the future using methods that incorporate the effect of spatial autocorrelation to confirm this proposition.
Origin and differentiation of diversity areas in southern forests
The division into western and eastern forests, previ-ously suggested by Ritter and Waechter (2004), was con-firmed here for the region studied based on species occurrence and clusters of multivariate components,
al-Figure 2- Geographically weighted regression. The values of genetic diversity were regionally regressed against the most relevant bioclimatic predictors
identified in SAR models (Table 3) in addition to altitude to minimize residuals. The ITS marker exhibited higher localR2values in eastern and western areas (A), and the highest values of residuals were minimized in these areas (B). The localR2fortrnH-psbAare lower in the central area (C), with a pattern of residual values similar to that observed for ITS (D). All analyses were significant (p < 0.001). The Moran’sIcorrelogram (E) shows that these
though the eastern areas are more heterogeneous and pres-ent a higher number of niches (Figure 1A,B). The eastern forests studied here lie in the southernmost area and are more propitious to the occurrence ofPassifloraspecies. It
is a region with high Passiflora species richness (L.B.
Freitas, unpublished data; Mondinet al., 2011), despite the
fact that cold periods are more common in this region than in forests located farther north.
Migration from typically tropical areas to areas with colder climatic conditions is not common and contributes to the accumulation of species in tropical regions (Wiens and Donoghue, 2004; Diniz-Filhoet al., 2007). It is the
en-vironmental suitability for taxa with tropical characteristics that forms the conditions that allow the occupation of these areas. This is also true for the model of diversity structure studied here. The genetic diversity found inPassiflora
spe-cies is also most likely derived from historical migrations through the `Portal de Torres’ as well as from the diversifi-cation of molecular types that are autochthonous and resil-ient in the South and remained conserved in tropical-like niches. In fact, both niche suitability and migration appear to be the dominant causes of spatial patterns of species turn-over and diversity of genetic markers in the region studied.
The suitability of this region for forest taxa is most likely a result of landscape patterns. The northwestern and eastern forest areas occupy the region surrounding the Bra-zilian plateau and are apparently dependent on the warm and moist characteristics of these large areas. Additionally, altitudes gradually increase toward the north and north-western areas of the Rio Grande do Sul state, reaching ap-proximately 900 meters above sea level in the north. In fact, altitude was the variable with the greatest contribution ac-cording to PCA (Table 1). The forests in the eastern sites (the area sampled for modelling genetic diversity) occur in lowlands and areas with lower altitudes in the slopes of the ÒSerra GeralÓ. There are species that occur in both eastern and western forests and other species that occur in only one of these areas (Moreiraet al., 2011), most likely reflecting
environmental and historical influences. In addition to the longitudinal diversity gradient, the variations with latitude are directly related to resistance to cold conditions.
The speciesP. caeruleais known for its hardiness in
the winter and resistance to temperate climates (Yockteng
et al., 2011). Recently, Sheth and Angert (2014)
demon-strated that species with high thermal tolerance also present high genetic diversity. In fact, the populations of P. caerulea, as well as those from P. tenuifila, exhibited
higher diversity indices for both markers thanP. miseraor P. capsularis, indeed the diversity indices were similar to
those obtained forP. actiniaHook. (subgenusPassiflora;
Teixeira et al., 2016) or P. contracta Vitta (subgenus Deidamioides; Cazéet al., 2016) from the Atlantic Forest.
In fact,P. caeruleais one of the species reaching the
south-ernmost areas of the distribution of the genus (Moreiraet al., 2011). Thus, the transition from tropical to temperate
areas might be highly propitious for molecular diversifica-tion inPassifloraspecies, and this pattern may be amplified
when breaks in the distribution are taken into account (Moreiraet al., 2011).
Stochasticity was cited as a relevant factor in deter-mining distribution range limits (Hampe and Petit, 2005) and our results complementarily indicate that conservatism is also relevant for genetic diversity in the spatial limits of niches. In fact, vertebrate taxa typical of South America have previously been reported to have high TNC rates (Diniz-Filhoet al., 2007; Smithet al., 2012). Similar pref-erences were also verified for several tropical plant taxa (Oliveira-Filhoet al., 2013; Hawkinset al., 2014). We also observed that thermal variation may cause population-level stochasticity (Hampe and Petit, 2005), and breaks could promote isolation of severalPassifloraspecies (Moreiraet al., 2011). In addition to these factors, we verified a high correlation with tropical climate, as shown here and in line with TNC, these might be the major determinants of the structure and genetic diversity inPassiflorapopulations at the southern limit of the species’ distribution.
Acknowledgments
The authors thank A.P. Lorenz-Lemke and N.O. Mega for their assistance in field collections and T. Magnus for providing DNA sequences. This work was supported by the Conselho Nacional de Desenvolvimento Científico e Tecnológico (CNPq), Coordenaço de Aperfeiçoamento de Pessoal de Nível Superior (CAPES), and Programa de Pós-Graduaço em Genética e Biologia Molecular - Univer-sidade Federal do Rio Grande do Sul (PPGBM-UFRGS). Work by J. A. F. Diniz-Filho and L. B. Freitas have been continuously supported by CNPq Productivity Grants and is developed in the context of National Institutes for Sci-ence and Technology (INCTs) in Ecology, Evolution and Biodiversity Conservation, supported by MCTIC/CNPq (proc. 465610/2014-5) and FAPEG.
References
Abrahamczyk S, Souto-Vilaós D and Renner SS (2014) Escape from extreme specialization: passionflowers, bats and the sword-billed hummingbird. Proc R Soc B-Biol Sci 281:20140888.
Angert AL (2009) The niche, limits to species’ distributions, and spatiotemporal variation in demography across the elevation ranges of two monkeyflowers. Proc Natl Acad Sci U S A 106:19693-19698.
Cazé ALR, Mäder G, Nunes TS, Queiroz LP, Oliveira G, Diniz-Filho JAF, Bonatto LB and Freitas LB (2016) Could refuge theory and rivers acting as barriers explain the genetic vari-ability distribution in the Atlantic Forest? Mol Phylogenet Evol 101:242-251.
Diniz-Filho JAF, Rangel TFLVB, Bini LM and Hawkins BA (2007) Macroevolutionary dynamics in environmental space and the latitudinal diversity gradient in New World birds. Proc R Soc Lond B Biol Sci 274:43-52.
Diniz-Filho JAF, Nabout JC, Telles MPC, Soares TN and Rangel TFLVB (2009) A review of techniques for spatial modelling in geographical, conservation and landscape genetics. Genet Mol Biol 32:203-211.
Dormann CF, McPherson JM, Arajo MB, Bivand R, Bolliger J, Carl J, Davies RG, Hirzel A, Jetz W, Kissling WD,et al.
(2007) Methods to account for spatial autocorrelation in the analysis of species distributional data: a review. Ecography 30:609-628.
Fortes AB (1959) Geografia Física do Rio Grande do Sul. Ed. Globo, Porto Alegre, 393 p.
Giudicelli GC, Mäder G and Freitas LB (2015) Efficiency of ITS sequences for DNA barcoding in Passiflora
(Passifloraceae). Int J Mol Sci 16:7289-7303.
Hammer Ø, Harper DAT and Ryan PD (2001) PAST: Paleon-tological Statistics Software Package for Education and Data Analysis. Palaeont Elect 4:4.
Hampe A and Petit RJ (2005) Conserving biodiversity under cli-mate change: The rear edge matters. Ecol Lett 8:461-467. Hawkins BA, Rueda M, Rangel TFLV, Field R, Diniz-Filho JAF
and Linder P (2014) Community phylogenetics at the bio-geographical scale: cold tolerance, niche conservatism and the structure of North American forests. J Biogeogr 41:23-38.
Hijmans RJ, Guarino L and Rojas E (2002) DIVA-GIS, A Geo-graphic Information System for the Analysis of Biodiversity Data. Manual. International Potato Center, Lima.
Klimeš L and Doleal J (2010) An experimental assessment of the upper elevational limit of flowering plants in the western Hi-malayas. Ecography 33:590-596.
Legendre P (1993) Spatial autocorrelation: Trouble or new para-digm? Ecology 74:1659-1673.
Librado P and Rozas J (2009) DnaSP version 5: A software for comprehensive analysis of DNA polymorphism data. Bioin-formatics 25:1451-1452.
Lorenz-Lemke AP, Muschner VC, Bonatto SL, Cervi AC, Sal-zano FM and Freitas LB (2005) Phylogeographic inferences concerning evolution of BrazilianPassiflora actiniaandP. elegans(Passifloraceae) based on ITS (nrDNA) variation.
Ann Bot 95:799-806.
Mäder G, Zamberlan PM, Fagundes NJR, Magnus T, Salzano FM, Bonatto SL and Freitas LB (2010) The use and limits of ITS data in the analysis of intraspecific variation in
PassifloraL. (Passifloraceae). Genet Mol Biol 33:99-108.
Miraldo A, Li S, Borregaard ML, Flórez-Rodriguez A, Gopala-krishnan S, Rizvanovic M, Wang Z, Rahbek C, Marske KA and Nogués-Bravo D (2016) An Anthropocene map of ge-netic diversity. Science 353:1532-1535.
Mondin CA, Cervi AC and Moreira GRP (2011) Sinopse das espécies dePassifloraL. (Passifloraceae) do Rio Grande do Sul, Brasil. Rev Bras Biocienc 9:3-27.
Moreira GRP, Ferrari A, Mondin CA and Cervi AC (2011) Pan-biogeographical analysis of passion vines at their southern limit of distribution in the Neotropics. Rev Bras Biocienc 9:28-40.
Muschner VC, Lorenz-Lemke AP, Vecchia M, Bonatto AL, Sal-zano FM and Freitas LB (2006) Differential organellar in-heritance inPassiflora‘s subgenera. Genetica 128:449-453 Muschner VC, Zamberlan PM, Bonatto SL and Freitas LB (2012)
Phylogeny, biogeography and divergence times in
Passiflora(Passifloraceae). Genet Mol Biol 35:1036-1043. Oliveira-Filho AT, Cardoso D, Schrire BD, Lewis GP,
Penning-ton RT, Brummer TJ and Lavin M (2013) Stability struc-tures tropical woody plant diversity more than seasonality: insights into the ecology of high legume-succulent-plant biodiversity. S Afr J Bot 89:42-57.
Papadopoulou A, Anastasiou I, Spagopoulou F, Stalimerou M, Terzopoulou S, Legakis A and Vogler AP (2011) Testing the species-genetic diversity correlation in the Aegean archipel-ago: Toward a haplotype-based macroecology? Am Nat 178:241-255.
Parmesan C (2006) Ecological and evolutionary responses to re-cent climate change. Annu Rev Ecol Evol Syst 37:637-669. Pinheiro F, Barros F, Palma-Silva C, Fay M, Lexer C and
Cozzo-lino S (2011) Phylogeography and genetic differentiation along the distributional range of the orchid Epidendrum fulgens: A Neotropical coastal species not restricted to gla-cial refugia. J Biogeogr 38:1923-1935.
Rambo B (1961) Migration routes of the south Brazilian rain for-est. Pesquisas 12:1-54.
Rangel TF, Diniz-Filho JAF and Bini LM (2010) SAM: A com-prehensive application for Spatial Analysis in Macroeco-logy. Ecography 33:46-50.
Ritter MR and Waechter JL (2004) Biogeografia do gênero Mika-nia Willd. (Asteraceae) no Rio Grande do Sul, Brasil. Acta Bot Bras 18:643-652.
Sheth SN and Angert AL (2014) The evolution of environmental tolerance and range size: A comparison of geographically restricted and widespread Mimulus. Evolution
68:2917-2931.
Sizling AL, Storch D and Keil P (2009) Rapoport’s rule, species tolerance, and the latitudinal diversity gradient: geometric considerations. Ecology 90:3575-3786.
Smith BT, Bryson Jr RW, Houston DD and Klicka J (2012) An asymmetry in niche conservatism contributes to the latitudi-nal species diversity gradient in New World vertebrates. Ecol Lett 15:1318-1325.
Stevens GC (1989) The latitudinal gradient in biogeographical range: How so many species coexist in the tropics. Am Nat 133:240-256.
Storchov H and Olson MS (2007) The architecture of the chlo-roplastpsbA-trnHnon-coding region in angiosperms. Plant
Sys Evol 268:235-256.
Tamura K, Stecher G, Peterson D, Filipski A and Kumar S (2013) MEGA6: Molecular Evolutionary Genetics Analysis Ver-sion 6.0. Mol Biol Evol 30:2725-2729.
Teixeira MC, Mäder G, Silva-Arias GA, Bonatto SL and Freitas LB (2016) Effects of past climate on Passiflora actinia
(Passifloraceae) populations and insights into future species management in the Brazilian Atlantic forest. Bot J Lin Soc 180:348-364.
Ulmer T and MacDougal JM (2004)Passiflora: Passion flowers
of the World. Timber Press, Portland, 430 p.
Yockteng R, d’Eeckenbrugge GC and Souza-Chies TT (2011)
Passiflora. In: Kole C (ed.) Wild Crop Relatives: Genomic and Breeding Resources Tropical and Subtropical Fruits. Springer, Berlin, pp 129-173.
Yotoko KSC, Dornelas MC, Togni PD, Fonseca TC, Salzano FM, Bonatto SL and Freitas LB (2011) Does variation in genome sizes reflect adaptive or neutral processes? New clues from
Passiflora. PLoS One 6:e18212.
Zonneveld M, Scheldeman X, Escribano P, Viruel MA, Damme PV, Garcia W, Tapia C, Romero J, Sigueñas M and Hor-maza JI (2012) Mapping genetic diversity of cherimoya (Annona cherimolaMill.): Application of spatial analysis for conservation and use of plant genetic resources. PLoS One 7:1-14.
Internet Resources
PAST: Paleontological statistics software package for education and data analysis, version 2.16. http://folk.uio.no/ohammer/past/ (January 1st, 2017).
DIVA-GIS version 7.5. http://www.diva-gis.org (January 1st,
2017).
WORDCLIM. http://www.worldclim.org/. (January 1st, 2017).
Supplementary material
The following online material is available for this article: Table S1 - Sampling information.
Figure S1 - State of Rio Grande do Sul in the context of South America.
Associate Editor: Fabrício Rodrigues dos Santos