Resumo
A Organização Mundial de Saúde (OMS) estimou no seu relatório de 2002 que cerca de 14% da carga da doença nos países mais ricos seja atribuível ao consu-mo de produtos de tabaco. As doenças mais relacio-nadas com o consumo de tabaco incluem um conjun-to de doenças cardiovasculares, neoplasias e doenças respiratórias.
Este artigo estima a carga da doença atribuível ao ta-baco em Portugal, tomando como base os dados das estatísticas demográficas e de saúde disponíveis para Portugal em 2005. A conclusão final da análise é que 11,7% das mortes em Portugal se podem atribuir ao consumo de tabaco. Se medirmos a carga da doença através dos anos de vida ajustados por incapacidade – disability adjusted life years (DALY) gerados pela mortalidade, as proporção da carga da doença
atribuí-Abstract
The World Health Organization’s (WHO) 2002 An-nual Report estimated that about 14% of the burden of disease in wealthier countries is attributable to smoking. Smoking related diseases include cardiovas-cular diseases, cancer and respiratory diseases. This paper presents an estimate of the burden of di-sease attributable to smoking in Portugal. The esti-mates are based on the Portuguese demographic and health statistics available for 2005. The most impor-tant conclusion of the analysis is that 11.7% of deaths in Portugal are attributable to smoking. If we use di-sability adjusted life years (DALYs) to measure the burden of disease, we find that 11.2% of death DALYs in Portugal is attributable to smoking. The gender distribution of this amount is very unequal; 15.4% of the male burden of disease and 17.7% of all male Carga da doença atribuível ao tabagismo em Portugal
The burden of disease attributable to smoking in Portugal
Recebido para publicação/received for publication: 09.03.26 Aceite para publicação/accepted for publication: 09.03.30 Margarida Borges
Miguel Gouveia João Costa
Luís dos Santos Pinheiro Sérgio Paulo
António Vaz Carneiro
Centro de Estudos de Medicina Baseada na Evidência, Faculdade de Medicina de Lisboa/Evidence-Based Medicine Centre for Studies, Lisbon University School of Medicine
Centro de Estudos Aplicados, Faculdade de Ciências Económicas e Empresariais, Universidade Católica Portuguesa/Universiade Católica Portuguesa Faculty of Economic and Business Science Centre for Applied Studies
Agradecemos o apoio dos Laboratórios Pfizer, Lda., e do INSA Ricardo Jorge pelo acesso aos dados do 4.º Inquérito Nacional de Saúde. Quaisquer erros ou omissões são da responsabilidade dos autores/We gratefully acknowledge the support of Pfizer Laboratories Lda and the INSA Ricardo Jorge for access to 4th National Health Enquiry data. Any errors or omissions are the sole responsibility of the authors
vel ao tabaco é 11,2%. A divisão entre sexos é muito desigual, já que 15,4% da carga da doença masculina e 17,7% das mortes são atribuíveis ao tabaco, mas apenas 4,9% da carga da doença feminina e 5,2% das mortes. Estes números para a mortalidade atribuível são mais elevados do que as estimativas anteriormen-te disponíveis para Portugal (Peto et al. 2006), as quais apontavam para 14% das mortes masculinas e apenas 0,9% das femininas.
O artigo apresenta estimativas sobre a carga da doença redutível, ou seja, as reduções de mortalidade e DALY que ocorreriam se os fumadores abandonassem o taba-gismo e passassem a experimentar o risco médio das populações de ex -fumadores, o qual é superior ao dos nunca fumadores mas inferior ao dos fumadores. As estimativas são que a carga da doença medida pelos DALY se reduziria em 5,8% (7,8% dos homens e 2,8% das mulheres) e que as mortes se reduziriam em 5,8% (8,5% homens e 2,9% mulheres).
O artigo inclui igualmente estimativas dos DALY perdidos por incapacidade. As doenças relacionadas com o tabagismo geraram 121 643 DALY, dos quais 72 126 (59%) são atribuíveis ao tabagismo e 12 417 (10%) são redutíveis.
Rev Port Pneumol 2009; XV (6): 951-1004
Palavras -chave: Tabagismo, doença cardiovascular, doença coronária, doença cerebrovascular, doenças respiratórias, anos de vida ajustados por incapacida-de, DALY, carga da doença.
deaths can be attributed to smoking, but only 4.9% of the female burden of disease and 5.2% of all fe-male deaths. These estimates are higher than death estimates previously available (Peto et al. 2006); 14% in men and only 0.9% in women.
This paper also presents estimates of the burden of reducible disease, that is, the reduction in mortal-ity and DALYs that would occur if all current smokers quit and thus experienced the mean risk of ex-smo kers, which is lower than for current smokers but typically not as low as for never-smok-ers. Our estimates are that the burden of disease would decrease by 5.8% (7.8% in men and 2.8% in women), and that deaths would decrease by 5.8% as well (with an 8.5% and 2.9% decrease in men and women, respectively).
The paper also includes estimates of the burden of disease ge nerated by smoking related disability. Smok-ing related illnesses generated 121,643 DALYs, 72,126 (59%) of which are attributable to smoking and 12,417 would be reducible if all smokers were to quit.
Rev Port Pneumol 2009; XV (6): 951-1004
Key-words: Tobacco consumption, cardiovascular disease, coronary heart disease, cerebrovascular di-sease, disability adjusted life years, DALYs, burden of disease.
Glossário de acrónimos
DALY – Anos de vida ajustados por incapa-cidade (disability adjusted life years) DPOC – Doença pulmonar obstrutiva
cró-nica
Abbreviations used
CDC – Centers for Disease Control and Prevention
DALY – Disability adjusted life years COPD – Chronic obstructive pulmonary disease
DRT – Doenças relacionadas com o taba-gismo
FAP – Fracção atribuível da população FRP – Fracção redutível da população OMS – Organização Mundial de Saúde
Introdução
Os estudos da carga da doença têm como objectivo quantificar num índice global os níveis de saúde de uma população e, em par-ticular, os efeitos de uma doença ou factor de risco. Neste estudo, a carga da doença é esti-mada através da componente atribuível ao tabagismo dos anos de vida perdidos prema-turamente ajustados pela incapacidade (no original DALY – disability adjusted life years), uma medida proposta e usada por institui-ções internacionais, como a Organização Mundial de Saúde (OMS)1 ou o Banco
Mundial2.
O consumo de tabaco é hoje uma das maio-res fontes de problemas de saúde nos países desenvolvidos. A OMS estimou recente-mente* que a nível mundial cerca de 8,8% das mortes e 4,1% dos DALY nos países de-senvolvidos é atribuível ao tabagismo, sendo este um factor de risco major para o cancro do pulmão, outras doenças oncológicas, do-enças cardiovasculares e dodo-enças respirató-rias**. Na medida em que a prevalência do tabagismo é mais elevada nos países ricos, as estimativas nesses países são ainda mais ele-vadas: no caso da Europa Ocidental, a OMS * World Health Report 2002: 64-65.
** Estas causas de morte e mortalidade não incluem ou-tros factores potencialmente relevantes, como sejam os mortos em incêndios gerados pelo uso de tabaco, mortes de não fumadores devido ao fumo passivo e o impacto do fumo na saúde materno-infantil.
SRT – Smoking related diseases PAF – Population attributable fraction FRP – Population reducible fraction SAMMEC – Smoking-attributable
morta-lity, morbidity, and economic costs WHO – World Health Organization
Introduction
Studies into the burden of disease aim to measure a population’s health costs on a global index and particularly to measure the effects of a disease or risk factor. In this study we estimate the burden of disease through the component attributable to Disability Adjusted Life Years (DALYs) caused by smoking. DALYs are used by such international institutions as the World Health Organization (WHO)1 or the World
Bank2.
Smoking is one of the leading causes of health problems in developed countries. The WHO recently estimated* a smoking related global rate of death of around 8.8% and a 4.1% rate of DALYs in developed countries. Smoking is a major risk factor for lung cancer, other cancers and cardiovascu-lar and respiratory diseases**. The higher rate of smoking found in wealthier coun-tries gives them even higher estimates. The WHO says that around 14% of the burden of disease in Western Europe is attributable to smoking.
We report the results of a study into the burden of smoking associated disease in
* World Health Report 2002: 64-65.
** These causes of death and mortality do not include other possiby relevant factors such as deaths in fires caused by smoking, deaths of non-smokers caused by passive smoking and the impact of smoking on mother and child health.
estima que cerca de 14% da carga da doença seja atribuível ao tabagismo.
Este artigo reporta os resultados de um estudo da carga da doença associada ao consumo de tabaco em Portugal, calibra-do para os dacalibra-dos disponíveis para o ano 2005. Apresentamos estimativas da carga da doença total das doenças relacionadas com o tabagismo e da carga da doença es-tatisticamente atribuível ao tabagismo. Por último apresentamos estimativas da carga da doença que seria evitável se todos os fumadores deixassem o consumo de ta-baco e passassem a ter os níveis de risco estimados para as actuais populações de ex -fumadores.
Metodologia
A medida da carga da doença
A fim de sumariar os problemas de saúde de uma população, foram desenvolvidos vários índices, sendo que os mais utilizados baseiam a unidade de medida da carga da doença nos anos de vida saudável que se perdem devido à doença ou à morte prematura. A carga da doença é estimada a partir dos indicadores de incidência, prevalência, duração e morta-lidade. De todos os índices disponíveis, destaca -se o índice baseado numa metodolo-gia preconizada pela Organização Mundial de Saúde e pelo Banco Mundial denomina-da DALY – disability adjusted life years – tra-duzida por anos de vida ajustados por in-capacidade e desenvolvida por Murray e co -autores3 -5. Os DALY foram já utilizados
em Portugal para medir a carga da doença atribuível à hipercolesterolemia6, numa
con-tribuição que contém igualmente informa-ção sobre a metodologia e alguns detalhes da
Portugal, in light of 2005 data. We show the estimated total burden of related diseases, with smoking and the burden of disease sta-tistically attributable to smoking. Finally we present estimates of the burden of reducible disease that would occur if all current smo-kers quit and so experienced instead the es-timated level of risk current ex-smokers do.
Methodology
Assessing the burden of disease
Several indexes have been designed to cap-ture populations’ health problems. Those most frequently used base a unit of mea-surement of disease burden on the years of healthy life lost to disease or premature death. The burden of disease is estimated using incidence, prevalence, duration and mortality indicators. Of available indexes we highlight that based on methodology recognised by the WHO and the World Bank, called Disability Adjusted Life Years (DALYs), developed by Murray et al.3-5.
DALYs have been used in Portugal to mea-sure the burden of disease attributable to hypercholesterolaemia6 and the
measure-ment also includes information on the methodology and some details of the scale’s construction. DALYs can be seen as a mea-sure of the amount of healthy life lost by a population due to premature death and the drop in quality of life stemming from the increased time spent living with disabilities.
Current and past prevalence of smoking The main source of data on the prevalence of smoking in Portugal is the National Health Enquiries, the most recent of which were in
construção da medida. Os DALY podem ser interpretados como uma medida do tempo de vida saudável perdido por uma população devido à morte prematura e à redução da qualidade de vida decorrente da morbilidade por esta aumentar o tempo vivido com inca-pacidades.
Prevalência corrente e passada do tabagismo
A principal fonte de informação sobre a preva-lência do tabagismo em Portugal é dada pelos inquéritos nacionais de saúde, sendo os inqué-ritos mais recentes o de 1998 e o de 2005, que designaremos por INS987 e INS058,
respecti-vamente. O Quadro I, construído com base em dados dos INS98 e INS05, sumaria a in-formação sobre prevalência de tabagismo na população portuguesa do continente, com quinze ou mais anos de idade.
Globalmente, a proporção de fumadores na população com 15 ou mais anos em 2005 era de 20,2%, uma descida de 0,3% face à taxa correspondente para 1998. Essa desci-da foi conseguidesci-da à custa de uma descidesci-da de 1,8% no tabagismo nos homens, já que nas mulheres ocorreu um aumento da taxa de 9,5% para 10,3%. Por outro lado, o Qua-dro I mostra que a proporção da população
1998 and 2005, known as INS987 and
INS058 in turn. Table I was designed using
data from the INS98 and INS05 bases and summarises information on the prevalence of smoking in the mainland Portuguese popula-tion aged fifteen years old or over.
The overall proportion in the population of smokers aged 15 years old or over in 2005 was 20.2%, a drop of 0.3% over 1998. This decrease was achieved due to a drop of 1.8% in smoking in men; there was an increase from 9.5% to 10.3% in smoking in women. Table I shows also that the proportion of never-smokers in the population decreased two percentage points to 64.1%, signifying an increase in ex-smokers of 2.3%. Put another way, while men tended to smoke less, the proportion of the population who smoked or who had smoked increased from 1998 to 2005.
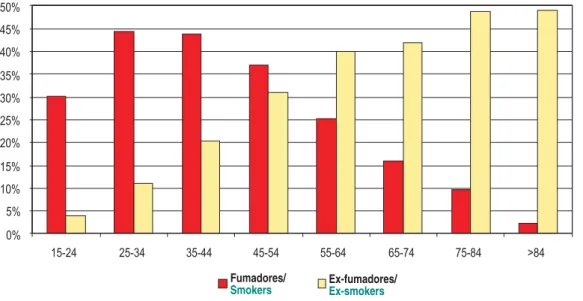
Figs. 1 and 2 shows the 2005 distribution of prevalence by gender and age group for men and women in turn. Rates in women are markedly lower and the lifecycle patterns underlying both figures are qualitatively dissimilar. Smoking increased in both gen-ders up until the 25-34 year old age group, uniformly decreasing after these ages. The prevalence of ex-smokers increased uni-formly with age in men, while in women it Quadro I – Prevalência do tabagismo na população
portu-guesa (Idade≥15) Nunca
fumadores Ex -fumadores
Fumadores actuais INS98 INS05 INS98 INS05 INS98 INS05 H 43,7% 42,5% 23,5% 26,5% 32,8% 31,0% M 86,1% 83,9% 4,4% 5,8% 9,5% 10,3% Total 66,1% 64,1% 13,4% 15,7% 20,5% 20,2%
Fonte: Inquéritos Nacionais de Saúde 1998/99 e 2005
Table I – Prevalence of smoking in the Portuguese popula-tion (age≥15)
Never-smokers Ex-smokers
Current smokers INS98 INS05 INS98 INS05 INS98 INS05
M 43.7% 42.5% 23.5% 26.5% 32.8% 31.0%
W 86.1% 83.9% 4.4% 5.8% 9.5% 10.3%
Total 66.1% 64.1% 13.4% 15.7% 20.5% 20.2% Source: National Health Enquiries 1998/99 and 2005
Fumadores/
Smokers Ex-fumadores/Ex-smokers
Fig. 1 – Prevalência de tabagismo por grupos etários: Homens
Fig. 1 – Smoking prevalence by age groups: Men
Fonte: Inquérito Nacional de Saúde 2005/Source: 2005 National Health Enquiry
Fumadores/
Smokers Ex-fumadores/Ex-smokers
Fig. 2 – Prevalência de tabagismo, actual e passado: Mulheres
Fig. 2 – Current and past smoking prevalence: Women
que nunca fumou se reduziu em dois pontos percentuais, para 64,1%. Isto significa ne-cessariamente que houve um aumento de 2,3% na categoria dos ex -fumadores. Ou seja, apesar de uma tendência masculina para fumar menos, a proporção da popula-ção que fuma ou já fumou cresceu entre 1998 e 2005.
A distribuição das prevalências por sexo e grupo etário em 2005 podem ser vistas nas Figs. 1 e 2 para homens e mulheres, respec-tivamente. As taxas de prevalência femini-nas são substancialmente inferiores e os pa-drões de ciclo de vida subjacentes a ambas as figuras não são qualitativamente semelhan-tes. Em ambos os sexos o tabagismo cresce até ao grupo etário dos 25 a 34 anos, decli-nando uniformemente a partir dessas ida-des, mas a prevalência do tabagismo passado (ex -fumador) é uniformente crescente com a idade nos homens, ao passo que nas mu-lheres decresce a partir de idades superiores a 34 anos, tal como o tabagismo.
Isso permite a interpretação de que ao longo da vida uma elevada proporção de homens, que nalguns grupos etários chega aos 65%, é fumador ou ex -fumador. No caso das mu-lheres, a situação é bem diferente, dado que a prevalência corrente ou passada de taba-gismo mal ultrapassa os 30% no grupo com maior prevalência de tabagismo ao longo da vida, entre os 35 e os 44 anos de idade. Como veremos adiante, as características epidemiológicas dos ex -fumadores são dis-tintas, quer dos fumadores correntes quer dos nunca fumadores. O facto de tal grupo estar a crescer como proporção da popula-ção vem reforçar a necessidade analítica de o estudar separadamente. Uma análise da car-ga da doença devida ao tabagismo só poderá ser exaustiva se contar, não apenas com o
decreased after the age of 34 years old, in line with smoking.
This allows the interpretation that throughout life a high proportion of men, in some age groups up to 65%, are smok-ers or ex-smoksmok-ers. The situation diffsmok-ers in women, as the current and past rate of smoking barely reaches over 30% in the group with the highest prevalence of smo-king throughout life, the 35-44 year old age group.
As we will shortly see, the epidemiologi-cal characteristics of ex-smokers are dis-tinct from those of smokers and never-smokers. The fact that this group is growing as a proportion of the popula-tion underlines the analytical need to study them as a case apart. An analysis of the smoking related burden of disease can only be deemed thorough if it deals with ex-smokers as well as smokers. Ex-smo kers would only be irrelevant if their condition was equal to that of never-smokers in terms of risk incurred. This is not the case, as the following section, dealing with the relative risk smokers and ex-smokers run of a set of relevant smok-ing related pathologies, shows.
Burden of disease and smoking
Once the choice of methodology to estimate burden of disease had been made and data on prevalence studied, it only remained to estimate smoking related DALYs.
The first step was selecting the most relevant smoking related pathologies and for which re-liable data existed. These pathologies and their codification in two International Disease Clas-sifications, ICD 9, Clinical Revised Modifica-tion, and ICD 10, are listed in Table II.
tabagismo corrente, mas também com o ta-bagismo passado. Este último só se poderia considerar irrelevante se a condição de ex--fumador fosse equivalente à de nunca fu-mador em termos dos riscos corridos. Não é esse o caso, como se mostra na secção se-guinte, que aborda os riscos relativos de fu-madores e ex -fufu-madores para um conjunto de patologias importantes associados ao consumo de tabaco.
Carga da doença e tabagismo
Uma vez explicitada a escolha feita quanto à metodologia de estimação da carga da doen-ça, e revistos os dados sobre a prevalência,
The first step in smoking related burden of disease analysis finished with estimating the burden of disease for these causes. This de-parture point allowed for both the evalua-tion of these specific diseases in the set of diseases and other causes of death which af-fect the Portuguese population.
The second step was establishing the quan-titative relationship between smoking and the pathologies in question. In order to do that, we used epidemiological concepts of relative risk and population attributable risk. Here relative risk (RR) is the ratio be-tween the risk of a disease or death for a population exposed to smoking and this risk for a non-exposed population. US Quadro II – Códigos da ICD 9 -CM e ICD 10 para doenças associadas ao tabagismo
ICD 9 -CM ICD 10 Neoplasias malignas
Lábios, cavidade oral, faringe 140 -149 C00 -C14
Esófago 150 C15
Estômago 151 C16
Pâncreas 157 C25
Laringe 161 C32
Traqueia, pulmões, brônquios 162 C33 -C34
Cólo do útero 180 C53
Rim 189.1 C64
Bexiga 188 C67
Doença cardiovascular Doença isquémica cardíaca
410– 414 I20 -I24 Adultos <65 anos
Adultos >65 anos
Outras doenças cardíacas 412 -414 I25
Aterosclerose 440 I70
Doença vascular cerebral
Adultos <65 anos 433 -434,
436 -438 I63 -I69 Adultos >65 anos
Doenças respiratórias
Pneumonia, gripe 480 -487 J10 -J18
Bronquite, enfi sema 490 -492 J40 -J43
Outra obstrução crónica das vias respiratórias 496 J44 -J46 Fonte: http://apps.nccd.cdc.gov/sammec/ e http://apps.nccd.cdc.gov/sammec/show_risk_data.asp
resta descrever como se estimam os DALY no caso do tabagismo.
O primeiro passo consiste em seleccionar as patologias mais relevantes associadas ao consumo de tabaco e para as quais possamos dispor de dados fiáveis. Estas patologias es-tão listadas no Quadro II, juntamente com a sua codificação pelas duas classificações internacionais das doenças, a ICD 9 – mo-dificação clínica revista, e a ICD 10.
O primeiro passo da análise relacionando a carga da doença com o tabagismo termina com a estimativa da carga da doença para estas causas, o que à partida permite igual-mente avaliar a importância relativa destas doenças específicas no conjunto de todas as
Table II – ICD 9-CM and ICD 10 codes for smoking related diseases
ICD 9-CM ICD 10
Malignant cancers
Lips, oral cavity, pharynx 140-149 C00-C14
Esophagus 150 C15
Stomach 151 C16
Pancreas 157 C25
Larynx 161 C32
Trachea, lungs, bronchi 162 C33-C34
Neck of the uterus 180 C53
Kidney 189.1 C64
Bladder 188 C67
Cardiovascular disease Ischaemic cardiac disease
410-414 I20-I24
Adults <65 anos Adults >65 anos
Other cardiac diseases 412-414 I25
Atherosclerosis 440 I70 Cerebrovascular disease Adults <65 years 433-434, 436-438 I63-I69 Adults >65 years Respiratory diseases Pneumonia, fl u 480-487 J10-J18 Bronchitis, emphysema 490-492 J40-J43
Other chronic respiratory airway obstruction diseases 496 J44-J46
Source:http://apps.nccd.cdc.gov/sammec/ and http://apps.nccd.cdc.gov/sammec/show_risk_data.asp
Center for Disease Control and Preven-tion (CDC)9 estimates for smokers and
ex-smo kers are given in Table III.
Table III shows that despite smoking cessation leading to substantial reduced risk of the abovementioned diseases, ex-smo kers are still at a higher risk than never-smokers. The relative risk ratio of smo kers versus ex-smokers ranges from one unit to 3.2 for the pathologies in question. Even if the relative risk is re-duced with the passing of time since smoking cessation and even if it can match that of never-smokers, on average this population has a greater aggregated risk than that of never-smokers.
Quadro III – Riscos relativos para fumadores e ex -fumadores
Riscos relativos Homens Muheres
Fumadores Ex -fumadores Fumadoras Ex -fumadoras Neoplasias malignas
Lábios, cavidade oral, faringe 10,89 3,4 5,08 2,29
Esófago 6,76 4,46 7,75 2,79
Estômago 1,96 1,47 1,36 1,32
Pâncreas 2,31 1,15 2,25 1,55
Laringe 14,6 6,34 13,02 5,16
Traqueia, pulmões, brônquios 23,26 8,7 12,69 4,53
Cólo do útero - - 1,59 1,14
Rim 2,72 1,73 1,29 1,05
Bexiga 3,27 2,09 2,22 1,89
Doenças cardiovasculares Doença isquémica cardíaca
Idades 35-64 2,8 1,64 3,08 1,32
Idades 65+ 1,51 1,21 1,6 1,2
Outras doenças cardíacas 1,78 1,22 1,49 1,14 Doenças vasculares cerebrais
Idades 35-64 3,27 1,04 4 1,3
Idades 65+ 1,63 1,04 1,49 1,03
Aterosclerose 2,44 1,33 1,83 1
Outras doenças arteriais 2,07 1,01 2,17 1,12 Doenças respiratórias
Pneumonia, gripe 1,75 1,36 2,17 1,1
Bronquite, enfi sema 17,1 15,64 12,04 11,77 Fonte: Centers for Disease Control and Prevention, Projecto “Smoking -Attributable Mortality, Morbidity, and Economic Costs (SAMMEC)”, http://apps.nccd.cdc.gov/sammec/show_risk_data.asp
doenças e outras causas de morte que afec-tam a população portuguesa.
O segundo passo consiste em estabelecer a rela-ção quantitativa entre o tabagismo e as patolo-gias indicadas. Para tal, iremos socorrer -nos dos conceitos epidemiológicos de risco relativo e de risco atribuível à população. Neste caso, o risco relativo (RR) é o rácio entre o risco de uma doença ou morte para uma população exposta ao hábito tabágico e esse risco para uma popu-lação não exposta. Estimativas do Center for
Disease Control and Prevention (CDC) dos
EUA9 para fumadores e ex -fumadores podem
ser encontradas no Quadro III.
Several characteristics of Table III bear high-lighting:
Although transitioning from a smoker to an ex-smoker substantially lowers relative risk, ex-smokers are still at a clearly higher risk than never-smokers.
Some diseases have an extremely high relative risk of above 10, such as lung cancer, cancer of the lips, oral cavity and pharynx, cancer of the larynx and respiratory diseases.
In addition to having a higher rate of smok-ing, men also incur greater relative risk. In 60% of the situations or pathologies stu died, men had higher RR than women, as is the
Table III – Relative risk for smokers and ex-smokers
Relative risk Men Women
Smokers Ex-smokers Smokers Ex-smokers
Malignant cancers
Lips, oral cavity, pharynx 10.89 3.4 5.08 2.29
Esophagus 6.76 4.46 7.75 2.79
Stomach 1.96 1.47 1.36 1.32
Pancreas 2.31 1.15 2.25 1.55
Larynx 14.6 6.34 13.02 5.16
Trachea, lungs, bronchi 23.26 8.7 12.69 4.53
Neck of the uterus - - 1.59 1.14
Kidney 2.72 1.73 1.29 1.05
Bladder 3.27 2.09 2.22 1.89
Cardiovascular disease Ischaemic cardiac disease
Ages 35-64 2.8 1.64 3.08 1.32
Ages >65 1.51 1.21 1.6 1.2
Other cardiac diseases 1.78 1.22 1.49 1.14
Cerebrovascular diseases
Ages 35-64 3.27 1.04 4 1.3 Ages >65 1.63 1.04 1.49 1.03
Atherosclerosis 2.44 1.33 1.83 1
Other arterial diseases 2.07 1.01 2.17 1.12
Respiratory diseases
Pneumonia, fl u 1.75 1.36 2.17 1.1
Bronchitis, emphysema 17.1 15.64 12.04 11.77
Source: Centers for Disease Control and Prevention, Project “Smoking-Attributable Mortality, Morbidity, and Economic Costs (SAMMEC)”, http://apps.nccd.cdc.gov/sammec/show_risk_data.asp
case in lung cancer and cancer of the lips, oral cavity and pharynx. This is true for both smokers and ex-smokers’ RR. Put another way, if both genders had an equal prevalence of smoking, men would have more smoking related diseases than women.
Transitioning from a smoker to an ex-smo ker has a differentiated impact on RR depending on pathologies and gender, but on average the reduction in RR is equal across the genders.
We now turn to the population attribu-table risk. In a simple case, when there is a sub-population with a risk factor, the formula which defines the fraction of O Quadro III mostra que apesar de o facto de
deixar de fumar conduzir a reduções substan-ciais nos riscos de contrair as doenças indicadas, os níveis de risco para os “ex -fumadores” conti-nuam mais elevados do que para os “nunca fu-madores.” O rácio dos riscos relativos de “fu-madores” versus “ex -fu“fu-madores” varia desde a unidade até 3,2 para as patologias considera-das. Mesmo que o risco relativo se vá reduzindo com o decorrer do tempo após deixar de fumar, e até possa convergir com o dos nunca fumado-res, em média esta população tem um risco agregado maior do que os nunca fumadores. Há várias características do Quadro III que vale a pena assinalar:
– A transição de fumador para ex -fumador diminui substancialmente os riscos relati-vos, mas em geral as populações de ex--fumadores continuam a ter riscos clara-mente superiores às populações de nunca fumadores;
– Há doenças em que os riscos relativos são extremamente elevados, acima de 10, como é o caso do cancro do pulmão, o cancro dos “lábios, cavidade oral e farin-ge”, o cancro da laringe e o caso das doen-ças respiratórias;
– Além dos homens terem maior prevalência do tabagismo, têm maiores riscos relativos. Em 60% das situações ou patologias estu-dadas, o RR dos homens é superior ao das mulheres, sendo este o caso em particular nos cancros do pulmão e dos lábios, cavi-dade oral e faringe. Essa diferença verifica--se quer para os riscos relativos de fumado-res quer de ex -fumadofumado-res. Ou seja, mesmo que a prevalência do tabagismo fosse igual em ambos os sexos, o tabagismo seria mais gerador de doenças nos homens;
– A transição de fumador para ex -fumador tem impacto diferenciado nos riscos rela-tivos de acordo com as patologias e o sexo, mas em média a redução dos risco relati-vos é igual entre sexos.
Vejamos agora o risco atribuível à popula-ção. No caso mais simples, quando há uma subpopulação com um factor de risco, a fór-mula que define a fracção dos casos de uma doença atribuível a esse factor de risco é bem conhecida10. A percentagem dos casos de
cada doença elimináveis se fosse anulado o factor de risco é dada pela fracção atribuí-vel da população (FAP). Ao níatribuí-vel mais simples, a FAP pode ser vista como uma re-dução percentual da incidência:
cases of a disease attributable to that risk factor is well known10. The percentage of
cases of each disease eliminable if the risk factor were nullified is expressed by the population attributable factor (PAF). At the simplest level the PAF can be seen as a percentage reduction of the inci-dence:
PAF= ,
where Ip is the incidence of a disease in the total population and Iu is the rate of those not exposed to the risk factor. It is possible to thus deduce a more useful form of this equation. Let P be the proportion of a target population which smokes. Let RR be the relative risk of a pathology or, that is,
RR= Ix/Iu, where Ix is the incidence of those
exposed. We can re-draw the PAF as
PAF= .
The PAF allows us to impute to smoking the fraction of the burden of disease associa-ted to each one of the abovementioned pa-thologies. For example, in the case of ischae-mic cardiac disease, the RR of the female population aged below 65 years old is 3.08. Setting a 10.3% rate of smoking thus gives a PAF of 17.6%. In other words, this is the proportion of the burden of ischaemic di-sease in women aged 65 years old which is imputable to smoking.
The above example is not directly valid in our case as it assumes the existence of only one risk factor. As already stated, smoking has two differentiated risk factors: being a smoker or an ex-smoker. As these risk fac-tors are by definition not the same, they give rise to two sub-populations. It is thus
FAP = ,
onde Ip é a incidência de uma doença na po-pulação total e Iu é a incidência entre os não expostos ao factor de risco. É possível dedu-zir um forma mais útil desta equação. Seja P a proporção de uma população-alvo fuma-dora. Seja RR o risco relativo de uma pato-logia ou seja RR= Ix/Iu, onde Ix é a
incidên-cia entre os expostos. Podemos reescrever a FAP de acordo com a equação
FAP= .
A FAP permite imputar ao tabagismo a frac-ção da carga da doença associada a cada uma das patologias referidas. Por exemplo, no caso da doença cardíaca isquémica, o risco relativo (RR) da população feminina fuma-dora com menos de 65 anos é de 3,08. Ad-mitindo uma prevalência do tabagismo de 10,3%, então a FAP é 17,6%, ou seja, esta é a proporção da carga da doença isquémica nas mulheres abaixo dos 65 anos imputável ao tabagismo.
O exemplo anterior não é directamente válido no presente caso, porque assume que existe apenas um factor de risco. Como já foi referido, no caso do tabagismo há dois factores de risco diferenciados: ser fumador e ser ex -fumador. Como os factores de risco não se sobrepõem, por definição, dão lugar a duas subpopulações, sendo possível deduzir a FAP neste caso:
FAP =
sendo Pf e RRf respectivamente a prevalên-cia e o risco relativo dos fumadores e Pex e RRex a prevalência e risco relativo dos ex--fumadores.
possible to describe the PAF in this case as:
PAF =
with Pf and RRf respectively the prevalence and the relative risk of smokers and Pex and RRex the prevalence and relative risk of ex-smokers.
Here the PAF can be seen as the proportion of the burden of disease which would vanish if there had never been smoking in Portu-gal, which represents a global average attrib-utable to smoking.
Further, it would also be more interesting to find an index which would provide an answer to the following question: “If all the current smokers in Portugal ceased smok-ing, what fraction of the burden of disease could be estimated to vanish as a result?” The difference between this and the above case is that instead of all RR being convert-ed into a unit, the RR of smokers converts into the RR of non-smokers. These last ob-viously do not experience any change in their risk. We can call this index the po-pulation reducible fraction (PRF) with the formula
PRF =
Smoking, evidence and reducible risk The concept of reducible risk has found scientific support in medical literature. The concept is understood as a lowering of the risk to health after smoking cessa-tion and expressed in the lessened severity of smoking related pathologies, their re-duced amount of complications or clinical
Neste caso, a FAP é interpretável como a proporção da carga da doença que desapare-ceria se nunca se tivesse fumado em Portu-gal, o que representa uma medida global da doença atribuível ao tabaco.
No entanto, adicionalmente, porventura até será mais interessante encontrar um índice que permita responder à seguinte questão:
Se todos os fumadores actuais em Portugal de-sistissem de fumar, qual a fracção da carga da doença que se estima iria desaparecer com essa transição? Naturalmente, a diferença face ao
caso anterior é que, em vez de todos os ris-cos relativos se converterem na unidade, te-mos que o risco relativo dos fumadores se converte no risco relativo dos ex -fumadores. Estes últimos naturalmente não sofrem qualquer alteração no seu risco. Designamos este índice por fracção redutível da popu-lação (FRP) e a fórmula correspondente é
FRP = .
Tabagismo, evidência e risco redutível O conceito de risco redutível, entendido como a diminuição do risco para a saúde após a cessação tabágica, traduzido pela redu-ção da gravidade das patologias associadas ao tabagismo, pelo menor número de complica-ções ou manifestacomplica-ções clínicas daquelas ou mesmo pela redução da mortalidade a elas associada, encontra suporte científico na lite-ratura médica. Neste sentido, fizemos uma breve revisão e análise dirigida aos principais grupos de patologias associadas ao consumo de tabaco, em particular à neoplasia do pul-mão, à patologia cardiovascular e à DPOC, identificando, embora de forma não exausti-va, publicações que fornecessem evidência científica para o conceito supramencionado.
manifes tations or even the drop in the mortality associated with them. Here we undertook a brief review and analysis of the main groups of smoking related pa-thologies, in particular lung cancer, car-diovascular pathology and COPD. We identified, albeit not exhaustively, publi-cations providing scientific evidence of the abovementioned concept.
Lung cancer
Of the literature which relates lung cancer with smoking, seeing clinical benefit to smoking cessation shown in a lower rate and reduced risk of developing lung cancer, we highlight:
– The Ebbert JO et al.11 analysis of a cohort
of 37 078 women over 14 years (47011 people/year), which quantified the rela-tive global risk of developing lung cancer as being 5.6 greater in smokers and ex-smokers than never-ex-smokers. This risk was cut by 1.0 after over 30 years of smok-ing cessation, to 3.7 for 21-30 years and 11.6 for 0-5 years, signalling a continuing risk but one decreasing for a long period following smoking cessation which tends to approach that of never-smokers.
– The Yun YH et al.12) prospective 6 year
study into 437,976 Korean subjects, which evaluated the absolute risk of developing smoking related lung cancer. It found that the rate of lung cancer was significantly higher in smokers (23.1/100 000 people/ year) than never-smokers (11.1/100 000 peo-ple/year) and ex-smokers (13.3/100 000 people/year). This result tallies with the documented significant reduced RR of de-veloping lung cancer found on smoking
Neoplasia do pulmão
De entre os trabalhos publicados que relacio-nam a neoplasia do pulmão com o tabagis-mo, verificando -se benefício clínico da cessa-ção tabágica, traduzido por diminuicessa-ção da incidência e redução do risco de desenvolvi-mento de neoplasia do pulmão, destacamos: – Ebbert JO et al 11, que, analisando uma
co-orte de 37 078 mulheres ao longo de 14 anos (47011 pessoas/ano), quantificou o ris-co relativo global para desenvolvimento de neoplasia do pulmão em fumadores e ex--fumadores em 5,6 quando comparado com nunca fumadores. Este risco reduz -se para 1,0 após mais de 30 anos de cessação tabági-ca, sendo de 3,7 para 21 -30 anos e 11,6 para 0 -5 anos, apontando para um risco mantido mas decrescente por período longo após a cessação que tendencialmente se aproxima da população nunca fumadora.
– Yun YH et al 12, num estudo prospectivo de
6 anos envolvendo 437 976 coreanos ava-liou o risco absoluto de desenvolvimento de neoplasia do pulmão relacionado com o ta-bagismo, verificando que a incidência da-quela patologia foi significativamente maior nos doentes fumadores (23,1/100 000 pes-soas/ano) quando comparada com os nunca fumadores e ex -fumadores (11,1 e 13,3, res-pectivamente). Este resultado está em linha com a documentação de significativa redu-ção do risco relativo de desenvolvimento da doença com a cessação tabágica (21,7 para os fumadores e 6,8 para os ex -fumadores).
Patologia cardiovascular
De entre os trabalhos publicados que rela-cionam a patologia cardiovascular, em parti-cular a doença coronária, com os hábitos
cessation; 21.7 for smokers and 6.8 for ex-smokers).
Cardiovascular pathology
Of the literature which relates cardiovascu-lar pathology, particucardiovascu-larly heart disease, with smoking, seeing clinical benefit to smoking cessation, shown in a reduced risk of coronary events and mortality, we high-light:
– Mohiuddin SM et al.13 who showed that
implementing an active smoking cessation programme in patients admitted to hospi-tal with acute cardiovascular disease led to a reduction in 2 years of 44% in relative risk of cardiac cause hospital admission and 77% in relative risk of cardiac cause death. This is in fact a drop of 9.2% in any cause mortality in this patient group. – Twardella T et al.14 who studied the risk of
secondary cardio-cerebrovascular events in 1029 patients following the first sign of heart disease, quantifying the hazard ratio (taken with reference to patients who con-tinued smoking) as 0.26 for non-smokers, 0.51 for ex-smokers and 0.42 for patients who were recent quitters. The study con-cluded that the impact of smoking cessa-tion on the long term prognosis of heart disease patients could be greater than that usually believed.
– Critchley JA and Capewell S15 who
con-ducted a systematic review of 20 studies involving 12 603 smokers with heart dis-ease (45% had cdis-eased smoking, 55% con-tinued smoking). They quantified the RR for any cause mortality and non-fatal acute myocardial infarction (AMI) in smoking cessation patients as 0.64 and
tabágicos, verificando -se benefício clínico da cessação tabágica traduzido por redução do risco de eventos coronários e da mortali-dade, destacamos:
– Mohiuddin SM et al.13 mostram que a
im-plementação de um programa activo de cessação tabágica em doentes internados por doença cardiovascular aguda condu-ziu a uma redução aos 2 anos de 44% e 77% no risco relativo de hospitalização e morte, respectivamente, por causa cardio-vascular. Este efeito traduziu -se na dimi-nuição de 9,2% na mortalidade por qual-quer causa neste grupo de doentes;
– Twardella T et al.14 estudaram o risco de
evento cardiocerebrovascular secundário em 1029 doentes após a primeira manifes-tação de doença coronária, quantificando o
hazard ratio (tomando como referência os
doentes que mantiveram os hábitos tabági-cos) em 0,26 para os não -fumadores; 0,51 para os ex -fumadores e 0,42 para os doen-tes que denominaram recent quitters, con-cluindo que o impacto da cessação tabágica no prognóstico a longo prazo dos doentes com doença coronária poderá ser maior do que o habitualmente considerado;
– Critchley JA e Capewell S15, numa revisão
sistemática de 20 estudos, envolvendo 12 603 fumadores com doença coronária (45% cessaram consumo de tabaco, 55% mantiveram hábitos tabágicos) quantifica o risco relativo para mortalidade por qualquer causa e enfarte agudo do miocárdio (EAM) não fatal nos doentes que cessaram o consu-mo em 0,64 e 0,68, respectivamente, to-mando como referência os doentes que mantiveram os hábitos tabágicos. Verifica-ram que a significativa redução dos riscos referidos é independente da idade e do sexo.
0.68 in turn, taken with reference to pa-tients who continued smoking. They found that the significant reduction in risk was irrespective of age and gender. – Godtfredsen NS et al.16 who in a study
with a prospective cohort of 19,423 pa-tients over a 22 year period (1976-1998), analysed the effects smoking reduction and smoking cessation had on the inci-dence of AMI. They found a reduction of 50% or 33% in smoking was not asso-ciated to a reduced risk of AMI (hazard ratios 1.14 and 1.06 in turn) as compared to patients who continued smoking. They further documented that smoking cessa-tion was associated with a 29% reduced risk of AMI (hazard ratio 0.71). This was similar to the risk of other coronary events found.
Chronic obstructive pulmonary disease (COPD)
Of the published studies relating COPD to smoking, finding a clinical benefit to smok-ing cessation shown by reduced lung func-tion degradafunc-tion and COPD hospital ad-mission and death, we highlight:
– The Scanlon PD et al.17 5 year follow-up
of 5887 patients, analysing the annual de-crease in FEV1 in three patient groups: patients with continued smoking cessa-tion; patients with intermittent cessation and patient-smokers. The authors found a reduced FEV1 of 31 and 43 mL/year in the first and second group respectively while in the third group this parameter was 62 mL/year. They concluded that the decrease in FEV1 was the most significant predictive factor for the evolution of lung
– Godtfredsen NS et al.16, num estudo de
coorte prospectivo, analisou os efeitos da redução e da cessação tabágica na incidên-cia de EAM, abrangendo um total de 19 423 doentes por um período de 22 anos (1976 -1998), verificando que a re-dução de 50% ou 33% do consumo de tabaco não estava associado à redução no risco de EAM (hazard ratios 1,14 e 1,06, respectivamente) quando comparados com os doentes que mantiveram os seus hábitos tabágicos. Documentou contudo que a cessação tabágica estava associada a uma redução do risco de EAM de 29% (hazard ratio: 0,71). Perfil semelhante foi encontrado relativamente ao risco de ou-tros eventos coronários.
Doença pulmonar obstrutiva crónica (DPOC)
De entre os trabalhos publicados que rela-cionam a DPOC com o tabagismo, verificando -se benefício clínico da cessação tabágica traduzido por redução da degrada-ção da fundegrada-ção pulmonar, da mortalidade e dos internamentos hospitalares por DPOC, destacamos:
– Scanlon PD et al.17, no seguimento por
um período de 5 anos de um grupo de 5887 doentes, analisou a redução anual do FEV1 em três grupos de doentes: doentes com cessação tabágica mantida; doentes com cessação intermitente e do-entes que mantêm o consumo regular de tabaco. Verificou que no 1.º e 2.º grupos a redução do FEV1 foi de 31 e 43 mL/ano, respectivamente, enquanto no 3.º aquele parâmetro foi de 62 mL/ano, concluindo que a redução do FEV1 corresponderia ao
disease after the change in smoking status after a year. They also found that the most significant predictive factor in the evolu-tion of lung funcevolu-tion was final smoking status, concluding that smoking cessation is always beneficial to smokers with signs of bronchial obstruction, irrespective of how heavy their former smoking habits were.
– The Pelkonen M et al.18 30 year
follow-up of 1711 men which analysed the de-crease in FEV1 in patient-never-smo kers; baseline ex-smoker patients; patients who stopped smoking during follow-up; intermittent smoking cessation pa-tients and papa-tients who continued smoking. They found a mean annual FEV1 decline over 30 years of 34.8 mL in the first group, similar to that seen in the ex-smokers and the smokers who stopped smoking during follow-up (36.1 mL and 35.8 mL in turn), in counterpoint to the mean value of 51.8 mL/year in patients who did not stop smoking. They further quantified the hazard ratio for all-cause mortality: a re-duction of around 30% in never-smo kers or ex-smokers and 20% for those who stopped smoking during follow-up or who had intermittent cessation, using patients who continued smoking during follow-up as a reference.
– The Pelkonen M et al.19 analysis of the
cu-mulative COPD rate over a 40 year fol-low-up which saw a 19% rate of COPD in continued smokers as opposed to 4.5% in ex-smokers, close to the 4% seen in never-smokers. They further documented an increased 2.4 years of mean survival in patients who ceased smoking as opposed to those who continued to smoke.
factor preditivo mais significativo da evo-lução da função pulmonar após a altera-ção do status tabágico após 1 ano. Adicio-nalmente, verificou que o factor preditivo mais significativo da evolução da função pulmonar seria o status tabágico final, concluindo que há sempre benefício na cessação tabágica para os fumadores com evidência de obstrução brônquica, inde-pendentemente da maior intensidade dos hábitos tabágicos prévios;
– Pelkonen M et al.18 que, no seguimento de
30 anos de um grupo de 1711 homens analisou a redução do FEV1 em doentes nunca fumadores; doentes ex -fumadores na baseline; doentes que cessaram o consu-mo durante o seguimento; doentes com interrupções intermitentes do consumo e doentes com consumo mantido; verificou que o declínio médio anual do FEV1 aos 30 anos foi de 34,8 mL no 1.º grupo, se-melhante ao verificado nos grupos de ex--fumadores e fumadores que cessaram o consumo durante o seguimento (36,1 mL e 35,8 mL, respectivamente), contrapon-do o valor médio de 51,8 mL/ano nos doentes em que não se verificou cessação tabágica. Adicionalmente, foi quantificado o hazard ratio para mortalidade de todas as causas, com uma redução de cerca 30% para os doentes nunca fumadores ou ex--fumadores, 20% para os casos em que a cessação tabágica ocorreu durante o segui-mento ou que foi intermitente, tendo como referência os doentes que mantive-ram os hábitos tabágicos ao longo do se-guimento;
– Pelkonen M et al.19, analisando a
incidên-cia cumulativa de DPOC num seguimen-to de 40 anos, verificou que a incidência de DPOC foi de 19% nos fumadores
con-– Godtfredsen NS et al.20 who studied the
hazard ratio for hospital admission for COPD in a population of 19 709 Danish patients with a mean follow-up of 14.4 years and, taking patients who continued to smoke as a reference, quantified that risk for ex-smokers as 0.30 (0.14 for non-smokers). Patients who cut down on smoking saw a risk of 0.93, showing the effective clinical advantage of smoking cessation and questioning the benefit of cutting down.
Using the past and present estimated smok-ing prevalence in Portugal (Table I) and the relative risk estimated by the CDC (Table III), Table IV shows the estimates for Portu-gal of the attributable and reducible fraction for the diseases in question.
The results shown in Table IV need three notes. Firstly, attention is drawn to the subs-tantial difference between the attributable and reducible fraction for the majority of smoking-related diseases. COPD (bronchi-tis, emphysema) is the extreme face of this, but on average around 56% of the burden of disease attributable to smoking could be eliminated; that is, it would vanish if all smokers stopped smoking.
The second thing to point out is the gender difference. In the majority of diseases the attributable and reducible fraction of men is over twice the corresponding fractions for women. We have seen that the rate of smoking in males is higher and that the relative risk is greater in men. In addition, the mean reducible fraction as a proportion of the attributable fraction is higher in women.
The third note concerns the evolution of the PAF and the PFR over time.
Compa-tínuos, contra 4,5% nos ex -fumadores, próxima dos 4% identificados nos nunca fumadores. Documentaram igualmente um aumento de 2,4 anos na sobrevivência mediana nos doentes que cessaram o con-sumo de tabaco, quando comparada com os que mantiveram os hábitos tabágicos; – Godtfredsen NS, et al.20, analisando o hazard
ratio para hospitalização por DPOC numa
população de 19 709 doentes dinamarque-ses, com um seguimento médio de 14,4 anos, verificaram que, tomando como refe-rência os doentes que mantiveram os hábitos tabágicos, a quantificação daquele risco para os ex -fumadores foi de 0,30 (0,14 para os não fumadores), sendo que, nos doentes em que se verificou uma redução do consumo, foi de 0,93, vincando a vantagem clínica efectiva da cessação tabágica e questionando o benefício da redução do consumo.
Partindo das estimativas das prevalências do tabagismo corrente e passado em Portugal apresentadas no Quadro I, bem como dos riscos relativos estimado pelo CDC e sentados no Quadro III, o Quadro IV apre-senta as estimativas para Portugal da fracção atribuível e da fracção redutível no país para o conjunto das doenças relevantes.
Os resultados no Quadro IV merecem três notas. A primeira é uma chamada de atenção para a diferença substancial entre a fracção atribuível e a fracção redutível para a genera-lidade das doenças relacionadas com o taba-gismo, situação cujo caso extremo é dado pela DPOC (bronquite, enfisema). Mesmo assim, em média, cerca de 56% da carga da doença atribuível ao tabagismo é eliminável, ou seja, desapareceria se todos os fumadores abandonassem o hábito. A segunda nota diz respeito à diferença entre sexos. Na maioria
ring the estimates in Table IV with the corres ponding estimates based on INS98 (not included for economy of space) shows a mean reduction of around 1% in the PAF and of about 5% in the PFR in men, mean-ing a reduced prevalence of smokmean-ing more than makes up for the increase in ex-smok-ing. In women the increased prevalence of smoking and ex-smoking gives an inverse evolution: a percentual increase of almost 9% in mean PAF and around 6% in mean PFR.
Death DALYs results
Burden of disease by overall mortality To obtain results on the burden of disease in the Portuguese population we chose to base the analysis on a recent year – 2005 – for which the data necessary for the analysis were available. Data on mortality came from the Institute of Statistics (IS) Health Statis-tics21 for 2005 for mainland Portugal, the
effective totals of which were taken from the estimates of the resident population22. We
used in particular death statistics by cause of death (ICD-10: list 2 – Overall Mortality – selected list – 80 causes) and gender, fol-lowed by age in years*.
* The base mortality data were taken from Table 9.11 of the 2005 Health Statistics and were complemented by information on malignant kidney tumours taken from Table 9.5 of the same statistics. The results are two data matrixes, one for each gender, with entries causes of death and age groups. Corrections were made to the re-sults as around 2.82% of the total deaths of women ap-pearing in the Tables are not classified together with age/ cause of death, with the same true for 2.72% of men. The final estimates for DALYs by cause of death are shown corrected for the abovementioned factors.
das doenças consideradas, a fracção atribuí-vel e a redutíatribuí-vel dos homens é mais do dobro das fracções correspondentes nas mulheres. Já vimos que tal situação radica, por um lado, na maior prevalência do tabagismo en-tre os homens e, por outro, em riscos relati-vos masculinos mais elevados. Adicional-mente, temos que a fracção redutível como proporção da fracção atribuível tem valores médios mais elevados nas mulheres. A tercei-ra nota diz respeito à evolução das FAP e FRP no tempo. Comparando as estimativas no Quadro IV com as estimativas
correspon-Table V shows the burden of total disease due to mortality in mainland Portugal for 2005.
Table V shows that in 2005 and due to pre-mature death 6493 DALYs were lost in mainland Portugal per each 100 000 inha-bitants. This figure shows progress in re-duced global burden of disease due to pre-mature death in that it is 5.4% lower than the corresponding estimate for 2000 (6862)23. If we compare this with the mean
WHO estimate for the richest countries in Europe in 2002, the numbers are 12.5% Quadro IV – Fracção atribuível e fracção redutível
Fracção atribuível da população %
Fracção redutível da população %
Homens Mulheres Homens Mulheres
Neoplasias malignas
Lábios, cavidade oral, faringe 78,7 33,1 49,4 19,2
Esófago 73,0 44,4 19,3 28,4
Estômago 29,7 5,3 10,7 0,4
Pâncreas 30,8 13,8 24,9 6,2
Laringe 84,9 59,7 38,6 32,7
Traqueia, pulmões e brônquios 89,9 58,5 45,4 34,9
Cólo do ùtero – 6,4 – 4,3
Rim e bacia da pélvis 42,1 3,2 17,8 2,4
Bexiga 49,8 15,1 18,4 2,9
Doenças cardiovasculares Doença isquémica cardíaca
Idades 35-64 42,1 18,9 20,8 14,7
Idades >65 17,6 6,8 7,7 3,8
Outras doenças cardíacas 23,1 5,5 13,4 3,4
Doenças vasculares cerebrais
Idades 35-64 41,7 24,6 40,3 21,0
Idades >65 17,1 5,0 15,2 4,5
Aterosclerose 34,8 7,9 22,4 7,9
Aneurisma da aorta 68,4 40,7 30,8 30,5
Outras doenças arteriais 25,1 11,3 24,6 9,6
Doenças respiratórias
Pneumonia e gripe 24,7 11,2 9,1 9,8
Bronquite e enfi sema 89,9 63,8 4,6 1,0
dentes baseadas no INS98 (não incluídas por razões de espaço), vemos que para os ho-mens ocorreu em média uma redução pro-porcional das FAP na ordem de 1% e uma redução das FRP na ordem dos 5%. Isso sig-nifica que a redução da prevalência do taba-gismo mais do que compensou o aumento do ex -tabagismo. Para as mulheres, e dado o aumento da prevalência do tabagismo e do ex -tabagismo, ocorreu uma evolução de sinal contrário, com um aumento percentual mé-dio das FAP de quase 9% e das FRP de cerca de 6%.
higher in that it has not yet converged with the European indicators in this area.
Table VI and Fig. 2 show the distribution of mortality and years lost by gender and age group.
The deaths by age and gender shown in Fig. 2 follow a familiar pattern, reflecting the population’s composition by gender and age groups as well as the specific mor-tality rates of each demographic subgroup. The burden of disease as measured by DALYs follows a slightly different pattern in that each death tends to produce many
Table IV – Attributable and reducible fraction
Attributable fraction of the population %
Reducible fraction of the population %
Men Women Men Women
Malignant cancers
Lips, oral cavity, pharynx 78.7 33.1 49.4 19.2
Esophagus 73.0 44.4 19.3 28.4
Stomach 29.7 5.3 10.7 0.4
Pancreas 30.8 13.8 24.9 6.2
Larynx 84.9 59.7 38.6 32.7
Trachea, lungs, bronchi 89.9 58.5 45.4 34.9
Neck of the uterus - 6.4 - 4.3
Kidney 42.1 3.2 17.8 2.4
Bladder 49.8 15.1 18.4 2.9
Cardiovascular disease Ischaemic cardiac disease
Ages 35–64 42.1 18.9 20.8 14.7
Ages >65 17.6 6.8 7.7 3.8
Other cardiac diseases 23.1 5.5 13.4 3.4
Cerebrovascular diseases
Ages 35–64 41.7 24.6 40.3 21.0 Ages >65 17.1 5.0 15.2 4.5
Atherosclerosis 34.8 7.9 22.4 7.9
Aorta aneurism 68.4 40.7 30.8 30.5
Other arterial diseases 25.1 11.3 24.6 9.6
Respiratory diseases
Pneumonia and fl u 24.7 11.2 9.1 9.8
Bronchitis and emphysema 89.9 63.8 4.6 1.0
Resultados para os DALY por morte
Carga da doença por mortalidade geral*
Para obtermos resultados respeitantes à carga da doença na população portuguesa escolhe-mos basear a análise num ano recente para o qual estivessem disponíveis os dados necessá-rios para a análise, tendo sido escolhido 2005. Os dados de base sobre mortalidade foram re-tirados das Estatísticas da Saúde do INE21 para
2005, as quais abrangem a população do con-tinente, cujos efectivos totais foram retirados das estimativas da população residente22. Em
particular usaram -se as estatísticas dos óbitos por causa de morte (CID -10: lista 2 – Morta-lidade geral – lista seleccionada – 80 causas) e sexo, segundo a idade (em anos)**.
* Ver http://www.who.int/healthinfo/statistics/gbdwho subregionyll2002.xls
** Os dados de base da mortalidade foram retirados do Quadro 9.11 das Estatísticas da Saúde de 2005 e com-plementados com informação sobre tumor maligno do rim retirada do Quadro 9.5 das mesmas estatísticas. Os resultados são duas matrizes de dados, uma para cada sexo, em que as entradas são as causas de morte e os gru-pos etários. Foram feitas correcções aos resultados porque cerca de 2,82% dos óbitos totais de mulheres indicados nos Qua dros não estão classificados conjuntamente por idade/causa de morte, verificando-se o mesmo para 2,72% dos homens. As estimativas finais dos DALY por causa de morte estão corrigidas pelos factores referidos.
more years lost the earlier it occurs**. In spite of this, there is a small burden of di-sease which originates in the first year of life due to the reduced rate of infant mor-tality. After the age of 15 the burden of di-sease grows, reaching a peak in the 70-74 year old age group in men and the 75-79 year old group in women. These peaks pre-cede the corresponding mortality peaks. Up until the age of 75 years old men bear a much heavier burden of disease than women. This inverts after the age of 75 mainly due to women making up the greater part of the population.**
One way to see the gender difference is to compare the mean DALYs by male death (7.1 years) with the same ratio for female mortality (5 years). A partial explanation for this difference is that women die on average at the age of 79 years while men on average die at the age of 72.
One final relevant point in capturing the difference between measuring the burden of * See http://www.who.int/healthinfo/statistics/gbdwho subregionyll2002.xls
** This affirmation is a simplification of the way the DALYs are calculated. There is an age-differentiated so-cial consideration as well as an application of the inter-temporal deduction to the years lost.
Quadro V – DALY por morte, 2005
Portugal Europa Ocidental DALY Totais DALY/ 100 000 h DALY/ 100 000 h Homens 396 207 8 119 6 966 Mulheres 258 447 4 968 4 627 Total 654 654 6 493 5 770
Fonte: Portugal – Estimativas dos autores baseados nas Estatísti-cas da Saúde e nas EstatístiEstatísti-cas Demográfi Estatísti-cas para 2005 do INE e nas estimativas revistas da OMS para a zona Europa A em 2002*
Table V – Death DALYs 2005
Portugal Western Europe Total DALYs DALYs /100 000 i DALYs /100 000 i Men 396 207 8 119 6 966 Women 258 447 4 968 4 627 Total 654 654 6 493 5 770
Source: Portugal – Authors’ estimates based on IS Health and De-mographic Statistics for 2005 and revised WHO statistics for the Europe A zone in 2002*
O Quadro V contém a estimativa da carga da doença total devido à mortalidade para Portugal continental no ano de 2005. De acordo com o Quadro V, em 2005 e devido à mortalidade prematura perderam -se em Por-tugal continental 6493 anos de vida ajustados por incapacidade por cada 100 000 habitantes. Este valor mostra que houve algum progresso na redução da carga global da doença por mor-te prematura, já que é 5,4% inferior à estimati-va correspondente para 2000 (6862)23. No
entanto, quando comparados com a estimativa da OMS para a média dos países mais ricos da Europa em 2002, os valores são 12,5% mais elevados, pelo que ainda não se convergiu com os indicadores europeus nesta área.
disease simply by mortality and by DALYs is that the burden of disease measured by DALYs is greater in relative terms than that measured by mortality for those aged up to 75 years old, with the picture inverting for those over 75.
Smoking, mortality and the related attributable and reducible burden of disease
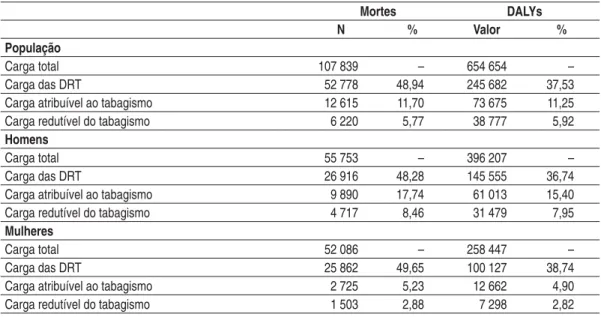
The first step in measuring the burden of disease caused by smoking is identifying the total proportion of the burden of disease created by smoking related diseases. Table VII shows these data for the population and
Table VI – Deaths and death DALYs by gender and age group in 2005 2005 Deaths DALY W M W M 0 187 199 6 087 6 455 1-4 32 65 1 106 2 240 5-9 38 61 1 391 2 224 10-14 32 53 1 175 1 937 15-19 76 218 2 697 7 694 20-24 117 351 3 906 11 638 25-29 151 441 4 643 13 443 30-34 231 711 6 428 19 559 35-39 326 887 8 080 21 650 40-44 484 1 266 10 522 26 959 45-49 721 1 593 13 533 29 073 50-54 957 2 119 15 246 32 481 55-59 1 250 2 737 16 562 34 387 60-64 1 670 3 278 17 940 32 730 65-69 2 887 5 053 24 320 38 602 70-74 4 779 7 223 30 204 40 402 75-79 7 856 9 232 35 316 36 171 80-84 10 885 9 714 32 902 25 466 85-89 9 842 6 314 19 034 10 488 90-94 6 995 3 420 5 914 2 267 95 + 2 570 818 1 441 340
Source: See Table V
Quadro VI – Óbitos e DALY por morte por sexo e idade em 2005 2005 Óbitos DALY M H M H 0 187 199 6 087 6 455 1 -4 32 65 1 106 2 240 5 -9 38 61 1 391 2 224 10 -14 32 53 1 175 1 937 15 -19 76 218 2 697 7 694 20 -24 117 351 3 906 11 638 25 -29 151 441 4 643 13 443 30 -34 231 711 6 428 19 559 35 -39 326 887 8 080 21 650 40 -44 484 1 266 10 522 26 959 45 -49 721 1 593 13 533 29 073 50 -54 957 2 119 15 246 32 481 55 -59 1 250 2 737 16 562 34 387 60 -64 1 670 3 278 17 940 32 730 65 -69 2 887 5 053 24 320 38 602 70 -74 4 779 7 223 30 204 40 402 75 -79 7 856 9 232 35 316 36 171 80 -84 10 885 9 714 32 902 25 466 85 -89 9 842 6 314 19 034 10 488 90 -94 6 995 3 420 5 914 2 267 95 e + 2 570 818 1 441 340
by gender. We see that the set of diseases identified in Table II is the cause of around 49% of the deaths in mainland Portugal 2005 and of 36% of the DALYs. The pro-portions are around one to two per cent lower in men than women.
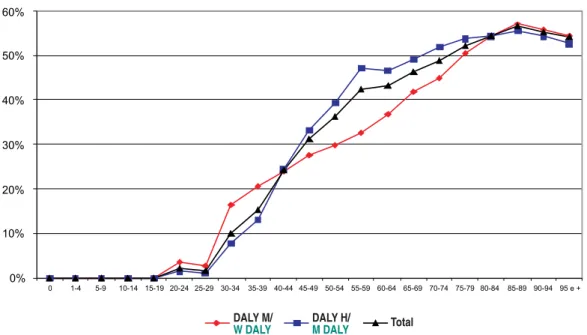
Fig. 3 shows the distribution by gender and age group of the DALYs caused by smoking related diseases.
Fig. 4 shows the nature of the relationship between the burden of disease by age and that due to smoking related diseases. Until the age of 30 years old the proportion of bur-den of disease caused by those diseases is se-condary, growing in importance with age until the age of 85 years old, the age at which almost 60% of the burden of disease is caused by smoking related diseases (Table II). Even when smoking related diseases (SRD) are concerned, only part of their burden of disease can be imputed to smoking. Applying the PAF shown in Table IV to the mortality data by cause of death estimates the burden of disease attributable to smoking, as Table VII shows. 11.7% deaths (12 615) and 11.2% DALYs (73 675 years) for the total population are attributable to smoking. Fig. 6 shows the distribution of attributable and reducible DALYs by gender and age groups.
The total numbers of attributable burden are not evenly distributed between the genders; 17.7% of male deaths and 15.4% of male DALYs are attributable to smok-ing, while the female numbers are 5.2% and 4.9% in turn. These attributable mortality numbers are higher than esti-mates previously available for Portugal*.
* Peto R, Lopez AD, Boreham J, Thun M. Mortality from smoking in developed countries 1950−2000 (2nd Ed,
2006), accessed at www.deathsfromsmoking.net
A distribuição da mortalidade e dos anos per-didos por sexo e por grupo etário encontram--se no Quadro VI e está ilustrada na Fig. 2. Os óbitos por idade e sexo representados na Fig. 2 seguem um padrão conhecido, reflec-tindo a composição da população por sexo e por grupos etários, bem como as taxas de mortalidade específicas de cada subgrupo de-mográfico. A carga da doença, medida pelos DALY, segue um padrão ligeiramente dife-rente, já que uma morte tende a produzir tan-to mais anos perdidos quantan-to mais precoce-mente ocorre*. Apesar disso, há uma carga pequena da doença com origem no primeiro ano de vida devido às reduzidas taxas de mor-talidade infantil. A partir dos 15 anos, a carga da doença vais crescendo, atingindo um má-ximo no grupo dos 70 a 74 anos para os ho-mens e no dos 75 a 79 anos para as mulheres, picos que antecedem os correspondentes pi-cos de mortalidade. Até aos 75 anos a carga da doença suportada pelos homens é substan-cialmente mais elevadas que a das mulheres, invertendo -se a situação a partir dessa idade, muito fruto da composição maioritariamente feminina da população.
Uma forma de ver a diferença entre sexos é comparar o número médio de DALY por morte masculina (7,1 anos) com o mesmo rácio para a mortalidade feminina (5 anos). Esta diferença decorre em parte de as mu-lheres morrerem em média com 79 anos, ao passo que a idade média do óbito nos ho-mens é de 72 anos.
Um último aspecto relevante para capturar-mos a diferença entre medir a carga da * Esta afirmação é uma simplificação, na medida em que no cálculo dos DALY há uma ponderação social diferen-ciada por idades, bem como a aplicação de um desconto intertemporal aplicado aos anos perdidos.
doença simplesmente pela mortalidade e medir pelos DALY é que, em termos relati-vos, a carga da doença medida por DALY é superior à medida pela mortalidade para os grupos demográficos antes dos 75 anos, invertendo -se a posição relativa em idades superiores a esse limiar.
Tabagismo, mortalidade e carga da doença relacionadas, atribuíveis e redutíveis
Um primeiro passo na quantificação da car-ga da doença devida ao tabagismo é identi-ficar a proporção da carga da doença total gerada pelas doenças relacionadas com o ta-bagismo. O Quadro VII apresenta esses da-dos para a população e por sexo. Nele ve-mos que o conjunto de doenças identificado no Quadro II é responsável por cerca de 49% da mortes ocorridas em 2005 no con-tinente e por 36% dos DALY, sendo as res-pectivas proporções cerca de um a dois por cento mais baixas nos homens do que nas mulheres.
A distribuição por sexo e grupos etários dos DALY gerados pelas doenças relacionadas com o tabaco pode ser visto na Fig. 3. A Fig. 4 elucida a natureza da relação entre a carga da doença por idade e a carga da doença gerada por doenças relacionadas com o tabagismo. Até aos 30 anos a propor-ção da carga da doença gerada por tais doenças é secundária, crescendo a sua im-portância com a idade até aos 85 anos, altu-ra em que quase 60% da carga da doença é gerada pelas doenças relacionados com o ta-baco (listadas no Quadro II).
Naturalmente, mesmo para as doenças re-lacionadas com o tabagismo (DRT), só parte da respectiva carga da doença pode ser
These cite 14% of male deaths and only 0.9% of female. Men have 78.4% morta-lity and 82.8% DALYs attributable to smoking. Turning to age groups, redu-cible DALYs are centred around the 40-80 year olds and male reducible DALYs tend to peak at the age of 50 years old, with a secondary peak at 70 years of age, unlike the female reducible DALYs which peak at the age of 75.
Note that the concept of attributable bur-den of disease, while a correct measure of the burden of disease due to smoking, is in-adequate for measuring the maximum gain made by intervention measures as these have to take the population’s history of smoking as acquired data.
Table VII shows the estimated reducible burden of disease, or, in other words, the mortality and DALYs which could be elimi-nated if all smokers stopped smoking. These data are relevant in that the reducible bur-den of disease gives us the maximum amount of health gains which could be made by health intervention measures, conditioned by the past behaviour of the population in question. Estimates for Portugal 2005 show that deaths and DALYs would be reduced by around 5.8% if smokers ceased smoking. This translates as over 6200 deaths and 38 000 DALYs.
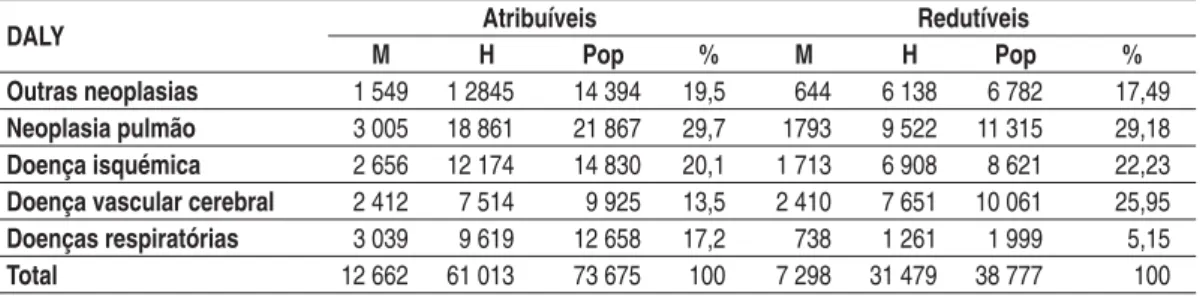
It is relevant to know the amount of at-tributable and reducible burden of disease by groups of diseases. Table VIII shows this.
Lung cancer is clearly the most significant diseases in terms of numbers in both attri-butable and reducible burden of disease. The weight of attributable and reducible burden of disease differs for the other di-seases. Fig. 6 shows the distribution of the