Microstructures of Scleractinian Corals
Rui J. M. Rocha1*, Ana M. B. Silva2, M. Helena Vaz Fernandes2, Igor C. S. Cruz3, Rui Rosa4, Ricardo Calado1
1 Departamento de Biologia & CESAM, Universidade de Aveiro, Campus Universita´rio de Santiago, Aveiro, Portugal, 2 Departamento de Engenharia dos Materiais e Ceraˆmica/CICECO, Universidade de Aveiro, Aveiro, Portugal,3 Laborato´rio de Ecologia Marinha Instituto de Biologia Roberto Alcaˆntara Gomes Universidade do Estado do Rio de Janeiro, Rio de Janeiro, Rio de Janeiro, Brasil,4 Laborato´rio Marı´timo da Guia, Centro de Oceanografia, Faculdade de Cieˆncias da Universidade de Lisboa, Cascais, Portugal
Abstract
The morphological plasticity of scleractinian corals can be influenced by numerous factors in their natural environment. However, it is difficult to identify in situ the relative influence of a single biotic or abiotic factor, due to potential interactions between them. Light is considered as a major factor affecting coral skeleton morphology, due to their symbiotic relation with photosynthetic zooxanthellae. Nonetheless, most studies addressing the importance of light on coral morphological plasticity have focused on photosynthetically active radiation (PAR) intensity, with the effect of light spectra remaining largely unknown. The present study evaluated how different light spectra affect the skeleton macro- and microstructures in two coral species (Acropora formosa sensu Veron (2000) and Stylophora pistillata) maintained under controlled laboratory conditions. We tested the effect of three light treatments with the same PAR but with a distinct spectral emission: 1) T5 fluorescent lamps with blue emission; 2) Light Emitting Diodes (LED) with predominantly blue emission; and 3) Light Emitting Plasma (LEP) with full spectra emission. To exclude potential bias generated by genetic variability, the experiment was performed with clonal fragments for both species. After 6 months of experiment, it was possible to detect in coral fragments of both species exposed to different light spectra significant differences in morphometry (e.g., distance among corallites, corallite diameter, and theca thickness), as well as in the organization of their skeleton microstructure. The variability found in the skeleton macro- and microstructures of clonal organisms points to the potential pitfalls associated with the exclusive use of morphometry on coral taxonomy. Moreover, the identification of a single factor influencing the morphology of coral skeletons is relevant for coral aquaculture and can allow the optimization of reef restoration efforts. Citation: Rocha RJM, Silva AMB, Fernandes MHV, Cruz ICS, Rosa R, et al. (2014) Contrasting Light Spectra Constrain the Macro and Microstructures of Scleractinian Corals. PLoS ONE 9(8): e105863. doi:10.1371/journal.pone.0105863
Editor: Peter Alan Todd, National University of Singapore, United States of America Received December 5, 2013; Accepted July 30, 2014; Published August 29, 2014
Copyright: ß 2014 Rocha et al. This is an open access article distributed under the terms of the Creative Commons Attribution License, which permits unrestricted use, distribution, and reproduction in any medium, provided the original author and source are credited.
Funding: This research was not funded by any agency or project. Only RJMR was supported by a grant financed by project ‘‘Sustainable Use of Marine Resources MARES’’ (CENTRO 07 ST24 FEDER 002033), co funded by QREN, Mais Centro e Programa Operacional Regional do Centro, Portugal and European Union/ European Regional Development Fund. The funders had no role in the study design, data collection and analysis, decision to publish, or preparation of the manuscript.
Competing Interests: The authors have declared that no competing interests exist. * Email: [email protected]
Introduction
The morphological variability of scleractinian corals is well documented in the literature, with numerous descriptions on general shifts in colonies growth shapes [1 5]. Several studies have also described shifts in more specific features of corals skeletons, such as in corallite structure (e.g. septal length, columellar diameter, number of septa, theca thickness) or distance between corallites [5,6]. This remarkable variability in scleractinian corals skeleton morphology is somehow reflected in their complex taxonomy [7]. Therefore, the analysis of interpopulational, intrapopulational and intracolonial levels of variation has been advocated by researchers to support reliable taxonomic identifi cations [5]. In this way, it is not surprising that morphometric analyses, at distinct levels of morphologic variation, can be a useful tool for a range of disciplines, such as physiology, ecology, biology, taxonomy, or phylogeny, that may contribute to enhance our understanding on the adaptation mechanisms, gene connectivity and habitat selection of reef building corals [6].
The aragonite (CaCO3) macrostructures forming the skeleton of
scleractinian corals are formed under a layer of organic material secreted by cells from basal ectoderm of coral polyps [8]. Aragonite crystals precipitate in a hydro organic gel to form microstructural units, recognized as crystallites (which form the centers of calcification) and fibers (a composite of biocrystals in which organic compounds and mineral ions interact) [8 12]. While several models of biomineralization have been proposed in the last years, the remarkable diversity of corals has impaired the acceptance of a single model of skeletal growth [10].
The morphology of scleractinian corals can be influenced by numerous factors in their natural environment [5,13]. Intraspecific morphological variations among scleractinian corals have been associated with genetic variability [14,15], competition for space [16,17], concentration of nutrients in the water [18,19], and with the influence of a range of environmental factors, such as light [20 22], depth and pressure [20], water movement [23,24] and sedimentation rates [21,24,25]. Nonetheless, due to potential interactions between these factors, it is difficult to identifyin situ the relative influence of each one of them.
Due to these complex interactions, only a few experiments have so far successfully identified single parameters affecting phenotypic plasticity in scleractinian corals. The common procedures on these experiments consist in moving colonies to new environments and register morphological shifts over time [26]. This procedure is also used in experiments that aim to identify plasticity and variation among genotypes, namely by using clonal organisms to eliminate genetic variability [13,17,21,27,28]. Therefore, it becomes evident that the only way to reliably control these variables is to perform experimentsex situ under controlled conditions [22].
The identification of parameters that may influence skeletal macro and microstructures organization may substantially im prove coral production.
Due to the symbiotic relation of several scleractinian corals with dinoflagellates of genus Symbiodinium, commonly termed as zooxanthellae, several studies have addressed the importance of light in coral morphology, macrostructure organization and microstructure architecture. For example, a study performed by Todd et al. [22] suggested a relationship betweenFavia speciosa and Diploastrea heliopora corallite morphology and light, as corallites expanded, extended and deepened under high light conditions. Another modeling study with Galaxea fascicularis showed that corallite width and distance among corallites decreased with the amount of incident light, while corallite height increased with the amount of light [29]. These results suggest an optimization in corallite size and distribution to promote heterotrophic nutrition or zooxanthellae photosynthesis under low or high light conditions, respectively [29]. Most studies performed so far on the effects of light on coral morphology, either in situ or ex situ, have addressed the role of Photosynthetically Active Radiation (PAR) intensity. Curiously, only a few studies performedex situ under artificial illumination have evidenced how contrasting light spectra with an identical PAR can significantly affect coral growth [30,31]. Given that light spectra can condition the growth rate of corals, the protein content of their soft tissues and the photochemical performance of endosymbiotic zooxan thellae [30], the present study aimed to evaluate the effect of different light spectra (emitting the same PAR) in the skeletal morphology (at a macro and microstructural level) of two symbiotic scleractinian coral species, Acropora formosa and Stylophora pistillata, maintained under controlled laboratory conditions.
Materials and Methods
Coral husbandry and fragmentation
One wild colony ofAcropora formosa (,200 mm in diameter) and one wild colony of Stylophora pistillata (,150 mm in diameter) from Indonesia, termed from now as mother colonies, were acquired in a wholesale supplier operating in Portugal (solely the information on the country of origin was made available by the supplier [32]). Mother colonies were kept for 1 month in a 750 L tank (2 m60.8 m60.5 m), integrated in a 8000 L recirculating system operated with filtered (20mm cartridge) natural seawater. The filtration system was composed of four protein skimmers (two AP 903 Deltec (Germany) and two 400 36F5000 H&S (Ger many)), with biological filtration being promoted by approximately 150 kg of live rock and 60 kg of aragonite sand (forming a deep sand bed with 10 cm depth). Water temperature was maintained by a Profilux II GHL (Germany) that controls both water heating (through titanium heaters) and cooling (through an Eco Cooler Deltec, Germany). The filtration tank was also equipped with a calcium reactor PF 1001 Deltec (Germany). Water turnover in the tank holding the mother colonies through the filtration system was
approximately 10 times the tank volume per hour (<7500 L h 1). Additionally, the tank was also equipped with four circulation pumps (Turbelle Stream 6205, Tunze, Germany).
Water parameters were maintained as follows: salinity 3560.5, temperature 2660.5uC, TAN 0.0560.01 mg L 1
, NO2 N 0.0360.01 mg L 1, NO3 N 0.160.1 mg L 1 , PO4 3 P 0.0160.001 mg L 1, pH 8.260.2, alkalinity 3.9060.20 mEq L 1, Ca2+ 430620 mg L 1, Mg2+ 1300620 mg L 1. The illumination in the coral tank was provided by T5 fluorescent lamps (Sfiligoi Stealth 12680W), delivering a PAR of 250620mmol quanta m 2 s 1 at the level of the colonies, with a photoperiod of 12 hours light. PAR values were measured with a Quantum Flux meter (Apogee MQ 200, USA) by placing a submergible sensor at the level of coral colonies.
After 1 month of acclimation, both mother colonies were fragmented using sterilized cutting pliers, producing 30 similar sized fragments (approximately 4 cm length60.4 cm diameter for A. formosa and 1 cm length60.7 cm diameter for S. pistillata) per mother colony. Coral fragments, produced from the terminal branches of each mother colony, were individually attached to a labeled plastic coral stand (Coral Cradle, UK) with epoxy resin (Aqua Medic GmbH, Bissendorf, Germany). Coral fragments of both species were stocked in the same tank of the mother colonies during one week, before the beginning of the experimental treatments (see below).
Experimental design
Experimental treatments were performed during 6 months, using 3 different light sources with distinct spectra in the visible light wave lengths (Figure 1): 1) T5 fluorescent lamps with blue emission (T5); 2) Light Emitting Diodes (LED) with predominantly blue emission; and 3) Light Emitting Plasma (LEP) with full visible spectra emission. Reflectance spectra of lights used in the experimental treatments were measured at Ti (in the beginning of the experiment) and at Tf (in the end of the experiment) over a 340 840 nm bandwidth, with a spectral resolution of 0.33 nm, using a USB2000 spectrometer (USB2000 VIS NIR, grating #3, Ocean Optics, USA) connected to 400mm diameter fiberoptic (QP400 2 VIS/NIR BX, Ocean Optics). The fiberoptic was maintained perpendicular to a reference white panel surface (WS 1 SL Spectralon Reference Standart, Ocean Optics) positioned under the light source, at a constant distance, to measure the reflected light spectra.
Light treatments were tested in 750 L experimental glass tanks, similar to the tank described above for mother colonies, with the same water flow and turnover, and connected to the same 8000 L culture system where mother colonies were stocked, in order to avoid any potential artifacts promoted by differences in water chemistry or water movement.
Each experimental tank was illuminated from above with the same PAR light intensity (250620mmol quanta m 2s 1). PAR values were measured every week during the experiment with a Quantum Flux meter (Apogee MQ 200, USA) with a submerg ible sensor at the level of coral fragments. The distance between each light system and water surface was adjusted to have the same light PAR at the coral fragments level in all treatments. Lighting systems were operated with a photoperiod of 12 h light : 12 h dark. T5 treatment was performed employing T5 fluorescent lamps (Sfiligoi Stealth 12680 W, Italy), mimicking the illumina tion employed in the tank where mother colonies were stocked. The LED treatment was performed using an 8648 W NEPTUNE LED Reef Lighting systems (Spain), while the LEP treatment was performed under a Sfiligoi Vision Dual system, Italy (26260W).
Twenty seven fragments from each species were randomly selected from the initial pool of 30 fragments and distributed by the stocking tanks employed for each light spectra treatment (n 9 for each light treatment per coral species). Coral stands were fixed on white egg crate, to allow all coral fragments to be placed at the same water depth (<0.3 m).
Water parameters were kept as described above for mother colonies. Partial water changes using filtered seawater (10% of total experimental system volume) were performed every other week.
Sample preparation and porosity measurement
After 6 months of experiment the terminal branches of coral fragments were removed with sterilized cutting pliers to guarantee the utilization of coral skeleton grown after the beginning of light treatments. Fragments were identified and immersed in a 2% sodium hypochlorite solution for 12 18 h (depending on the size) to remove all the organic matter from the skeleton, and rinsed thoroughly with deionized water. After this process, the skeletons of coral fragments were dried and porosity was determined applying the ‘‘Archimedes’’ method [33]. Porosity was calculated as: x (%) ((ww dw)/(ww sw))6100, with ww, dw and sw
representing the wet weight, dry weight and submerged weight, respectively.
Sample evaluation by SEM
Samples were dried and placed on aluminum supports and covered with a conductive thin film of carbon deposition. Samples surface and morphology modification were followed by high resolution Scanning Electron Microscopy (SEM) in a HITACHI SU 70 equipped with a Bruker EDS (Energy Dispersive System) detector at an acceleration voltage of 15 keV (at RNME Pole of University of Aveiro, Portugal).
Morphometric analyses
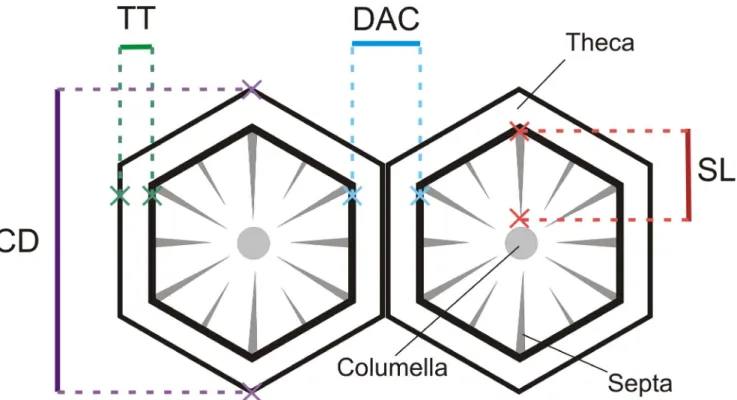
Morphometrics of both species were performed using the software CPCe 3.6 (Coral Point Count with Excel extensions) to analyze the images obtained with the SEM. The measurements of distance among corallites (DAC) and corallite diameter (CD, based on the mean of two greater diameters) were performed in 7 corallites of each coral fragment, for both species (n 63; 7 corallites 69 coral fragments per light treatment). Only top down views of corallites were considered, since features viewed at an angle can be flattened, leading to distorted measurements.
Figure 1. Scanning electron microphotographs (magnification: 306). Structure of A. formosa radial corallites and S. pistillata corallites, developed under different light spectra: T5 fluorescent lamps (T5), light emitting diode (LED) and light emitting plasma (LEP). Photosynthetically active radiation (PAR) was identical to all tested light spectra: 250620 mmol quanta m 2s 1. Distance among corallites (DAC), corallite diameter (CD), theca thickness (TT), and septal length (SL).
In each corallite analyzed the theca thickness (TT) and the length of the septa (septal length SL, from the intersection with the theca to the columella) were registered. ForA. formosa, only the radial corallites were used. A schematic representation of the skeletal structures used for the morphometric analysis of both coral species is displayed in figure 2.
Statistical analyses
Statistical analyses were performed using the software Statistica version 8.0 (StatSoft Inc.) to evaluate the existence of significant differences in the porosity (One way ANOVA) and morphometrics (DAC, CD, TT and SL nested ANOVA with ’fragment’ as a nested variable) of coral fragment skeletons grown in the different light treatments (T5, LED and LEP, used as categorical factor) for each coral species. Assumptions of normality and homogeneity of variance were checked prior to the analysis through the Shapiro Wilk and Levene tests, respectively. Tukey HSD post hoc comparisons were used to determine the existence of significant differences between each species coral skeletons morphometry in the different light treatments.
Morphometric data of both species was also analyzed using principal coordinates ordination (PCO). The PCO was used to describe overall relationship among the A. formosa and S. pistillata grown in the different light treatments, respectively. The raw data matrix of morphometric data was first log (x+1) transformed, as this procedure places more emphasis on compo sitional differences among samples rather than on quantitative differences. After this transformation, a similarity/difference matrix was constructed using the Euclidean distance. The obtained plots (1 for each coral species) represented the distribution of specimens from the 3 light treatments according to their DAC, CD, TT and SL, together with the eigenvectors with a multiple correlation higher than 0.2. The displayed
eigenvectors correspond to the obtained eigenvalues, which reflect the amount of variance explained by the PCO. Similarity percentages (SIMPER) were also explored to examine the similarity within each light treatment for each coral species. All multivariate analyses were performed using PRIMER v6 with PERMANOVA add on (Primer E, Ltd., Plymouth, UK). Results
At the end of the experiment the survival rate was 100% in all light treatments for both species. The results of porosity, imaging by scanning electron microscopy and morphometric analyses are presented below.
Porosity
No significant differences were registered in the porosity of the skeletons of the monoclonal fragments of A. formosa (45.3267.59%, 53.6365.34% and 52.4562.41% for T5, LED and LEP, respectively; DF 2, F 1.980, p 0.2186) or S. pistillata (27.5261.58%, 25.6160.68% and 27.0663.82%, for T5, LED and LEP respectively; DF 2, F 0.508, p 0.6255) grown under the different light treatments. However, in all light treatments, the porosity ofA. formosa skeletons was significantly higher when compared with that ofS. pistillata (p,0.005). Evaluation by SEM
At the end of the experiment,A. formosa fragments displayed an arborescent like growth in all light treatments, with original primary branch projecting new branches containing one axial corallite, surrounded by radial corallites. Scanning electron microphotographs (magnification 306) of corallites from both species kept under different light treatments are presented in figure 1. We selected solely one image for each species per light
Figure 2. Schematic representation of corallites. Distance among corallites (DAC), corallite diameter (CD), theca thickness (TT), and septal length (SL).
treatment, as corallite patterns were similar within each light treatment for both species. Additionally we provide two supple mentary figures with images of three coral fragments from each light treatment for both coral species (Figure S1 and S2 for A. formosa and S. pistillata, respectively). A. formosa skeletons from LED treatment evidenced corallites with larger diameter (Fig ure 1) and depth, which evidenced a structure with "synapticu lothecate" [34] walls [35]. The costae of those radial corallites evidenced a large and defined structure running up the outside corallites wall. Corallites from skeletons of coral fragments stocked under T5 and LEP lighting presented a structure with lower size, and not as salient as corallites from coral fragments stocked under LED lighting. The costae of corallites from T5 and LEP lack presented a smaller structure mostly composed by spinules.
The corallites present in S. pistillata skeleton (Figure 1) evidenced a dissimilar morphology under the three light treatments tested. Corallites from LED and LEP treatments presented the costae in a vertical position, contrarily to corallites from T5 treatment whose costae was almost in a horizontal position (in the majority of corallites surveyed). The columella present in corallites from LEP treatment is close to the surface of the corallite calice, and its presence is more evident than in the corallites of fragments grown under the other light treatments.
The scanning electron microphotographs of corallite edge septal surface (magnification 50006) from both species kept under the different light treatments are presented in figure 3. We selected one image for each species per light treatment, although the patterns of septal microstructures were similar inside each light treatment for both species. The form of the septa of the corallite in A. formosa stocked under T5 fluorescent lamps presented a microstructure mostly composed by crystallites with spherical form and homogeneous size distribution, whereas septa observed in LED and LEP treatments presented a microstructure with the presence of fibers. Those fibers observed in septa from LED treatment presented a homogeneous growth orientation in the horizontal plan and were smaller and more compact than those in the LEP treatment. Additionally, fibers observed in septa from LEP presented a growth pattern oriented to all directions in the horizontal plan.
The scanning electron microphotographs of S. pistillata corallite septal surface from T5 light treatment presented a distinct microstructure, composed of spherical crystallites with homogeneous size distribution. The septal microstructure of corallites from the LED treatment presented a compacted aspect, where the spherical configuration of crystallites is not evidenced. LEP septa microstructure evidenced crystallites with a larger size, when compared with those from the T5 light treatment. Morphometric analyses
Distance among corallites (DAC), corallite diameter (CD), theca thickness (TT), and septal length (SL) registered in coral skeleton fragments from both species in the 3 light treatments are presented in figure 4.
The mean distance among corallites (6 SD, for all results presented) in A. formosa was significantly different in all light treatments (DF 2, F 35.03, p,0.05), with higher values registered in the LED treatment (12366184mm) followed by values obtained in the T5 treatment (11676180mm) and in the LEP treatment (10096101mm). The corallite diameter (DF 2, F 450.90, p,0.001) and length of septa (DF 2, F 352.31, p, 0.001) were also significantly different in all light treatments, for all comparisons. A. formosa fragments stocked under LED lighting presented the highest mean value of corallite diameter (11156118mm), followed by fragments from LEP (762667mm)
and T5 (702690mm). As for corallite diameter, the highest septal length mean value was registered for corals from LED treatment (355637mm), followed by fragments from LEP (2866.25mm) and T5 (224629mm). The theca thickness mean value was significantly higher (DF 2, F 71.25, p,0.01) for corals from LED treatment (264644mm), when compared with those from T5 (210623mm) and LEP (210624mm) treatments.
The mean distance among corallites (6 SD, for all results presented) measured inS. pistillata, were significantly different in all light treatments for all comparisons (DF 2, F 207.319, p, 0.001), with higher values registered in coral fragments from T5 (6086119mm), followed by coral fragments from LED (3746128mm) and LEP treatments (293669mm). The mean corallite diameter inS. pistillata fragments from LEP treatment (562653mm) was significantly lower (DF 2, F 80.69, p,0.01) when compared with values obtained in T5 (717686mm) and LEP (6926112mm) treatments.
Theca thickness mean values were statistically different in all light treatments (DF 2, F 303.812, p,0.01), with the highest mean value being registered in coral fragments from the T5 treatment (285663mm), followed by those grown under LED (178645mm) and LEP (157630mm).
As for corallite diameter, the length of septa in S. pistillata fragments from LEP treatment (117616mm) was significantly lower (DF 2, F 120.522, p,0.01) when compared with values obtained in LED (167643mm) and T5 (161632mm) treatments. Figure 5 shows a principal component ordination (PCO) based on morphometric characteristics of the coral species studied. The first two axes ofA. formosa PCO represent approximately 87% of total variation. Both ordinations evidenced the differences in morphometric parameters between light treatments. The hori zontal axis of variation separated specimens stocked under LED light treatment, with the corallite diameter and septal length more strongly influencing this pattern of distribution. The vertical axis maximized the differences between skeletons from LED, T5 and LEP, mainly due to distance among corallites.
The first two axes of the PCO for S. pistillata represent approximately 87% of the total variation recorded. The corallite diameter contributed for the differentiation between corals stocked under T5 light from those stocked LED and LEP, while theca thickness and the distance among corallites contributed to maximize the differences between skeletons from LED, T5 and LEP.
Discussion
The results of the present study provide a new insight into how light spectra can affect the macro and microstructure of the skeletons displayed by scleractinian corals. The experimental procedure allowed the study of a single factor (light spectra), once the interactions with Photosynthetic Active Radiation (PAR), water parameters, and genetic variability were excluded, though: 1) the application of the same PAR intensity in all light spectra treatments, 2) the utilization of the same water with a common life support system for all treatments, 3) the utilization of the same equipment (circulation pumps) in all experimental tanks, 4) the equivalent position of coral fragments and pumps in the tanks, and finally 5) the utilization of monoclonal fragments as experimental replicates for both species (a procedure that greatly reduced genetic variability) [13,17,21,27]. Therefore, it becomes evident that the spectral emission of light should receive a renewed attention by the scientific community studying the effects of light on zooxanthellate corals, in order to complement data provided by studies addressing the effect of PAR.
Understanding the light requirements of corals, especially for those species being cultured, is fundamental to achieve optimal production. The growth of scleractinian corals can be influenced by three physiological processes: 1) photosynthesis, 2) heterotro phic feeding, and 3) calcification [36]. The use of artificial illumination emitting in different wavelengths of visible light, but with the same PAR, has already been shown to affect coral growth [30,31]. In this topic, it is already documented the importance of blue light to the photosynthetic performance of zooxanthellae [37 39]. It has been suggested that higher calcification rates in scleractinian corals could be strongly related with autotrophy and endosymbionts activity [40].
The effect of light in scleractinian corals is widely described in literature. Studies on morphology suggest that corals might undergo plastic depending on the surrounding environment. A study performed by Todd et al. [22] with Favia speciosa and Diploastrea heliopora suggests a relationship between corallite morphology and light, detecting that corallites expand, extend and deepen under high light conditions. Another study performed by Crabbe and Smith [29] with Galaxea fascicularis showed that corallite width and distance among corallites decreased with the
amount of incident light, while corallite height increased with the amount of light. The increase of corallite depth with increasing light can be related with a strategy of achieving optimal internal irradiances for the photosynthetic activity of dinoflagellates harbored within coral tissues [41].
In the present study different light spectra, with the same PAR intensity, promoted differences detectable by corallite morphom etry, namely a significantly higher distance among corallites, corallite diameter, theca thickness and septal length onA. formosa and S. pistillata fragments grown under the LED blue spectra, when compared to the fragments grown under the LEP full visible spectra. It is well known that the amount of energy in light depends on the frequency of the wavelength. Blue light has a higher frequency than red light for example, and a photon of blue light has more energy than a photon of red light [42]. Consequently it is expected that in spite of the utilization of the same PAR, blue light treatments such as LED could provide more energy than LEP. Therefore, we can hypothesize that the differences in morphometric parameters evaluated for both species in the LED treatment, as well as for some parameters (e.g. DAC or TT) in the T5 treatment (which contain a higher percentage of
Figure 3. Scanning electron microphotographs (magnification: 50006). Structure of A. formosa and S. pistillata corallites septa, developed under different light spectra: T5 fluorescent lamps (T5), light emitting diode (LED) and light emitting plasma (LEP). Photosynthetically active radiation (PAR) was identical to all tested light spectra: 250620 mmol quanta m 2s 1. White arrows point septal microstructures, namely crystallites form and size distribution, as well as fibers growth orientation.
emission in blue spectra than LEP), can be promoted by corals as a way to optimize internal radiances for their endosymbiotic zooxanthellae.
As already referred, the morphometric analysis of corallite structures have been used to support coral taxonomy in the last decades. According to Veron [43], while this method is objective, numerically rigorous, and repeatable, differences between cor allites evidenced by morphometrics can be readily detected by skilled observers. This methodology can present several limitations related with spatial variation within the same colony (e.g. old corallites near the base of maturePocillopora damicornis can be more similar with basal corallites of otherPocillopora species than with the peripheral corallites of their own colony) [43].
The general microstructure of the coral skeleton has been established for many years [8]; however, the arrangement of fibbers and centers of calcification can result in a wide variety of tri dimensional microstructural patterns, and no single model available so far is satisfactory to describe coral skeletogenesis [10,12].
The use of skeletal morphology complemented with information resulting from molecular approaches is a powerful tool for coral taxonomy [44,45]. Skeletal microstructure has been linked to molecular phylogenetic techniques [14] to partially support phylogenetic relationships based on microstructural patterns. Nonetheless, the exact microstructural patterns for scleractinian corals remain uncertain [46]. As recognized by Veron in a recent overview on coral taxonomy [43], environment correlated micro skeletal variation in hard corals continues to be largely overlooked, even at higher taxonomic levels, although such variations can be easily observed in most member species of families Faviidae and Mussidae.
According to Schmidt Roach et al [47] fine scale morphological variation is useful to differentiate clades, and provides an excellent signature of the evolutionary relationships among genetic lineages. Still, taxonomic decisions based on morphometric measurements, accounts for differences related to environmental factors between habitats and for within colony variability [48]. The differences in skeletal microstructure of coral fragments originating from the same mother colony, promoted by different light spectra, can contribute for morphological investigations on the two studied coral species.
A study published by Rocha et al. [30] showed that blue light spectra from LED promoted higher specific growth rates (mean 6 SD) inA. formosa (0.003160.0005% day 1
) when compared with coral fragments grown under T5 (0.001960.0004% day 1) and LEP (0.001160.0004% day 1) lights. Blue light spectra also positively affected the specific growth rates registered for S. pistillata, since the coral fragments grown under the full light spectra of LEP presented significantly lower values of specific growth rate (0.001460.0003% day 1) when compared with coral fragments grown under T5 (0.002260.0006% day 1) and LED (0.002360.0003% day 1). While these differences may somehow help to explain the differences in microstructure, we cannot claim that they are indeed correlated. Moreover, as no significant differences in porosity were detected, any further discussion on this topic would be too speculative.
The possibility to shape the skeleton structure of cultured corals can also contribute to the optimization of reef restoration efforts [49,50]. By manipulating certain factorsex situ, such as light color simulating light extinction with ocean depth, or light intensity, one can promote the development of skeleton structures that may enable corals to thrive better once they are transplanted to their new natural environment.
Figure 4. Morphometric parameters ofA. formosaandS. pistillatacorallites. Skeletal macrostructures obtained after SEM image analyses of coral fragments stocked under T5 fluorescent lamps (T5), light emitting diode (LED) and light emitting plasma (LEP). The blue horizontal line in each light treatment represents the average value for the distance among corallites (DAC), corallite diameter (CD), theca thickness (TT), and septal length (SL). The shorter black lines represent average measurements within each coral fragment. Different capital letters on the same graphic represent significant differences (p,0.05).
doi:10.1371/journal.pone.0105863.g004
Figure 5. Principal component ordination based onA. formosaandS. pistillatamorphometry. Distance among corallites (DAC), corallite diameter (CD), theca thickness (TT), and septal length (SL) of coral skeletons from fragments stocked under T5 fluorescent lamps (T5), light emitting diode (LED) and light emitting plasma (LEP). Eigen vectors of multiple correlations (.0.2) are represented.
Overall, results from the present experiment evidence the key role played by light color, resulting from the emission wave length, in both the coral skeleton macro and microstructure. It is shown that experimentation ex situ under controlled conditions and relying on monoclonal coral fragments can open a new window of opportunity to evaluate individual parameters affecting the skeleton structure of zooxanthellate scleractinian corals.
Supporting Information
Figure S1 Scanning electron microphotographs (magni-fication: 306). Acropora formosa radial corallites of coral skeletons from fragments stocked under different light spectra: T5 fluorescent lamps (T5), light emitting diode (LED) and light emitting plasma (LEP). Photosynthetically active radiation (PAR) was identical to all tested light spectra: 250620mmol quanta m 2s 1.
(TIF)
Figure S2 Scanning electron microphotographs (magni-fication of 306).Stylophora pistillata corallites of coral skeletons
from fragments stocked under different light spectra: T5 fluorescent lamps (T5), light emitting diode (LED) and light emitting plasma (LEP). Photosynthetically active radiation (PAR) was identical to all tested light spectra: 250620mmol quanta m 2s 1.
(TIF)
Acknowledgments
The authors would like to express their sincere gratitude to Jorge Machado de Sousa (Maternidade do Coral Lda., Portugal) for making available the facilities for performing the experimental trials described in the present study and for his enthusiastic support along the whole experiment. We also thank two anonymous referees for their insightful comments on a previous version of our manuscript.
Author Contributions
Conceived and designed the experiments: RJMR RC. Performed the experiments: RJMR AMBS. Analyzed the data: RJMR AMBS ICSC MHVF RR RC. Contributed reagents/materials/analysis tools: MHVF. Wrote the paper: RJMR ICSC RR RC.
References
1. Graus RR, Macintyre IG (1976) Light control of growth form in colonial reef corals - computer-simulation. Science 193: 895 897.
2. Muko S, Kawasaki K, Sakai K, Takasu F, Shigesada N (2000) Morphological plasticity in the coral Porites sillimaniani and its adaptive significance. Bulletin of Marine Science 66: 225 239.
3. Padilla-Gamino JL, Hanson KM, Stat M, Gates RD (2012) Phenotypic plasticity of the coral Porites rus: Acclimatization responses to a turbid environment. Journal of Experimental Marine Biology and Ecology 434: 71 80.
4. Veron J (2000) Corals of the world. Townsville, Queensland, Australia: Australian Institute of Marine Science.
5. Veron J (1995) Corals in space and time: The biogeography and evolution of the Scleractinia. Comstock/Cornell (Ithaca).
6. Menezes NMd, Neves EG, Barros F, Kikuchi RKPd, Johnsson R (2013) Intracolonial variation inSiderastrea de Blainville, 1830 (Anthozoa, Scleracti-nia): taxonomy under challenging morphological constraints. Biota Neotropica 13: 108 116.
7. Stobart B (2000) A taxonomic reappraisal of Montipora digitata based on genetic and morphometric evidence. Zoological Studies 39: 179 190. 8. Sorauf JE (1972) Skeletal microstructure and microarchitecture in Scleractinia
(Coelenterata). Palaeontology 15: 88 107.
9. Dullo W-C (1987) The role of microarchitecture and microstructure in the preservation of taxonomic closely related scleractinians. Facies 16: 11 21. 10. Nothdurft L, Webb G (2007) Microstructure of common reef-building coral
generaAcropora, Pocillopora, Goniastrea and Porites: constraints on spatial resolution in geochemical sampling. Facies 53: 1 26.
11. Stolarski J, Roniewicz EWA (2001) Towards a new synthesis of evolutionary relationships and classification of Scleractinia. Journal of Paleontology 75: 1090 1108.
12. Stolarski J, Russo A (2002) Microstructural diversity of the stylophyllid (Scleractinia) skeleton. Acta Palaeontologica Polonica 47: 651 666.
13. Bruno J, Edmunds P (1997) Clonal variation for phenotypic plasticity in the coralMadracis mirabilis. Ecology 78: 2177 2190.
14. Cuif J-P, Lecointre G, Perrin C, Tillier A, Tillier S (2003) Patterns of septal biomineralization in Scleractinia compared with their 28S rRNA phylogeny: a dual approach for a new taxonomic framework. Zoologica Scripta 32: 459 473. 15. Potts D (1978) Differentiation in coral populations. Atoll Research Bulletin 220:
55 74.
16. Potts D (1976) Growth interactions among morphological variants of the coral Acropora palifera. In: Mackie G, editor. Coelenterate Ecology and Behaviour. New York: Plenum Press. pp. 79 88.
17. Raymundo L (2001) Mediation of growth by conspecific neighbors and the effect of site in transplanted fragments of the coral Porites attenuata Nemenzo in the central Philippines. Coral Reefs 20: 263 272.
18. Bongiorni L, Shafir S, Angel D, Rinkevich B (2003) Survival, growth and gonad development of two hermatypic corals subjected to in situ fish-farm nutrient enrichment. Marine Ecology Progress Series 253: 137 144.
19. Bongiorni L, Shafir S, Rinkevich B (2003) Effects of particulate matter released by a fish farm (Eilat, Red Sea) on survival and growth ofStylophora pistillata coral nubbins. Marine Pollution Bulletin 46: 1120 1124.
20. Nir O, Gruber DF, Einbinder S, Kark S, Tchernov D (2011) Changes in scleractinian coral Seriatopora hystrix morphology and its endocellular Symbiodinium characteristics along a bathymetric gradient from shallow to mesophotic reef. Coral Reefs 30: 1089 1100.
21. Todd PA (2008) Morphological plasticity in scleractinian corals. Biological Reviews 83: 315 337.
22. Todd PA, Ladle RJ, Lewin-Koh NJI, Chou LM (2004) Genotype x environment interactions in transplanted clones of the massive corals Favia speciosa and Diploastrea heliopora. Marine Ecology Progress Series 271: 167 182. 23. Chappell J (1980) Coral morphology, diversity and reef growth. Nature 286:
249 252.
24. Riegl B, Heine C, Branch GM (1996) Function of funnel shaped coral growth in a high-sedimentation environment. Marine Ecology-Progress Series 145: 87 93. 25. Stafford-Smith MG (1993) Sediment-rejection efficiency of 22 species of
Australian scleractinian corals. Marine Biology 115: 229 243.
26. Foster AB (1980) Environmental variation in skeletal morphology within the Caribbean reef coralsMontastraea annularis and Siderastrea siderea. Bulletin of Marine Science 30: 678 709.
27. Todd PA, Sidle RC, Lewin-Koh NJI (2004) An aquarium experiment for identifying the physical factors inducing morphological change in two massive scleractinian corals. Journal of Experimental Marine Biology and Ecology 299: 97 113.
28. Todd PA, Ladle RJ, Lewin-Koh NJI, Chou LM (2004) Flesh or bone? Quantifying small-scale coral morphology using with-tissue and without-tissue techniques. Marine Biology 145: 323 328.
29. Crabbe MJC, Smith DJ (2006) Modelling variations in corallite morphology of Galaxea fascicularis coral colonies with depth and light on coastal fringing reefs in the Wakatobi Marine National Park (S.E. Sulawesi, Indonesia). Computa-tional Biology and Chemistry 30: 155 159.
30. Rocha RJM, Pimentel T, Seroˆdio J, Rosa R, Calado R (2013) Comparative performance of light emitting plasma (LEP) and light emitting diode (LED) in ex situ aquaculture of scleractinian corals. Aquaculture 402 403: 38 45. 31. Wijgerde T, Henkemans P, Osinga R (2012) Effects of irradiance and light
spectrum on growth of the scleractinian coralGalaxea fascicularis - Applicability of LEP and LED lighting to coral aquaculture. Aquaculture 344: 188 193. 32. Cohen FP, Valenti WC, Calado R (2013) Traceability issues in the trade of
marine ornamental species. Reviews in Fisheries Science 21: 98 111. 33. Bruckschen B, Seitz H, Buzug T, Tille C, Leukers B, et al. (2005) Comparing
different porosity measurement methods for characterisation of 3D printed bone replacement scaffolds. Biomedizinische Technik 50: 1609 1610.
34. Wells JW (1956) Scleractinia. In: Moore RC, editor. Treatise on Invertebrate Paleontology, Part F. Kansas, USA: Geological Society of America and University of Kansas. pp. F328 444.
35. Wallace C (1999) Staghorn Corals of the World: A Revision of the Genus Acropora: CSIRO PUBLISHING.
36. Osinga R, Schutter M, Griffioen B, Wijffels R, Verreth JJ, et al. (2011) The biology and economics of coral growth. Marine Biotechnology 13: 658 671. 37. Ku¨hl M, Cohen Y, Dalsgaard T, Jorgensen B, Revsbech N (1995)
Microenvironment and photosynthesis of zooxanthellae in scleractinian corals studied with microsensors for O2, pH and light. Marine Ecology Progress Series
117: 159 172.
38. Levy O, Achituv Y, Yacobi YZ, Stambler N, Dubinsky Z (2006) The impact of spectral composition and light periodicity on the activity of two antioxidant enzymes (SOD and CAT) in the coralFavia favus. Journal of Experimental Marine Biology and Ecology 328: 35 46.
39. Levy O, Dubinsky Z, Achituv Y (2003) Photobehavior of stony corals: responses to light spectra and intensity. Journal of Experimental Biology 206: 4041 4049.
40. Allemand D, Ferrier-Pages C, Furla P, Houlbreque F, Puverel S, et al. (2004) Biomineralisation in reef-building corals: from molecular mechanisms to environmental control. Comptes Rendus Palevol 3: 453 467.
41. Kaniewska P, Magnusson SH, Anthony KRN, Reef R, Kuhl M, et al. (2011) Importance of macro-versus microstructure in modulating light levels inside coral colonies. Journal of Phycology 47: 846 860.
42. Crowell B (2013) Light and Matter. California: Fullerton. 1016 p.
43. Veron J (2013) Overview of the taxonomy of zooxanthellate Scleractinia. Zoological Journal of the Linnean Society.
44. Benzoni F, Stefani F, Pichon M, Galli P (2010) The name game: morpho-molecular species boundaries in the genus Psammocora (Cnidaria, Scleractinia). Zoological Journal of the Linnean Society 160: 421 456.
45. Stefani F, Benzoni F, Yang SY, Pichon M, Galli P, et al. (2011) Comparison of morphological and genetic analyses reveals cryptic divergence and morpholog-ical plasticity in Stylophora (Cnidaria, Scleractinia). Coral Reefs 30: 1033 1049.
46. Cuif J-P, Perrin C (1999) Micromorphology and microstructure as expressions of scleractinian skeletogenesis in Favia fragum (Esper, 1 795)(Faviidae, Scleracti-nia). ZOOSYSTEMA-PARIS- 21: 137 156.
47. Schmidt-Roach S, Miller KJ, Lundgren P, Andreakis N (2014) With eyes wide open: a revision of species within and closely related to the Pocillopora damicornis species complex (Scleractinia; Pocilloporidae) using morphology and genetics. Zoological Journal of the Linnean Society 170: 1 33.
48. Weil E, Knowton N (1994) A multi-character analysis of the caribbean coral Montastraea annularis (Ellis and Solander, 1786) and its two sibling species, M. faveolata (Ellis and Solander, 1786) and M. franksi (Gregory, 1895). Bulletin of Marine Science 55: 151 175.
49. Rinkevich B (2005) Conservation of coral reefs through active restoration measures: recent approaches and last decade progress. Environmental Science & Technology 39: 4333 4342.
50. Shafir S, Van Rijn J, Rinkevich B (2006) Steps in the construction of underwater coral nursery, an essential component in reef restoration acts. Marine Biology 149: 679 687.