For Peer Review
Computerized respiratory sounds are a reliable marker in
COPD
Journal: Respiratory Care Manuscript ID: RC-03922.R2 Manuscript Type: Original Research Date Submitted by the Author: n/a
Complete List of Authors: Jácome, Cristina; Faculty of Sports, University of Porto, Research Centre in Physical Activity, Health and Leisure (CIAFEL)
Marques, Alda; University of Aveiro (ESSUA), School of Health Sciences Categories: Chronic obstructive pulmonary disease/COPD, computerized auscultation,
respiratory sounds
For Peer Review
1
Computerized respiratory sounds are a reliable marker in COPD
1
Running head: Respiratory sounds are reliable in COPD
2
Cristina Jácome1,2 PT, MSc, [email protected]; Alda Marques2,3 PT, PhD, [email protected]
3
4
1 Research Centre in Physical Activity, Health and Leisure (CIAFEL), Faculty of Sports,
5
University of Porto, Porto, Portugal
6
2 School of Health Sciences, University of Aveiro (ESSUA), Aveiro, Portugal
7
3 Cintesis.UA (Center for Health Technology and Services Research), University of Aveiro,
8
Aveiro, Portugal9
10
Funding11
Support for this study was provided by Fundação para a Ciência e Tecnologia (FCT – Ref.
12
SFRH/BD/84665/2012), Portugal.13
14
Conflict-of-interest statement15
The authors report no conflict of interests.
16
17
Contributors
18
CJ performed data collection and analysis and drafted the manuscript. AM revised it critically for
19
important intellectual content and provided final approval of the version to be published.
20
21
Corresponding author: Alda Marques, PT, MSc, PhD, Senior Lecturer, School of Health
22
Sciences, University of Aveiro (ESSUA), Agras do Crasto - Campus Universitário de Santiago,
23
Edifício 30, 3810-193 Aveiro, Portugal. Email: [email protected]
For Peer Review
2
ABSTRACT
1
Introduction: Computerized respiratory sounds (RS) have shown potential to monitor respiratory
2
status in patients with COPD. However, variability and reliability of this promising marker in
3
COPD are unknown. Therefore, this study assessed the variability and reliability of RS at
4
distinct airflows and standardized anatomic locations in patients with COPD.
5
Methods: A two-part study was conducted. Part one assessed the intra-subject reliability of RS
6
at spontaneous and target (0.4-0.6L/s and 0.7-1L/s) airflows in 13 outpatients (69.3±8.6yrs;
7
FEV1 70.9±21.4% predicted). Part two characterized the inter-subject variability and
intra-8
subject reliability of RS at each standardized anatomic location, using the most reliable airflow,
9
in a sample of 63 outpatients (67.3±10.4yrs; FEV1 75.4±22.9% predicted). RS were recorded
10
simultaneously at seven anatomic locations (trachea, right and left: anterior, lateral and
11
posterior chest). Airflow was recorded with a pneumotachograph. Normal RS intensity, mean
12
number of crackles and wheezes were analyzed with developed algorithms. Inter-subject
13
variability was assessed with the coefficient of variation (CV) and intra-subject reliability with
14
Intraclass Correlation Coefficient (ICC) and Bland and Altman plots.
15
Results: Relative reliability was moderate to excellent for normal RS intensity and mean number
16
of crackles (ICCs .66-.89) and excellent for mean number of wheezes (ICCs .75-.99) at the
17
three airflows. Absolute reliability was greater at target airflows; especially at 0.4-0.6L/s.
Inter-18
subject variability was high for all RS parameters and across locations (CV .12-2.22). RS
19
parameters had acceptable relative and absolute intra-subject reliability at the different
20
anatomic locations. The only exception was the mean number of crackles at trachea, which
21
relative and absolute reliability was poor.
22
Conclusions: RS parameters are more reliable at an airflow of 0.4-0.6L/s and overall reliable at
23
all anatomic locations. This should be considered in future studies using computerized
24
auscultation.
25
26
Key-words: computerized auscultation; respiratory sounds; normal respiratory sounds; crackles;
27
wheezes; chronic obstructive pulmonary disease; reliability.
For Peer Review
3
INTRODUCTION
1
Chronic Obstructive Pulmonary Disease (COPD) is characterized by persistent airflow limitation
2
that is usually progressive.1 The forced expiratory volume in one second (FEV1) has been
3
established as the global marker for COPD diagnosis and monitoring.1 Nevertheless, changes
4
in FEV1 in response to treatment are small in relation to its repeatability. 2, 3
New clinical markers
5
are therefore needed for evaluating the effectiveness of treatments in COPD.4 These markers
6
should be simple in terms of measurement, interpretation and resources used, and have
7
acceptable reliability, to ensure that the error involved in measurement is small enough to detect
8
actual changes.4
9
Respiratory sounds (RS) are a simple, objective and non-invasive marker to assess the function
10
of the respiratory system,5 which do not require special resources beyond those typical of a
11
patient–health professional encounter. However, variation and reliability of this promising
12
marker across and within patients with COPD are still unknown.
13
It has been shown, using computerized auscultation, that in stable patients with COPD,
14
adventitious RS are mainly characterized by inspiratory crackles and expiratory wheezes.6-9
15
More recently, RS were suggested to be useful to diagnose community-acquired pneumonia in
16
this population.10 These recent studies showed that RS might have potential to monitor the
17
respiratory status of patients with COPD. However, inter-subject variability and intra-subject
18
reliability was not explored, hindering the interpretation of actual changes. In addition, RS have
19
been recorded with no control over patients’ airflows, despite the well-known influence of airflow
20
on respiratory acoustic and breathing pattern.11-13
21
Computerized respiratory sound analysis (CORSA) guidelines recommend recordings with an
22
inspiratory and expiratory peak airflow of 1–1.5L/s or 10–15% of the predicted maximum peak
23
expiratory airflow.14 However, it is unknown if the airflow recommended suit the breathing
24
pattern specificities of patients with COPD. It has been shown that breathing pattern in patients
25
with COPD has reduced complexity compared with healthy subjects,15 which may affect RS
26
reliability at different airflows. CORSA guidelines also standardized seven anatomic locations
27
(trachea; right and left: anterior, lateral and posterior chest) to record RS.14 Nevertheless,
inter-28
subject variability and intra-subject reliability of RS at each anatomic location in patients with
29
COPD has never been investigated. To address these relevant research needs, this study
For Peer Review
4
assessed the i) intra-subject reliability of breathing pattern and RS at distinct airflows and ii)
1
inter-subject variability and intra-subject reliability of RS at each standardized anatomic location
2
in patients with COPD.
3
METHODS
4
Study design
5
A two-part study was conducted. Part one assessed the intra-subject reliability of breathing
6
pattern and RS at three distinct airflows, using a small sample of outpatients with COPD. Part
7
two characterized the inter-subject variability and intra-subject reliability of RS at each anatomic
8
location, using the most reliable airflow from part 1 and a larger sample of outpatients with
9
COPD.
10
Participants
11
Outpatients with COPD were recruited from two primary care centers. Inclusion criteria were
12
diagnosis of COPD according to the Global Initiative for Chronic Obstructive Lung Disease
13
(GOLD) criteria (presence of a post-bronchodilator FEV1/FVC<0.70)1 and clinical stability for 1
14
month prior to the study (no hospital admissions, exacerbations as defined by the GOLD1 or
15
changes in medication for the respiratory system). Patients were excluded if they presented
co-16
existing respiratory diseases or had severe neurological, musculoskeletal or psychiatric
17
impairments. Approval for this study was obtained from the ethics committee of the Center
18
Health Regional Administration (2013-05-02) and from the National Data Protection Committee
19
(3292/2013). Eligible patients were identified via clinicians and then contacted by the
20
researchers, who explained the purpose of the study and asked about their willingness to
21
participate. When patients agreed to participate, an appointment with the researchers was
22
scheduled. Written informed consent was obtained prior to data collection.
23
Data collection
24
Socio-demographic, anthropometric (height and weight) and clinical (smoking habits, dyspnea,
25
exacerbations in the past 3 months and in the previous year, medication) data were first
26
recorded in the two study parts. Then, airflow and RS were collected. Lung function was
27
assessed with spirometry (MicroLab 3500, CareFusion, Kent, UK) according to standardized
28
guidelines.16 Patients were classified in 4 groups (A, B, C, D) using the GOLD combined
For Peer Review
5
assessment (symptoms-mMRC, spirometry and risk of exacerbations).1 All assessments were
1
performed by two physiotherapists and the order was standardized.
2
Part one
3
Airflow and RS were acquired simultaneously. Recordings were performed at spontaneous
4
airflow, at a peak of 0.4-0.6L/s (typical tidal airflow range), and at a peak of 0.7-1L/s (modestly
5
increased airflow). Similar target airflows have been used in previous research.17 After 5-min of
6
quiet sitting, the three distinct airflows were acquired following the standardized order:
7
spontaneous, 0.4-0.6L/s and 0.7-1L/s. Spontaneous breathing was tested first, so it would not
8
be influenced by the target airflows and the order of the two target airflows was selected based
9
on the increased airflow demand. Patients were in a seated-upright position, wearing a nose clip
10
and breathing through a mouthpiece connected to a heated pneumotachograph (3830, Hans
11
Rudolph, Inc., Shawnee, KS, USA). For each airflow, patients performed three trials of 20
12
seconds each18, followed by a 2-min recovery period. During spontaneous airflow, patients were
13
instructed to breathe normally and biofeedback of the flow signal was not presented. During
14
target flows, patients had visual biofeedback of the flow signal (RSS 100R Research
15
Pneumotach System, Hans Rudolph, Shawnee, KS, USA) and were instructed to maintain the
16
flow between two horizontal lines. Recording of each target flow was preceded by a training
17
phase of at least 3 breathing cycles.
18
RS recordings followed CORSA guidelines for short-term acquisitions14 and were performed
19
simultaneously at seven anatomic locations (trachea; right and left anterior chest; right and left
20
lateral chest; right and left posterior chest)19 using the LungSounds@UA interface.20 Seven
21
stethoscopes (Classic II S.E., Littmann®, 3M, St. Paul, MN, USA), with a microphone
22
(frequency response between 20Hz and 19kHz - TOM-1545P-R, Projects Unlimited, Inc.®,
23
Dayton, OH, USA) and preamplifier circuit (Intelligent Sensing Anywhere®, Coimbra, PT) in the
24
main tube, were attached to the patient’s skin with adhesive tape (Soft Cloth Surgical Tape, 3M,
25
St. Paul, MN, USA). The analogue sound signals were further amplified and converted to digital
26
by an audio interface (M-Audio® ProFire 2626, Irwindale, CA, USA). The signal was converted
27
with a 24-bit resolution at a sampling rate of 44.1kHz and recorded in .wav format.
28
Part two
For Peer Review
6
Airflow and RS were acquired simultaneously at the most reliable airflow identified in part one of
1
the study. The same procedures from part one were followed.
2
Signal processing
3
All files were processed using algorithms written in Matlab®R2009a (Mathworks, Natick, MA,
4
USA). Breathing phases were automatically detected using the positive and negative airflow
5
signals. Mean inspiratory and expiratory time were then calculated. The mean airflows and tidal
6
volumes were calculated per breathing phase using flow and volume raw signals. To combine
7
the detected breathing phases with sound signals, the flow signals were timed synchronized
8
with tracheal sound signals. Due to the simultaneous acquisition of RS at the seven locations,
9
the breathing phases detected on tracheal sounds were applied to the other six locations.
10
Crackles were detected using a multi-algorithm technique based on established algorithms.21-23
11
This multi-algorithm technique showed a 7% performance improvement over the best individual
12
algorithm.24 Wheezes were detected using an algorithm based on time-frequency analysis.25
13
The mean number of crackles and wheezes per breathing phase was extracted. After excluding
14
these adventitious sounds, normal respiratory sounds (NRS) were analyzed based on the
15
methodology proposed by Pasterkamp26 and the mean intensity was determined within a
16
frequency band of 100 to 2000Hz.26, 27
17
Statistical analysis
18
All statistical analyses were performed using IBM SPSS Statistics version 20.0 (IBM
19
Corporation, Armonk, NY, USA). The level of significance was set at 0.05.
20
Part one
21
Descriptive statistics were used to characterize the sample. Inspiratory and expiratory mean
22
airflow, tidal volume and time were determined by computing the mean of the three recordings
23
at each airflow. The mean NRS intensity, mean number of crackles and mean number of
24
wheezes per breathing phase were determined by computing the mean of the three recordings
25
at all anatomic locations. One-way repeated measures ANOVA was used to analyze differences
26
in the breathing pattern and RS across airflows. When a statistically significant difference was
27
found, Bonferroni post hoc tests were performed. Statistical analysis was completed with the
28
estimation of effect sizes. The effect size was computed via Partial eta-squared as it is the index
For Peer Review
7
more commonly reported for analysis of variance with repeated measures.28 Partial eta-squared
1
was interpreted as small (ƞ2≥0.01), medium (ƞ2≥0.06) or large (ƞ2≥0.14) effect.29
2
As recommended for intra-subject reliability,30 both relative, with Intraclass Correlation
3
Coefficient (ICC), and absolute reliability, with Bland and Altman method, were used. The ICC
4
equation (1, K) was used, where k=3 since three recordings were performed for each airflow.
5
ICC was interpreted as excellent (>0.75), moderate to good (0.4-0.75) or poor (<0.4).31 Bland
6
and Altman method assesses the agreement between two sets of measures.32 Thus, random
7
numbers were generated in Matlab to delete one recording. Bland and Altman plots were
8
created to analyze the distribution of results (GraphPad Prism version 5.01, GraphPad
9
Software, Inc., La Jolla, CA, USA).32
10
Sample size was determined as described by Bonett.33 A sample size of 13 subjects was
11
required to estimate an ICC of 0.9 with a 95% confidence interval width of 0.2 (α=0.05 and
12
k=3).3313
14
Part two15
Descriptive statistics were used to characterize the sample. The mean NRS intensity, mean
16
number of crackles and mean number of wheezes per breathing phase were determined by
17
computing the mean of the three recordings for each anatomic location (trachea, anterior right
18
and left, lateral right and left, posterior right and left). The inter-subject variability in RS
19
parameters was measured with the coefficient of variation (CV), as it is useful for analyzing the
20
variability of measures, independently of the magnitude of the data.34 It is defined as the
21
standard deviation divided by the mean.35 The relative and absolute intra-subject reliability of
22
RS parameters were computed, as described above, per anatomic location.
23
Sample size for the CV was estimated using the approach of Kelley.36 Using data from part one,
24
it was found that the CV of NRS intensity was between 0.17 and 0.25. It was determined that a
25
minimum of 59 individuals was needed for a CV of 0.25 with a 95% confidence interval width of
26
0.1 (α=0.05).3627
28
RESULTS29
Part one30
For Peer Review
8
Thirteen participants (10 male) were enrolled. Four participants had mild, six moderate and
1
three severe-to-very-severe airflow limitation. All patients used long-acting bronchodilators.
2
Table 1 provides participants’ characteristics.
3
(Table 1)
4
Respiratory sounds
5
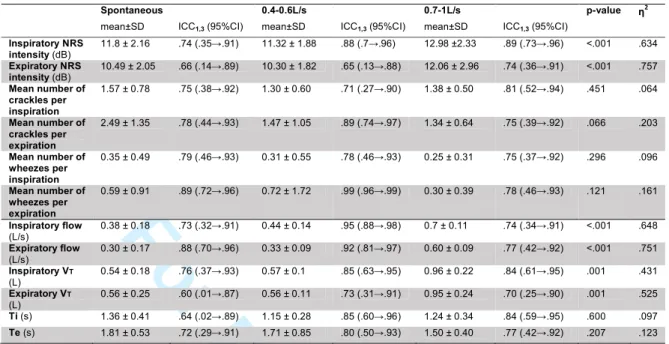
Intensity of NRS during inspiration and expiration was higher at an airflow of 0.7-1L/s (post hocs
6
p<0.001) (Table 2). No significant differences were seen in the mean number of crackles
7
(inspiratory p=0.451; expiratory p=0.066) and wheezes (inspiratory p=0.296; expiratory
8
p=0.121). Relative reliability of NRS intensity was moderate to excellent at the three airflows
9
(Table 2). Bland and Altman plots indicated greater agreement for NRS intensity at an airflow of
10
0.4-0.6L/s (Figure 1b and 2b). Relative reliability of the mean number of inspiratory and
11
expiratory crackles was found to be moderate to excellent for the three airflows (Table 2).
12
However, a higher level of agreement existed at an airflow of 0.4-0.6L/s, with narrower limits of
13
agreement (Figure 1e and 2e). Relative reliability of mean number of inspiratory and expiratory
14
wheezes was excellent at all airflows (Table 2), though, greater agreement was found at target
15
airflows (Figure 1h and 1i/Figure 2h and 2i).
16
(Table 2; Figure 1 and 2)
17
18
Breathing pattern
19
At an airflow of 0.7-1L/s, significant higher flows (post hocs p<0.001) and tidal volumes (post
20
hocs p<0.05) were found (Table 2). Inspiratory and expiratory time were similar across airflows
21
(p=0.6 and p=0.207). Intra-subject relative reliability of airflow, tidal volume and time was higher
22
at target airflow of 0.4-0.6L/s (ICCs from .73 to .95) when compared to spontaneous airflow
23
(ICCs from .60 to .88) or target airflow of 0.7-1L/s (ICCs from .70 to .84) (Table 2). From Figures
24
3 and 4, it can also be observed that intra-subject absolute reliability was higher at 0.4-0.6L/s.
25
(Figure 3 and 4)
26
From the analysis of RS and breathing pattern parameters, it can be verified that intra-subject
27
reliability was higher at an airflow of 0.4-0.6L/s.
28
29
Part two
For Peer Review
9
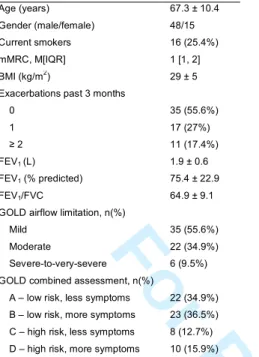
A total of 63 participants (48 male) were enrolled. Most participants had low risk of
1
exacerbations (A-34.9% and B-36.5%) and all used long-acting bronchodilators. Table 3
2
provides participants’ detailed characteristics.
3
(Table 3)4
5
Respiratory sounds6
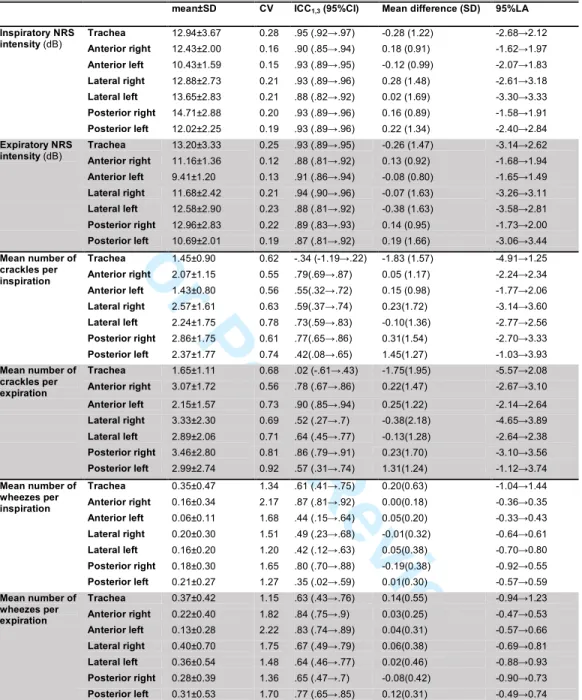
Descriptive characteristics of NRS intensity (from 9.41 to 14.71db), mean number of crackles
7
(from 1.43 to 3.46) and mean number of wheezes (from 0.06 to 0.40) across locations are
8
presented in table 4. Inter-subject variability was high in all RS parameters however, the mean
9
number of crackles (CV 0.55-0.92) and wheezes (CV 1.15-2.22) were the parameters
10
presenting the highest variation (Table 4). Inter-subject variability was generally higher during
11
expiration than inspiration for all the RS parameters (NRS intensity 0.12-0.23 vs. 0.15-0.21;
12
mean number of crackles 0.56-0.92 vs. 0.55-0.78; mean number of wheezes 1.36-2.22
vs.1.2-13
2.17) at most locations, with the exception of trachea.
14
NRS intensity had an excellent relative and absolute reliability at all anatomic locations (Table
15
4). The relative and absolute reliability of the mean number of crackles and wheezes was
16
moderate to excellent at all anatomic locations. The only exceptions were the mean number of
17
inspiratory and expiratory crackles at trachea, which relative and absolute reliability was poor
18
(Table 4).19
(Table 4)20
DISCUSSION21
To the best of our knowledge this is the first study investigating inter-subject variability and
intra-22
subject reliability of RS at distinct airflows and anatomic locations in patients with stable COPD.
23
The main findings indicated that RS parameters are i) more reliable at an airflow of 0.4-0.6L/s;
24
ii) highly variable across patients and iii) overall reliable at all standardized anatomic locations.
25
The NRS intensity increased with higher airflows. The link between sound intensity and airflow
26
has long been recognized.37 From spontaneous to target airflows, mean number of inspiratory
27
and expiratory crackles had a tendency to decrease. This has also been observed in patients
28
with Interstitial Pulmonary Fibrosis, when comparing crackle rate during normal and
deep-29
breathing maneuvers.38 This may be related with the effect of lung expansion as recordings
For Peer Review
10
were repeated at short intervals.39 During the first breathing maneuvers, regions of deflated
1
airways probably opened and in the following maneuvers the production of crackles
2
decreased.39 The mean number of wheezes had also a tendency to decrease. The consecutive
3
expirations at increased airflows could have been sufficient to decrease the cross-sectional
4
diameter of airways, particularly of the second generation of the airway tree,5 increase linear
5
velocities and aid secretion movement.40 This phenomenon could have reduced the narrowing
6
airway and thus the production of wheezes.5, 41 These findings show that the characteristics of
7
RS are variable at distinct airflows, reinforcing the need of using standardized airflows during
8
computerized auscultation. This will be essential if RS are to become a clinical marker for
9
evaluating the effectiveness of treatments.
10
Relative reliability of NRS intensity and of mean number of crackles was moderate to excellent
11
at the three airflows. However, ICCs in isolation do not provide a true picture of reliability.30
12
Bland and Altman method is independent of the true variability and provide detail regarding the
13
nature of the observed intra-subject variability.30 The agreement assessed from Bland and
14
Altman method was found to be acceptable for NRS intensity and mean number of crackles at
15
the three airflows. Nevertheless, for these RS parameters, a higher agreement was found at an
16
airflow of 0.4-0.6L/s. Reliability of mean number of wheezes was excellent for all airflows.
17
Forced expiratory wheezes have also been found to be reproducible in normal subjects.42 No
18
systematic bias was observed at any tested airflow, though, a higher agreement was found at
19
target airflows.
20
Regarding breathing pattern, the mean inspiratory (0.38±0.18L/s) and expiratory (0.3±0.17L/s)
21
flows at spontaneous airflow were similar to values previously reported.43-45 Significant higher
22
tidal volumes were observed at airflow of 0.7-1L/s, which was expected due to the direct
23
relationship between airflow and volume.46 Inspiratory (1.15-1.36s) and expiratory (1.50-1.81s)
24
time were within the commonly reported values in the literature.47 In patients with COPD, the
25
breathing pattern has also been found to be similar during constant and incremental loaded
26
breathing tests.47 The intra-subject reliability of breathing pattern parameters was found to be
27
better at target airflows.48 This might be due to the explicit instructions to breathe at a typical
28
peak airflow, which further reduced the breathing complexity.15 In accordance to this, breathing
29
pattern was also more reliable at target flows, especially at an airflow of 0.4-0.6L/s. This is
For Peer Review
11
probably explained by the fact that the airflow of 0.7-1L/s was the most demanding for patients
1
to perform and maintain during the 20-second recordings.48 Therefore, from the analysis of RS
2
and breathing pattern parameters, it can be concluded that the target airflow of 0.4-0.6L/s is the
3
most reliable to characterize NRS, crackles and wheezes in patients with COPD.
4
At an airflow of 0.4-0.6L/s, the NRS intensity across locations was found to be from 9.41 to
5
14.71db. These values are slightly lower than those found in healthy individuals at right
6
posterior chest (inspiration 17.17db; expiration 11.50db).49 Nevertheless, in this previous study
7
healthy individuals breathed at a higher target flow (1.5±0.2L/s).49 The mean number of crackles
8
was found to be from 1.43 to 3.46, being within the previously range described (0.73 - 5).8, 50
9
Wheezes were not frequent across locations (from 0.06 to 0.40), which is in line with a previous
10
study.8
11
Nevertheless, even when recorded with the most reliable airflow, RS parameters exhibited
12
considerable inter-subject variability. Among other factors, differences regarding demographic,
13
anthropometric and clinical (e.g., dyspnea, COPD severity and history of exacerbations)
14
characteristics might contributed for this variability across subjects. High inter-subject variability
15
of RS has also been previously reported in patients with Cystic Fibrosis and Bronchiectasis.51
16
However, this inter-subject variability is similar to other biosignals that support clinical decisions
17
(e.g., heart rate variability, electromyography).52, 53 In a clinical perspective, this inter-subject
18
variability limits inferences at group-level as RS patterns may fail to represent patterns seen in
19
individuals. For example, increased wheezing has been recognized as one of the signs of an
20
acute exacerbation of COPD.54 Nevertheless, due to the high variability of this RS parameter, a
21
small increase in the mean number of wheezes may indicate a change in the clinical status for
22
one patient, but not to another. This highlights the importance of healthcare professionals
23
supporting their clinical decision in the interpretation of RS changes at an individual level and in
24
combination with other clinical data.
25
NRS intensity, mean number of crackles and mean number of wheezes were found to be
26
reliable across all anatomic locations. At trachea, however, the mean number of crackles had
27
poor reliability. This result may be due to low generation of this adventitious sound at this region
28
of the respiratory tract. It has been generally accepted that crackles are generated when an
For Peer Review
12
airway opens during inspiration or closes during expiration.39, 55 Since trachea is characterized
1
by a large diameter and rigid wall, it is unlikely to open or collapse during tidal breathing.
2
In addition, NRS intensity had lower variability and higher reliability than mean number of
3
crackles and mean number of wheezes at all anatomic locations. NRS are the sounds that are
4
produced when breathing and can be heard both during inspiration and expiration (nearly
5
silent).56 Crackles and wheezes are superimposed events on NRS,56 which timing may not be
6
perfectly repeatable from breath to breath. Health professionals may, thus, more confidently rely
7
on changes in NRS intensity than in the mean number of adventitious RS.
8
Study limitations
9
The recording of distinct airflows at the same session and at relatively short intervals may have
10
influenced the results. However, to minimize bias, the order of tests was standardized and
11
patients were instructed to rest as needed. Future studies assessing intra-subject reliability
12
could perform the recordings in different sessions within the same day. It would be also
13
interesting in future studies to explore the intra-subject test-retest reliability of RS to understand
14
their stability and reliability over time. The present study focused in only one parameter per RS.
15
Future studies could investigate the reliability of RS using other parameters which also have
16
clinical relevance.57 Additionally, the unbalance sample in terms of COPD severity can be
17
another limitation of the present study. The samples were mainly composed of patients with
18
mild and moderate airflow limitation, and thus it was not possible to explore how the disease
19
severity related to the variability/reliability of RS parameters. However, as the breathing pattern
20
at airflow of 0.4-0.6L/s is similar to that found in patients with advanced COPD47 and airflow
21
variability is not related with COPD severity,15 the disease severity might not play a significant
22
role. Future studies should however investigate this.
23
CONCLUSIONS
24
The main findings suggest that RS parameters are more reliable at an airflow of 0.4-0.6L/s,
25
highly variable across patients with COPD and overall reliable at all standardized anatomic
26
locations. In future, RS should be assessed in patients with COPD using this target airflow and
27
these anatomic locations. More studies are needed to draw definite conclusions on airflow
28
standards for recording RS in patients with COPD and with other respiratory diseases.
29
30
For Peer Review
13
ACKNOWLEDGMENTS
1
The authors would like to acknowledge all patients involved for their participation in this
2
research. We are also very grateful to Ana Oliveira for her contributions in data collection and to
3
Cátia Pinho for her assistance in data analysis.
4
5
6
CONFLITS OF INTEREST7
None.8
REFERENCES9
1. Vestbo J, Hurd SS, Agustí AG, Jones PW, Vogelmeier C, Anzueto A, et al. Global
10
Strategy for the Diagnosis, Management, and Prevention of Chronic Obstructive
11
Pulmonary Disease. Am J Respir Crit Care Med 2013;187(4):347-365.
12
2. Zwick RH, Burghuber OC, Dovjak N, Hartl S, Kossler W, Lichtenschopf A, et al. The
13
effect of one year outpatient pulmonary rehabilitation on patients with COPD. Wien Klin
14
Wochenschr 2009;121(5-6):189-195.
15
3. Calverley PM, Boonsawat W, Cseke Z, Zhong N, Peterson S, Olsson H. Maintenance
16
therapy with budesonide and formoterol in chronic obstructive pulmonary disease. Eur
17
Respir J 2003;22(6):912-919.
18
4. Jones PW, Agusti AG. Outcomes and markers in the assessment of chronic obstructive
19
pulmonary disease. Eur Respir J 2006;27(4):822-832.
20
5. Bohadana A, Izbicki G, Kraman SS. Fundamentals of Lung Auscultation. N Engl J Med
21
2014;370(8):744-751.
22
6. Munakata M, Ukita H, Doi I, Ohtsuka Y, Masaki Y, Homma Y, et al. Spectral and
wave-23
form characteristics of fine and coarse crackles. Thorax 1991;46(9):651-657.
24
7. Bettencourt PE, Delbono EA, Spiegelman D, Hertzmark E, Murphy RLH. Clinical utility
25
of chest auscultation in common pulmonary-diseases. Am J Respir Crit Care Med
26
1994;150(5):1291-1297.
27
8. Murphy RLH, Jr. Special articles: in defense of the stethoscope. Respir Care
28
2008;53(3):355-369.
For Peer Review
14
9. Jácome C, Marques A. Computerized Respiratory Sounds in Patients with COPD: A
1
Systematic Review. COPD 2015;12(1):104-112.
2
10. Morillo DS, Leon Jimenez A, Moreno SA. Computer-aided diagnosis of pneumonia in
3
patients with chronic obstructive pulmonary disease. J Am Med Inform Assoc
4
2013;20(e1):e111-117.
5
11. Kraman SS. THe relationship between airflow and lung sound amplitude in normal
6
subjects. Chest 1984;86(2):225-229.
7
12. Gavriely N, Cugell DW. Airflow effects on amplitude and spectral content of normal
8
breath sounds. J Appl Physiol 1996;80(1):5-13.
9
13. Benchetrit G. Breathing pattern in humans: diversity and individuality. Respir Physiol
10
2000;122(2-3):123-129.
11
14. Rossi M, Sovijärvi ARA, Piirilä P, Vannuccini L, Dalmasso F, Vanderschoot J.
12
Environmental and subject conditions and breathing manoeuvres for respiratory sound
13
recordings. Eur Respir Rev 2000;10(77):611-615.
14
15. Dames KK, Lopes AJ, de Melo PL. Airflow pattern complexity during resting breathing in
15
patients with COPD: effect of airway obstruction. Respir Physiol Neurobiol
2014;192:39-16
47.
17
16. Miller MR, Hankinson J, Brusasco V, Burgos F, Casaburi R, Coates A, et al.
18
Standardisation of spirometry. Eur Respir J 2005;26(2):319-338.
19
17. Fiz JA, Gnitecki J, Kraman SS, Wodicka GR, Pasterkamp H. Effect of body position on
20
lung sounds in healthy young men. Chest 2008;133(3):729-736.
21
18. Vyshedskiy A, Murphy R. Crackle Pitch Rises Progressively during Inspiration in
22
Pneumonia, CHF, and IPF Patients. Pulm Med 2012;2012:240160. .
23
19. Sovijarvi ARA, Vanderschoot J, Earis JE. Standardization of computerized respiratory
24
sound analysis. Eur Respir Rev 2000;10(77):585.
25
20. Pinho C, Oliveira A, Oliveira D, Dinis J, Marques A. Lungsounds@UA Interface and
26
Multimedia Database. IJEHMC 2014;5(1):81-95.
27
21. Vannuccini L, Rossi M, Pasquali G. A new method to detect crackles in respiratory
28
sounds. Technol Health Care 1998;6(1):75-79.
For Peer Review
15
22. Hadjileontiadis LJ, Rekanos IT. Detection of explosive lung and bowel sounds by
1
means of fractal dimension. Signal Processing Letters, IEEE 2003;10(10):311-314.
2
23. Lu X, Bahoura M. An integrated automated system for crackles extraction and
3
classification. Biomed Signal Process Control 2008;3(3):244-254.
4
24. Quintas J, Campos G, Marques A. Multi-algorithm Respiratory Crackle Detection,
5
HEALTHINF, Barcelona, 2013. SciTePress.
6
25. Taplidou SA, Hadjileontiadis LJ. Wheeze detection based on time-frequency analysis of
7
breath sounds. Comput Biol Med 2007;37(8):1073-1083.
8
26. Pasterkamp H, Powell RE, Sanchez I. Lung sound spectra at standardized air flow in
9
normal infants, children, and adults. Am J Respir Crit Care Med 1996;154(2 Pt
1):424-10
430.
11
27. Sanchez I, Vizcaya C. Tracheal and lung sounds repeatability in normal adults. Respir
12
Med 2003;97:1257-1260.
13
28. Levine TR, Hullett CR. Eta Squared, Partial Eta Squared, and Misreporting of Effect
14
Size in Communication Research. Human Communication Research
2002;28(4):612-15
625.
16
29. Cohen J. Statistical power analysis for the behavioural sciences. New York: Academic
17
Press; 1969.
18
30. Rankin G, Stokes M. Reliability of assessment tools in rehabilitation: an illustration of
19
appropriate statistical analyses. Clin Rehabil 1998;12(3):187-199.
20
31. Fleiss J. Reliability of measurement. In: Fleiss J, editor. Design and analysis of clinical
21
experiments. New York: John Wiley & Sons, 1986:1-32.
22
32. Bland JM, Altman DG. Statistical methods for assessing agreement between two
23
methods of clinical measurement. Lancet 1986;1(8476):307-310.
24
33. Bonett DG. Sample size requirements for estimating intraclass correlations with desired
25
precision. Stat Med 2002;21(9):1331-1335.
26
34. Lovie P. Coefficient of Variation. In: Everitt BS, Howell DC, editors. Encyclopedia of
27
Statistics in Behavioral Science: John Wiley & Sons, Ltd, 2005:317–318.
28
35. Abdi H. Coefficient of Variation. In: Salkind NJ, editor. Encyclopedia of Research
29
Design. Thousand Oaks, CA: SAGE Publications, Inc., 2010:170-172.
For Peer Review
16
36. Kelley K. Sample size planning for the coefficient of variation from the accuracy in
1
parameter estimation approach. Behav Res Methods 2007;39(4):755-766.
2
37. Ploysongsang Y, Pare JAP, Macklem PT. Correlation of regional breath sounds with
3
regional ventilation in emphysema. Am Rev Respir Dis 1982;126(3):526-529.
4
38. Vyshedskiy A, Ishikawa S, Murphy RL, Jr. Crackle pitch and rate do not vary
5
significantly during a single automated-auscultation session in patients with pneumonia,
6
congestive heart failure, or interstitial pulmonary fibrosis. Respir Care
2011;56(6):806-7
817.
8
39. Piirila P, Sovijarvi A. Crackles: recording, analysis and clinical significance. Eur Respir J
9
1995;8(12):2139-2148.
10
40. Pavia D, Agnew JE, Lopez-Vidriero MT, Clarke SW. General review of tracheobronchial
11
clearance. Eur J Respir Dis Suppl 1987;153:123-129.
12
41. Meslier N, Charbonneau G, Racineux JL. Wheezes. Eur Respir J
1995;8(11):1942-13
1948.
14
42. Beck R, Gavriely N. The Reproducibility of Forced Expiratory Wheezes. Am Rev Respir
15
Dis 1990;141(6):1418-1422.
16
43. Dal Negro RW, Turati C, Micheletto C, Menegoni F. Effects of tiotropium and formoterol
17
on quiet breathing pattern assessed by optoelectronic plethysmography in COPD
18
patients: a pilot study. Ther Adv Respir Dis 2012;6(2):97-105.
19
44. Diaz O, Villafranca C, Ghezzo H, Borzone G, Leiva A, Milic-Emil J, et al. Role of
20
inspiratory capacity on exercise tolerance in COPD patients with and without tidal
21
expiratory flow limitation at rest. Eur Respir J 2000;16(2):269-275.
22
45. Diaz O, Villafranca C, Ghezzo H, Borzone G, Leiva A, Milic-Emili J, et al. Breathing
23
pattern and gas exchange at peak exercise in COPD patients with and without tidal flow
24
limitation at rest. Eur Respir J 2001;17(6):1120-1127.
25
46. Schlegelmilch R, Kramme R. Pulmonary Function Testing. In: Kramme R, Hoffmann
K-26
P, Pozos R, editors. Springer Handbook of Medical Technology: Springer Berlin
27
Heidelberg, 2011:95-117.
For Peer Review
17
47. Hill K, Jenkins SC, Philippe DL, Shepherd KL, Hillman DR, Eastwood PR. Comparison
1
of incremental and constant load tests of inspiratory muscle endurance in COPD. Eur
2
Respir J 2007;30(3):479-486.
3
48. Vlemincx E, Diest I, Bergh O. Imposing Respiratory Variability Patterns. Appl
4
Psychophysiol Biofeedback 2012;37(3):153-160.
5
49. Pasterkamp H, Sanchez I. Effect of gas density on respiratory sounds. Am J Respir Crit
6
Care Med 1996;153(3):1087-1092.
7
50. Piirila P, Sovijarvi AR, Kaisla T, Rajala HM, Katila T. Crackles in patients with fibrosing
8
alveolitis, bronchiectasis, COPD, and heart failure. Chest 1991;99(5):1076-1083.
9
51. Marques A, Bruton A, Barney A. Reliability of lung crackle characteristics in cystic
10
fibrosis and bronchiectasis patients in a clinical setting. Physiol Meas 2009;30:903-912.
11
52. Stockhorst U, Huenig A, Ziegler D, Scherbaum WA. Unconditioned and conditioned
12
effects of intravenous insulin and glucose on heart rate variability in healthy men.
13
Physiol Behav 2011;103(1):31-38.
14
53. Lapatki BG, Stegeman DF, Jonas IE. A surface EMG electrode for the simultaneous
15
observation of multiple facial muscles. J Neurosci Methods 2003;123(2):117-128.
16
54. Sapey E, Stockley RA. COPD exacerbations · 2: Aetiology. Thorax 2006;61(3):250-258.
17
55. Vyshedskiy A, Alhashem RM, Paciej R, Ebril M, Rudman I, Fredberg JJ, et al.
18
Mechanism of inspiratory and expiratory crackles. Chest 2009;135(1):156-164.
19
56. Sovijärvi ARA, Dalmasso F, Vanderschoot J, Malmberg LP, Righini G, Stoneman SAT.
20
Definition of terms for applications of respiratory sounds. Eur Respir Rev
21
2000;77(10):597-610.
22
57. Marques A, Oliveira A, Jácome C. Computerized adventitious respiratory sounds as
23
outcome measures for respiratory therapy: a systematic review. Respir Care
24
2014;59(5):765-776.
For Peer Review
18
Figure captions
1
Figure 1 – Bland and Altman plots of inspiratory normal respiratory sounds intensity, mean
2
number of crackles and mean number of wheezes between two recordings at three distinct
3
airflows: spontaneous; 0.4-0.6L/s and 0.7-1L/s. The bold line represents the mean difference
4
and the dotted lines the 95% limits of agreement (95%LA). CR, crackles; NRS, normal
5
respiratory sounds; dB, decibels; WH, wheezes.
6
Figure 2 – Bland and Altman plots of expiratory normal respiratory sounds intensity, mean
7
number of crackles and mean number of wheezes between two recordings at three distinct
8
airflows: spontaneous; 0.4-0.6L/s and 0.7-1L/s. The bold line represents the mean difference
9
and the dotted lines the 95% limits of agreement (95%LA). CR, crackles; NRS, normal
10
respiratory sounds; dB, decibels; WH, wheezes.
11
Figure 3 – Bland and Altman plots of inspiratory airflow, volume and time between two
12
recordings at three distinct airflows: spontaneous; 0.4-0.6L/s and 0.7-1L/s. The bold line
13
represents the mean difference and the dotted lines the 95% limits of agreement (95%LA). Ti,
14
inspiratory time; VT, tidal volume.
15
Figure 4 – Bland and Altman plots of expiratory airflow, volume and time between two
16
recordings at three distinct airflows: spontaneous; 0.4-0.6L/s and 0.7-1L/s. The bold line
17
represents the mean difference and the dotted lines the 95% limits of agreement (95%LA). Te,
18
expiratory time; VT, tidal volume.
For Peer Review
1
Computerized respiratory sounds are a reliable marker in COPD
1
Running head: Respiratory sounds are reliable in COPD
2
Cristina Jácome1,2 PT, MSc, [email protected]; Alda Marques2,3 PT, PhD, [email protected]
3 4
1 Research Centre in Physical Activity, Health and Leisure (CIAFEL), Faculty of Sports,
5
University of Porto, Porto, Portugal
6
2 School of Health Sciences, University of Aveiro (ESSUA), Aveiro, Portugal
7
3 Cintesis.UA (Center for Health Technology and Services Research), University of Aveiro,
8 Aveiro, Portugal 9 10 Funding 11
Support for this study was provided by Fundação para a Ciência e Tecnologia (FCT – Ref.
12 SFRH/BD/84665/2012), Portugal. 13 14 Conflict-of-interest statement 15
The authors report no conflict of interests.
16
17
Contributors
18
CJ performed data collection and analysis and drafted the manuscript. AM revised it critically for
19
important intellectual content and provided final approval of the version to be published.
20 21
Corresponding author: Alda Marques, PT, MSc, PhD, Senior Lecturer, School of Health
22
Sciences, University of Aveiro (ESSUA), Agras do Crasto - Campus Universitário de Santiago,
23
Edifício 30, 3810-193 Aveiro, Portugal. Email: [email protected]
For Peer Review
2
ABSTRACT
1
Introduction: Computerized respiratory sounds (RS) have shown potential to monitor respiratory
2
status in patients with COPD. However, variability and reliability of this promising marker in
3
COPD are unknown. Therefore, this study assessed the variability and reliability of RS at
4
distinct airflows and standardized anatomic locations in patients with COPD.
5
Methods: A two-part study was conducted. Part one assessed the intra-subject reliability of RS
6
at spontaneous and target (0.4-0.6L/s and 0.7-1L/s) airflows in 13 outpatients (69.3±8.6yrs;
7
FEV1 70.9±21.4% predicted). Part two characterized the inter-subject variability and
intra-8
subject reliability of RS at each standardized anatomic location, using the most reliable airflow,
9
in a sample of 63 outpatients (67.3±10.4yrs; FEV1 75.4±22.9% predicted). RS were recorded
10
simultaneously at seven anatomic locations (trachea, right and left: anterior, lateral and
11
posterior chest). Airflow was recorded with a pneumotachograph. Normal RS intensity, mean
12
number of crackles and wheezes were analyzed with developed algorithms. Inter-subject
13
variability was assessed with the coefficient of variation (CV) and intra-subject reliability with
14
Intraclass Correlation Coefficient (ICC) and Bland and Altman plots.
15
Results: Relative reliability was moderate to excellent for normal RS intensity and mean number
16
of crackles (ICCs .66-.89) and excellent for mean number of wheezes (ICCs .75-.99) at the
17
three airflows. Absolute reliability was greater at target airflows; especially at 0.4-0.6L/s.
Inter-18
subject variability was high for all RS parameters and across locations (CV .12-2.22). RS
19
parameters had acceptable relative and absolute intra-subject reliability at the different
20
anatomic locations. The only exception was the mean number of crackles at trachea, which
21
relative and absolute reliability was poor.
22
Conclusions: RS parameters are more reliable at an airflow of 0.4-0.6L/s and overall reliable at
23
all anatomic locations. This should be considered in future studies using computerized
24
auscultation.
25
26
Key-words: computerized auscultation; respiratory sounds; normal respiratory sounds; crackles;
27
wheezes; chronic obstructive pulmonary disease; reliability.
For Peer Review
3
INTRODUCTION
1
Chronic Obstructive Pulmonary Disease (COPD) is characterized by persistent airflow limitation
2
that is usually progressive.1 The forced expiratory volume in one second (FEV1) has been
3
established as the global marker for COPD diagnosis and monitoring.1 Nevertheless, changes
4
in FEV1 in response to treatment are small in relation to its repeatability.2, 3 New clinical markers
5
are therefore needed for evaluating the effectiveness of treatments in COPD.4 These markers
6
should be simple in terms of measurement, interpretation and resources used, and have
7
acceptable reliability, to ensure that the error involved in measurement is small enough to detect
8
actual changes.4
9
Respiratory sounds (RS) are a simple, objective and non-invasive marker to assess the function
10
of the respiratory system,5 which do not require special resources beyond those typical of a
11
patient–health professional encounter. However, variation and reliability of this promising
12
marker across and within patients with COPD are still unknown.
13
It has been shown, using computerized auscultation, that in stable patients with COPD,
14
adventitious RS are mainly characterized by inspiratory crackles and expiratory wheezes.6-9
15
More recently, RS were suggested to be useful to diagnose community-acquired pneumonia in
16
this population.10 These recent studies showed that RS might have potential to monitor the
17
respiratory status of patients with COPD. However, inter-subject variability and intra-subject
18
reliability was not explored, hindering the interpretation of actual changes. In addition, RS have
19
been recorded with no control over patients’ airflows, despite the well-known influence of airflow
20
on respiratory acoustic and breathing pattern.11-13
21
Computerized respiratory sound analysis (CORSA) guidelines recommend recordings with an
22
inspiratory and expiratory peak airflow of 1–1.5L/s or 10–15% of the predicted maximum peak
23
expiratory airflow.14 However, it is unknown if the airflow recommended suit the breathing
24
pattern specificities of patients with COPD. It has been shown that breathing pattern in patients
25
with COPD has reduced complexity compared with healthy subjects,15 which may affect RS
26
reliability at different airflows. CORSA guidelines also standardized seven anatomic locations
27
(trachea; right and left: anterior, lateral and posterior chest) to record RS.14 Nevertheless,
inter-28
subject variability and intra-subject reliability of RS at each anatomic location in patients with
29
COPD has never been investigated. To address these relevant research needs, this study
For Peer Review
4
assessed the i) intra-subject reliability of breathing pattern and RS at distinct airflows and ii)
1
inter-subject variability and intra-subject reliability of RS at each standardized anatomic location
2
in patients with COPD.
3
METHODS
4
Study design
5
A two-part study was conducted. Part one assessed the intra-subject reliability of breathing
6
pattern and RS at three distinct airflows, using a small sample of outpatients with COPD. Part
7
two characterized the inter-subject variability and intra-subject reliability of RS at each anatomic
8
location, using the most reliable airflow from part 1 and a larger sample of outpatients with
9
COPD.
10
Participants
11
Outpatients with COPD were recruited from two primary care centers. Inclusion criteria were
12
diagnosis of COPD according to the Global Initiative for Chronic Obstructive Lung Disease
13
(GOLD) criteria (presence of a post-bronchodilator FEV1/FVC<0.70)1 and clinical stability for 1
14
month prior to the study (no hospital admissions, exacerbations as defined by the GOLD1 or
15
changes in medication for the respiratory system). Patients were excluded if they presented
co-16
existing respiratory diseases or had severe neurological, musculoskeletal or psychiatric
17
impairments. Approval for this study was obtained from the ethics committee of the Center
18
Health Regional Administration (2013-05-02) and from the National Data Protection Committee
19
(3292/2013). Eligible patients were identified via clinicians and then contacted by the
20
researchers, who explained the purpose of the study and asked about their willingness to
21
participate. When patients agreed to participate, an appointment with the researchers was
22
scheduled. Written informed consent was obtained prior to data collection.
23
Data collection
24
Socio-demographic, anthropometric (height and weight) and clinical (smoking habits, dyspnea,
25
exacerbations in the past 3 months and in the previous year, medication) data were first
26
recorded in the two study parts. Then, airflow and RS were collected. Lung function was
27
assessed with spirometry (MicroLab 3500, CareFusion, Kent, UK) according to standardized
28
guidelines.16 Patients were classified in 4 groups (A, B, C, D) using the GOLD combined
For Peer Review
5
assessment (symptoms-mMRC, spirometry and risk of exacerbations).1 All assessments were
1
performed by two physiotherapists and the order was standardized.
2
Part one
3
Airflow and RS were acquired simultaneously. Recordings were performed at spontaneous
4
airflow, at a peak of 0.4-0.6L/s (typical tidal airflow range), and at a peak of 0.7-1L/s (modestly
5
increased airflow). Similar target airflows have been used in previous research.17 After 5-min of
6
quiet sitting, the three distinct airflows were acquired following the standardized order:
7
spontaneous, 0.4-0.6L/s and 0.7-1L/s. Spontaneous breathing was tested first, so it would not
8
be influenced by the target airflows and the order of the two target airflows was selected based
9
on the increased airflow demand. Patients were in a seated-upright position, wearing a nose clip
10
and breathing through a mouthpiece connected to a heated pneumotachograph (3830, Hans
11
Rudolph, Inc., Shawnee, KS, USA). For each airflow, patients performed three trials of 20
12
seconds each18, followed by a 2-min recovery period. During spontaneous airflow, patients were
13
instructed to breathe normally and biofeedback of the flow signal was not presented. During
14
target flows, patients had visual biofeedback of the flow signal (RSS 100R Research
15
Pneumotach System, Hans Rudolph, Shawnee, KS, USA) and were instructed to maintain the
16
flow between two horizontal lines. Recording of each target flow was preceded by a training
17
phase of at least 3 breathing cycles.
18
RS recordings followed CORSA guidelines for short-term acquisitions14 and were performed
19
simultaneously at seven anatomic locations (trachea; right and left anterior chest; right and left
20
lateral chest; right and left posterior chest)19 using the LungSounds@UA interface.20 Seven
21
stethoscopes (Classic II S.E., Littmann®, 3M, St. Paul, MN, USA), with a microphone
22
(frequency response between 20Hz and 19kHz - TOM-1545P-R, Projects Unlimited, Inc.®,
23
Dayton, OH, USA) and preamplifier circuit (Intelligent Sensing Anywhere®, Coimbra, PT) in the
24
main tube, were attached to the patient’s skin with adhesive tape (Soft Cloth Surgical Tape, 3M,
25
St. Paul, MN, USA). The analogue sound signals were further amplified and converted to digital
26
by an audio interface (M-Audio® ProFire 2626, Irwindale, CA, USA). The signal was converted
27
with a 24-bit resolution at a sampling rate of 44.1kHz and recorded in .wav format.
28
Part two
For Peer Review
6
Airflow and RS were acquired simultaneously at the most reliable airflow identified in part one of
1
the study. The same procedures from part one were followed.
2
Signal processing
3
All files were processed using algorithms written in Matlab®R2009a (Mathworks, Natick, MA,
4
USA). Breathing phases were automatically detected using the positive and negative airflow
5
signals. Mean inspiratory and expiratory time were then calculated. The mean airflows and tidal
6
volumes were calculated per breathing phase using flow and volume raw signals. To combine
7
the detected breathing phases with sound signals, the flow signals were timed synchronized
8
with tracheal sound signals. Due to the simultaneous acquisition of RS at the seven locations,
9
the breathing phases detected on tracheal sounds were applied to the other six locations.
10
Crackles were detected using a multi-algorithm technique based on established algorithms.21-23
11
This multi-algorithm technique showed a 7% performance improvement over the best individual
12
algorithm.24 Wheezes were detected using an algorithm based on time-frequency analysis.25
13
The mean number of crackles and wheezes per breathing phase was extracted. After excluding
14
these adventitious sounds, normal respiratory sounds (NRS) were analyzed based on the
15
methodology proposed by Pasterkamp26 and the mean intensity was determined within a
16
frequency band of 100 to 2000Hz.26, 27
17
Statistical analysis
18
All statistical analyses were performed using IBM SPSS Statistics version 20.0 (IBM
19
Corporation, Armonk, NY, USA). The level of significance was set at 0.05.
20
Part one
21
Descriptive statistics were used to characterize the sample. Inspiratory and expiratory mean
22
airflow, tidal volume and time were determined by computing the mean of the three recordings
23
at each airflow. The mean NRS intensity, mean number of crackles and mean number of
24
wheezes per breathing phase were determined by computing the mean of the three recordings
25
at all anatomic locations. One-way repeated measures ANOVA was used to analyze differences
26
in the breathing pattern and RS across airflows. When a statistically significant difference was
27
found, Bonferroni post hoc tests were performed. Statistical analysis was completed with the
28
estimation of effect sizes. The effect size was computed via Partial eta-squared as it is the index
For Peer Review
7
more commonly reported for analysis of variance with repeated measures.28 Partial eta-squared
1
was interpreted as small (ƞ2≥0.01), medium (ƞ2≥0.06) or large (ƞ2≥0.14) effect.29
2
As recommended for intra-subject reliability,30 both relative, with Intraclass Correlation
3
Coefficient (ICC), and absolute reliability, with Bland and Altman method, were used. The ICC
4
equation (1, K) was used, where k=3 since three recordings were performed for each airflow.
5
ICC was interpreted as excellent (>0.75), moderate to good (0.4-0.75) or poor (<0.4).31 Bland
6
and Altman method assesses the agreement between two sets of measures.32 Thus, random
7
numbers were generated in Matlab to delete one recording. Bland and Altman plots were
8
created to analyze the distribution of results (GraphPad Prism version 5.01, GraphPad
9
Software, Inc., La Jolla, CA, USA).32
10
Sample size was determined as described by Bonett.33 A sample size of 13 subjects was
11
required to estimate an ICC of 0.9 with a 95% confidence interval width of 0.2 (α=0.05 and
12 k=3).33 13 14 Part two 15
Descriptive statistics were used to characterize the sample. The mean NRS intensity, mean
16
number of crackles and mean number of wheezes per breathing phase were determined by
17
computing the mean of the three recordings for each anatomic location (trachea, anterior right
18
and left, lateral right and left, posterior right and left). The inter-subject variability in RS
19
parameters was measured with the coefficient of variation (CV), as it is useful for analyzing the
20
variability of measures, independently of the magnitude of the data.34 It is defined as the
21
standard deviation divided by the mean.35 The relative and absolute intra-subject reliability of
22
RS parameters were computed, as described above, per anatomic location.
23
Sample size for the CV was estimated using the approach of Kelley.36 Using data from part one,
24
it was found that the CV of NRS intensity was between 0.17 and 0.25. It was determined that a
25
minimum of 59 individuals was needed for a CV of 0.25 with a 95% confidence interval width of
26 0.1 (α=0.05).36 27 28 RESULTS 29 Part one 30