0
A Work Project, presented as part of the requirements for the Award of an International Master Degree in Management from the NOVA – School of Business and Economics
and INSPER - Institute of Education and Research
LAST-MILE DELIVERY IN FAVELAS: AN EXPLANATORY STUDY WITH BRAZILIAN COMPANIES
CRISTIANO FLORES E SILVA – 3638
A project carried out on the Master in Management Program, under the supervision of Professors Jose Crespo de Carvalho from NOVA School of Business and Economics,
and Andre Duarte from INSPER - Institute of Education and Research
1
ABSTRACT
In urban logistics, the last-mile delivery from warehouse to the consumer's home has become more and more challenging with the continuous growth of urbanization, particularly in developing countries when addressing the logistical difficulties of distributing products in low-income population. This work presents an approach how companies distribute products within brazilian Favelas. Delivering products in these scenarios are not an easy task, high concentration of households without formal urbanization imposes hurdles to find and access to specific location added to the high number of cargo stolen, leads to lot of obstacles in this last mile operations. The company’s strategies are found by matching product type with Favela type in quadrants in the Conditions Decision Matrix. The results showed an emergent proposed model from data based on theory that helps to understand the last-mile delivery in Favelas having the risk as the moderator factor of logistics performance. The paper highlights that companies do not change information, practices neither synergies between their distribution models as well as do not relate to communities in, for example, social actions, in the vast majority of cases. It concludes by mapping the practical strategies applicable for the companies in the last-mile.
Keywords: last-mile delivery, favelas, mapping strategies, risk. 1. INTRODUCTION
Urban centers concentrate a large amount of world population and for this reason they potentiate the global economy, forcing organizations to focus on strategies to serve the urban customers' needs with products and services in an increasing demand that are rising year by year.
This continuous growing is particularly complex in emergent economies, where in 2012 the urban population numbered 79% of inhabitants with the prospection to achieve 85% in 2030 (Blanco & Fransoo, 2013). These new urban centers already represent a huge market that are changing the world economy core to these developing region, where the urbanization process occurred more slowly than develop countries.
Blanco & Fransoo (2013) reinforce this idea, highlighting that the development of appropriate infrastructure policies to support the urban population growth presents a significantly slower pace in the emerging world, which lacks essential investments for the movement of cargo and people. In addition, a shortage of space combined with social inequalities leads to an unbalanced evolution of urbanization which, consequently, generates limited accessibility to public roads and traffic congestion as main symptoms.
These complexities of urban logistics bring risks, but also opportunities, especially in the last-mile delivery, which represents the final segment of the supply chain, where finished goods are transferred to the final consumers that ordered and purchased them. Although it
2
seems a simple task, there are a myriad of inefficiencies generated in the last mile, bringing complexities that can represents 40% of the companies' total logistical costs (Mantey, 2017).
Realizing these difficulties of operation in the large urban centers of emerging markets, this paper seeks to understand which are the distribution strategies of last-mile delivery in the Brazilian Favelas that add up to 11.7 million inhabitants, capable of handling around 63 billion reais for year (Meirelles & Athayde, 2014). This high concentration of low-income families in regions without formal urbanization imposes barriers to access to the final consumer (precarious infrastructure, difficulties of access, insecurity, relief and unidentified alleys), resulting that the residents in these areas end up suffering with several restrictions of products offering. Thus, becoming the favelas disconnected from the economic center of the metropolis (Glaeser, 2016).
Retail companies often face these last-mile logistical obstacles in Favelas, most evidenced by the barriers of access and risks of these operations. Thus, these areas represent one of the best examples of the challenges of distribution in urban areas of megacities in emerging countries, with high consumption potential and demand for products, where urban distribution models are not able to leverage efficiency and accessibility into to these critical areas.
The research presents an emergent proposed model that allow us to understand, through constant comparison between theory and practical data, the strategies used by companies to distribute products in Favelas, seeking to give visibility to the criteria adopted and their particularities of last-mile delivery. Our approach works in categorizing the data from interviews generating categories that combining with theoretical data an empirical study of last-mile delivery in Favelas that as main contribution brings the last-mile conditions and decisions as correlated factor leading to the strategies used in the field by having the Favela risk as a moderator factor to achieve logistics performance. The results show us that companies don’t work together and synergistically to reduce costs and improve service level with benchmarking, and the relationship within Favela is not considered as fundamental, even if it identifies its relevance to the last-mile operations.
The remainder of this paper is organized as follows: Section 2 ‘Literature review’ presents the theoretical data and problem definition. Section ‘Methodology’ describes the techniques are proposed. Section 4 ‘Results and Discussion’ describes the emergent proposal model and the strategies applicable to achieve the last-mile regarding each condition found and the implications as well as along the section a list of quotes to reinforce our empirical evidences. Section 5 ‘Concludes’ the paper with limitations and future work.
3
2. LITERATURE REVIEW 2.1 Last-Mile Delivery
The last-mile delivery is defined as the movement of goods from a distribution center (DC) to the final delivery destination, which is typically a residence, representing the last stage of supply chain (Boyer et al., 2005). The convenience brought for the e-commerce, the density and congestion in urban areas, the requirements for more flexible and reliable deliveries in shorter delivery times, and the barriers of access to reach the final customers have forced companies to use the distribution system more efficiently, mainly facing the last-mile problem.
According to Blanco and Merchan (2015) the last mile distribution systems are naturally considered as networks: a collection of nodes (distribution centers) and links (roads) on which goods circulate using vehicles with specific technologies, being these logistical networks designed to serve customers directly from the DCs (main node) through a standardized fleet to the connections (demand points) along the roads.
Boyer et al. (2005) sees the last-mile delivery as one of the most expensive, inefficient, and polluting parts of downstream supply chain process. This is because, firstly, for home deliveries there is a high degree of failed deliveries due to the absence of a recipient of the order, which leads to additional costs of re-orders or returns. A second problem is that door-to-door deliveries can create a high degree of vehicle idleness, which is almost never at full capacity because orders do not generate a profitable and efficient routing plan.
Gevaers, Van de Voorde & Vanelslander (2009) analyzed the key characteristics of last-mile delivery within the companies' logistics chain, showing that there are key factors in optimizing their delivery process in urban centers, which, if well planned, operationalized and anticipated can reduce inefficiencies based on the cost structure problems of their operations. Among the highlighted factors, the level of security required to deliver the orders to customers, whether from the point of view of the safety of the goods or the persons enabled and available to receive the products stands out as fundamental to the present study, since it is related to risk. Another key factor to be highlighted is the elevated levels of delivery failures when the request receiver is not present. Carriers are forced to make two or three new delivery attempts within the same route, implying high distribution costs in the last-mile logistics due to the high number of miles driven dedicated to only one delivery.
The use of technology to obtain process visualization and information from its operation is a decisive source of decision making, such as optimization of routing, GPS in vehicles with traffic information or use of RFID in products (Blanco & Merchan, 2015). The technology allows the delivery person to be informed about product collections along the route or the
4
schedule that the customer wants to receive the product in case something goes wrong. The use of these forms of communication in real time in most cases means considerable time savings within the last-mile structure cost and can still increase the level of reliability in deliveries.
2.2 Urban last mile distribution systems
The resulting problems in the last-mile have become bottlenecks in the final delivery of products in urban areas, thus altering the entire transportation and inventory management of companies. They now need, indeed, instead of delivering to distributor, deliver to the final customers, performing the last-mile delivery, a key role in the transportation strategy of whole supply chain.
Therefore, urban delivery systems can be characterized as a type of location-routing problem (LRP) (Lin & Kwok, 2006). Drexl & Schenneider (2014) emphasize that a solution for urban deliveries and the LRP must necessarily stress a strategic dimension in numbers, types and locations of DCs, for instance. There is also a need to target different types of vehicles, ranging, for example, from UDV (urban delivery vehicle) to motorcycles, with routing optimization based on demand forecasting.
Boccia et al. (2010), Drexl & Schneider (2014, 2015) and Prodhon & Prins (2014) are some of the authors who have presented the introduction of new models combining more than two ties in the chain, bringing the multi-echelon LRP being one of the most common strategies in the deployment of urban distribution networks currently used. Fig. 1 exemplifies the designs of urban distribution networks in the last-mile logistics, exemplifying the conception of distribution strategies more realistic and flexible, bringing greater efficiency to operate in the unpredictable urban centers (Winkenbach et al., 2015). Multi-echelon distribution systems have emerged as an alternative to serve complex urban zones. Fundamentally, these systems imply the use of two strategies: i) different freight transportation modes along the delivery route, and ii) Urban Logistics Space (ULS) to consolidate and transship freight (Merchan, 2015).
5
The development of the ULSs, which are spaces located in dense urban areas, such as small terminals, providing logistical services to the businesses of the central regions and their residents, allows the transhipment and consolidation of goods in the last mile delivery. Its implementation generally utilizes already existing structures such as the underground parking lots (Dablanc, 2011). Its implementation aims to optimize the circulation of products in the cities, and is dedicated to the replenishment of the flow of goods that circulate around the city, offering specialized logistics services, such as storage, handling, parking for vehicles and transportation, among others (Chan et al., 2012).
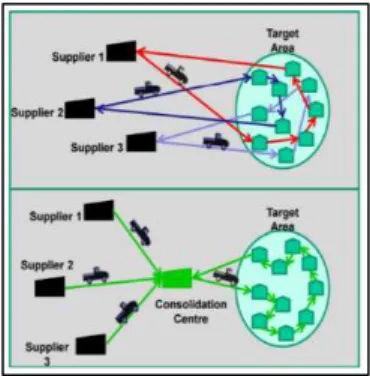
Allen et al. (2012) bring the model of Urban Consolidation Centers, (UCC), which has been a popular solution in this context of high density urban areas, motivated by the need to better utilize the load capacity of vehicles. UCCs are described as logistical platforms used to consolidate and transfer freight, with storage function, from external locations, outside the city center, in direction to small locations in the middle of the downtown. These platforms can also be described as micro location centers, micro consolidation centers (Janjevic et al., 2013), freight distribution centers or urban distribution centers (Allen et al., 2012). Fig. 2 illustrates the interaction of these authors in the distribution strategy in urban areas, showing an operation without the use of UCC and righ away its applicability. Crainic (2003) defines the consolidation model as locations where the goods are transshipping from a normal truck for vehicles with lower freight capacity, the city-freighters, being able to travel along the narrow and crowded streets of the city center to perform as activities according to the need for reverse operations.
Fig. 2. Urban consolidation model – UCC (taken from https://coe-sufs.org/wordpress/wp-ontent/uploads/2014/05/UCC-UK-webinar.pdf).
According to Holguín-Veras et al. (2016), the combination of these approaches of urban last mile delivery offers innumerable benefits associated to the use of urban space as: increase in the number of deliveries on schedule, a reduction in the cycle of orders for customers, reduction of the fuel consumption by transporters, reduction of kilometers driven by each route of delivery, reduction of the number of vehicles circulating and reduction of CO2 emissions.
6
2.3 Logistics Risks
Having the ability to manage the unexpected is one of the great challenges of supply chains. These skills of detection, reaction and adaptation, according to Sheffi (2015) help corporations thrive in a complex and dynamic global economy. Global megatrends such as technological advancement, strong urbanization in emerging countries, demographic shifts in consumption, eminent risks of virtual attack, and the increasing number of cargo thefts have made this challenge ever more difficult. All factors are brought a substantial increase in concern for safety and increased transportation costs (Logistics Trend Radar, 2016).
Bordin (2008) points out that the most requested modal for cargo transport and distribution in Brazil is the roadway, being the most expressive in the logistic activity due to its flexibility, agility and capacity to reach all points of the national territory. However, one of its main risks, which becomes relevant for the study, is the theft of cargo and its consequences in the companies supply chain.
According to FreightWatch International (2013), Brazil is one of the countries with the highest risk of cargo theft worldwide, with estimated losses of over 280 million of dollars each year. The city of Sao Paulo is the one with the largest number of cargo thefts and the city of Rio de Janeiro the largest financial losses in the country, these threats being an aspect typically rooted in the social, economic and cultural conditions in the country.
The prevention of cargo theft requires a thorough knowledge of incident trends in a regional database, because security programs and risk management techniques may not always be able to use data from region to region because the various levels of threats. In this way, it is up to companies to gather information in a careful way, adapting their security programs focused on the risks present in their operations.
The city of Rio de Janeiro, in 2015, closed with an expressive increase in the number of occurrences of cargo theft, going over than 7 thousand cases (ISP, 2016), as shown in Fig. 3. Because of the significant increase in cargo occurrences, an increase in the same proportions in logistics costs by the companies and reduction of sales by the industry, thus, reducing the performance and efficiency of the delivery process. Nowadays, in the state of Rio de Janeiro, more than one truck is robbed per hour, according to data from the Federation of Industries of Rio (Firjan, 2017). According to Trade Union of Freight Transport Companies of Rio de Janeiro (Sindicarga, 2017), in the last 12 months, the freight expenses in the state of Rio rose between 30% and 35% for the companies in the sector, showing the actual uncontrolled situation.
7
Fig. 3. Cargo theft statistics in the city of Rio de Janeiro (taken from Instituto de Segurança Pública do Estado do Rio – ISP, 2016)
E-commerce, for example, is losing business in the state also because of the increase in cargo theft. Online stores have begun to restrict deliveries in high-risk areas. According to the Sindicarga (2017), "It is the CEP of hell". When a purchase order is made through the internet, it is customary for the consumer to inform the ZIP Code (CEP) before closing the order. What has happened, especially in Rio, is that some stores, when they detect that the CEP is in a place of risk, warn that they do not deliver the product at that address, due to the eminence of the robbery and the related high logistics costs. According to the State of Sao Paulo, between January and June of this year, online commerce sales in the state fell 1%, due to the increase in the number of cargo thefts, thus affecting retail sales.
Therefore, systems and methods of distribution developed for the last-mile of large cities cannot always be replicated within favelas, due their unique characteristics, making it necessary to have a correct understanding in the form of relations that explain what strategies are practiced and processes developed by brazilian companies with a view to overcoming these barriers, thus, seeking business opportunities. The Favela risk shows up as a moderator factor that leverage the las-mile problem becoming more and more out of control. According to Firjan (2017), risk areas are running a serious risk of products shortages, especially of the most stolen goods.
2.4 The Favelas
The favelas in Brazil experience continuous income growth and, consequently, increasing consumption potential in recent years (Meirelles & Athayde, 2014). Its consumers constitute new market patterns, reinvent economic activities and contribute decisively to the profile of emerging countries. However, most of them have limited consumption opportunities due to infrastructure hurdles and high logistical costs that companies face to reach the last mile within these more critical regions.
Meirelles & Athayde (2014) point out that the favelas in Brazil have very peculiar characteristics. The Favelas constitute a set of several small streets, alleys and staircases
1936 1701 1386 1198 3003 3063 3075 3172 3390 4275 3464 4714 4622 4566 4472 3172 2650 2619 3073 3656 3534 5890 7225 0 1000 2000 3000 4000 5000 6000 7000 8000 1992 1994 1996 1998 2000 2002 2004 2006 2008 2010 2012 2014 2016 2018 Ca rg o th ef t Years
8
that are difficult to access, which consequently create obstacles for operation and increase in logistic costs, impairing the ability to effectively sell and deliver products at these points. The authors also point out that surprisingly, despite these restrictions, the average salary of the favela resident jumped 54.7% from 2003 to 2013, while in Brazil, in general, the evolution was only 37.9%, showing that in Favelas the pace of income growth is more accelerated than the “asfalto” residents. These communities are concentrated in big cities: more than 88% of their population is in the 20 most important metropolitan areas in the country (IBGE, 2010). These large populations experienced increasing income growth and, consequently, increasing consumption potential in recent years (Meirelles & Athayde, 2014). Nevertheless, most of this population can be limited in consumption opportunities due to infrastructure hurdles and high service costs.
The Favelas are attractive places for drug gangs, with their tight, winding streets, plentiful hiding places and unemployed youths looking for easy money. Thus, the high risk of these locations characterizes one of the major constraints on logistics operations to reach the final consumer, considerably increasing the cost of operation by having to draw new routes that are less optimized and inefficient from an operational point of view. According to Meirelles & Athayde (2014), it is possible to admit that the crime business works well in Favelas, representing a powerful obstacle to their social and economic development.
2.4.1 Geographic Characterization and Distribution
It is necessary to identify and determine the geographical delimitation of Favela, as there are cases in which the definition of the boundary between Favela and the formal urban environment is clear, as highlighted in Fig. 4, which shows how this occurs in the Favela of Rocinha, Rio de Janeiro-RJ, and in Paraisopolis, in Sao Paulo-SP. However, there are other clusters where it is difficult to distinguish between the community and its formal urban environment. In general, favelas occupy areas that are not conducive to urban occupation, such as steep slopes, beach areas, areas susceptible to flooding, among others. Although the geographical demarcation can be used of technical identification criteria, there are also relevant social and political factors in the process of forming Favelas.
A. Rocinha - RJ B. Paraisópolis – SP
Fig. 4. Sample of the geographical delimitation of Favelas (A. taken from
https://www.fotografiasaereas.com.br/blog/fotos-aereas-de-paraisopolis-em-sao-paulo/#jp-carousel-185346, B. taken from http://argosfoto.photoshelter.com/image/I00002Xx6XNHcMr8).
9
3 METHODOLOGY
Classification of Research
The work project follows a Grounded Theory approach as a way of thinking and investigating novel phenomena, allowing us to innovate and propose an emergent model thought interrelated relations from the literature and field data. In other words, grounded theory can be seen as a set of procedures supporting theory development through the data collection and analysis (Strauss & Corbin, 2008). Following the Pandit (1996) approach the methodology procedure was segregate in 9 distinguished steps:
Step 1 - Research design
With the general research question in mind - what strategies of last-mile delivery in Favelas – started with a set of “conceptual blocks” in order to assess and categorize the data (Turner, 1983). These blocks, which emerged from the extensive review of the literature, summarized in the previous section and focused on concepts and critical factors in the last-lime delivery of urban centers, consisting of essential elements for all data collection and analysis, being: i) Product Type, ii) Favela, iii) Geographical area, iv) Service level (v) Vehicle type, (vi) Delivery type, (vii) Delivery time, (viii) Security level and (ix) Technology used.
The ideas generated and the reflection resulting from them allowed to arrive at the main contribution of the literature review, which was the refinement and clear definition of the research question regarding the restrictions and variations of operations as well as the risks in the last-mile in Favelas.
Step 2 - Selecting companies
The second step showed the importance of selecting a database, not random, in the choice of companies interviewed. According to Glaser & Strauss (1967), the selection process must ensure that the main stakeholders in the companies, considering the purpose of the research, are addressed as interviewees. In this research, they are those who know the process in the field of transportation, logistics, supply chain and distribution having operations in Favelas.
In the study, the database included interviews with the managers of companies, being divided between shippers, carriers and last-mile of different segments and products with distinct nature, but having in common, each other, deliveries in Favelas. Fig. 5 indicates the position of the companies surveyed in the distribution chain towards the end customer, located in the favela, illustrating the different business models adopted.
10
Fig. 5. Positioning of the companies interviewed in the supply chain
In general, the interviews considered all the agents involved in a very similar way without emphasizing one or another developed model, since all were consulted and interviews followed the same interview script. In this way, the companies participating in the research are presented separately according to the role played in the logistics chain as follows: Model 1 - are responsible for the entire process, from commercialization, through transportation to final delivery. Model 2 - other companies have a carrier intermediating this final delivery process. Outsourcing the transportation. Model 3 - some surveyed companies outsource to a carrier that in turn subcontract the transportation, last-mile delivery, to the final customer within Favelas. This model also aggregates corporate risk managers and Favelas’ representative organization named Central Única de Favelas (CUFA).
Therefore, the selection of companies obeyed the criterion sampling strategy (Dubé & Pare, 2003), which identifies cases that meet useful criteria to guarantee the quality of the data collected. The logic of the criterion sampling is to identify cases or companies that meet some previously defined criteria of importance. In this study, all the selected companies must perform the last-mile delivery in Favelas. As a complement, the technique of snowball sampling was also used, where interviewees were consulted to indicate other companies that could be useful sources of information about the phenomenon studied (Lecy & Beatty, 2012).
Step 3 - Data collection
Was used discussions and findings from the existing literature work to help structure the interviews and guide the data collection process (Turner, 1983). In total, was conducted 26 semi-structured interviews with companies from different segments, constituting a primary and diversified data base in terms of type, value and volumetry of products distributed in Favelas, totaling approximately 32 hours of interaction with the interviewees, averaging 52 minutes per interview. The interviews were almost entirely recorded, for more detailed analysis, with only 4 exceptions where the analysis was based on annotations made during the respective interactions and analyzed using the Atlas.TI software. Serving as a store for
11
taped interviews, it was possible to transcribe prominent parts of greater relevance in audios without the need for full transcription of all interviews. Bringing greater practicality, agility and flexibility to the process of data analysis, since only these parts were transcribed as the basis for all analyzes and relations developed in the coding process.
The diversity in the choice of companies interviewed was precisely aimed at bringing a broader view of the practices performed and, consequently, generating more complete relationships and rigorous for the data collection. Thus, the data from 26 different sources generated the Delivered Products Matrix, Fig. 6, reflecting the diversification in the group of products delivered of the sample, serving as the basis for the analyzes. The number of companies added in the Matrix reaches 43. This is because some companies, due to their position in the supply chain, can deliver more than one type of product, eventually requiring different models and processes within the same target market – customers residents in Favelas.
The Delivered Products Matrix presents four quadrants divided according to product value (high or low) and product volumetry (small or large), showing, for each one, the number of agents involved according its range of products delivery in the last-mile. In quadrant 1 will have companies that carry products of low value and small volumetry, while at the other extreme, in quadrant 4, the products have high value and great volumetry. Although some products appear to be small in volume due to their unit weight, they are transported due to their loading and the type of vehicle used, with high volumetry. This being the criterion adopted in this study to measure and characterize the different types of products delivered in the Matrix regarding this specificity. As for value, the criterion adopted was simply the unit price of sale to the final consumer.
Fig. 6. Delivered products matrix Step 4 - Data collection overlap
This step focusing in overlapping of data collection and analysis which unsure that data are collected simultaneously and are analyzed iteratively. This overlapping allowed for adjustments to be made based as creativity on emerging findings, maintaining flexibility in
12
data collection methods. In the field work, as interviews began with enlarged questions to become more specific, with the process emerging from the data coming from the informants. As initial interviews consisted, primarily, of key themes derived from the literature, becoming more elaborated with the findings and information collected. For example, from the exit of the processes and strategies of identification, the categories that should be better explored and thus involved interviews with new respondents, increasing, the knowledge about a new concept.
Step 5 Data ordering
The interviews were ordered chronologically from the beginning of the process, to facilitate the simultaneous analysis of data, allowing a logical appreciation of the similarities and disparities of the data. The chronological ordering activity showed, for example, changes in nomenclature and terms on the same practice and on changes in the delivery process against similar conditions faced.
Step 6 – Data analysis (Coding Process)
At this stage, which is the essence of Grounded Theory process, the study was based on the method of constant comparison, coding procedures and intentional sample data. Once this has been accomplished, practices and processes have emerged in the form of theory, with the help of interpretive procedures, before they are finally written and presented (Dick, 2002).
In order to analyze the data in an organized and orderly manner, Atlas. was used as a facilitator of the storage, management and categorization of data obtained through interviews. Three levels were used (Strauss & Corbin, 1990):
Open coding was the first level where the transcribed or audited data were broken from the highlights and relevant parts of the interviews and then categorized and labeled with a name. Axial coding corresponded to the second level of coding, which involved the organization and explanation of the relationships between categories, grouping them into more comprehensive or key categories, which clearly added several subcategories, called properties, derived from open coding. For this was used the method of constant comparison, which is the heart of the process. These axial codes essentially reflect core themes linked with each initial conceptual block and related to the phenomenon under scrutiny. Selective coding - was the last step of the analysis, where a fundamental category integration was created. At this stage of the analysis, the process involved the selection of a central category, which integrated all the others. The refinement of the theoretical construction was achieved, therefore, through this integration - the axial codes - around the aggregate dimensions.
13
Step 7 – Theoretical sampling
Theoretical replication across interviews and the relations between codes and memos (Strauss & Corbin, 2008). Return to step 2 or 4, until theoretical/data saturation.
Step 8 – Research closure
In Grounded Theory, data saturation occurs when new data stops emerging through constant comparison and thus new interviews do not generate new categories of data, making the process repetitive (Strauss & Corbin, 2008). During this study, it was identified that concepts, practices and strategies translated into new categories began to saturate in interview 21. Even thought, new samples continued to be collected and analyzed until interview 26 to ensure the saturation of all variables and to make sure that new codes no longer emerge.
Once the data were saturated, it was revised, classified and integrated, with the help of memos and diagrams in the relationship of the categories. This procedure is called sorting and is an essential step because it joins the fragmented data.
Step 9 - Literature comparison
In the last phase, was compared the model that emerged from the analysis phase with the result of the literature review previously carried out. Was found similarities and reinforcements that helped corroborate some of our categories and connections among the categories.
4 RESULTS AND DISCUSSION 4.1 Aggregate dimensions
Understanding a complex and individual phenomenon such as the distribution of products within the Favelas, demanded many analyzes from data collection in a wide variety of companies. In the developed of Grounded Theory process, which resulted in the emergent proposed model and the mapping of the last-mile delivery conditions in Favelas, that will be presented, the understand in how categories and subcategories became connected from conceptual blocks to axial codes became clear, resulting in distribution strategies that emerged from the selective codes in the aggregate dimensions. The connections between literature and data collected was crucial in the understanding about last-mile in Favelas.
A Fig. 7 summarizes, just a small part, the associations between the initial conceptual blocks, the axial codes emerging from the data, and the final proposed aggregate dimensions. The figure also shows the frequency of occurrence of the codes identified by the procedure using Atlas.TI. For instance, the conceptual block “type of product” gave rise to two distinct axial codes as the interviews were analyzed and the frequency with which the statements appeared in the data collected related to the extent to which interviewees perceived that achieving high impact would entail substantial cost. Analyzing all the
14
statements that frequently appeared in the data, was detected 19 instances in which interviewees mentioned the “aggregate value of load” within the open codes, forming the category described (this code appeared in 4.8% of all frequently coded statements). Based on their existing similarities, was emerged these two codes to form the aggregate dimension “last-mile conditions”. A similar process was used for all the other initial conceptual blocks forming in the end of process two aggregate dimensions mile conditions” and “last-mile decisions”.
Fig. 6: Codes, frequency of appearances (#), and aggregation
The risk factor, Favela Risk, emerged as a central theme in the last-mile, being a moderator variable of all practices and strategies developed by the companies. Risks regarding the conditions in Favelas such as accesses (relief, streets, alleys, staging points and etc.) and security (robberies, crime, stolen cargo, etc.). The conditions of the product, its value and volumetry, also bring variations in risks, making the last-mile delivery in Favelas a critical, costly and with many particularities logistics process. Delivering or not within the Favela has just been a difficult decision because it generates extra transport costs and in some cases, they end up undermining a competitiveness and making it no longer offered the delivery service in specific areas.
4.1.1 Last-mile conditions
The aggregation of the codes allowed to detect that conditions in the last-mile vary according to the product and favela delivered, thus identifying that the Favelas are not all the same and the nature of the product interferes in this relation of the conditions that lead to the risk of distributing products within shanty towns. Having the risk formed by these two conditions where the value and volumetry of the product matter, as well as the accesses and security of the load.
Delivery in Favelas is more expensive due to conditions related to the risk associated with freight carried, with respect to their attractiveness to theft, making it necessary to bear extra costs of safeguard during the routes and additional premiums for entering Favelas. The greater the number of cargo thefts in a particular Favela, the greater its cost of delivery,
Conceptual blocks Axial codes Aggregate dimensions
Added value of load (#19; 4,8%)
Product Type Last Mile Conditions
Product Liquidity (#17; 4,3%)
Monitoring and tracking (#23; 5,9%)
Technology used Last Mile Decisions
Orders routing (#28; 7,1%)
15
which in the vast majority of cases has just been absorbed and diluted in the total cost of the companies' logistics cost.
The factor of the delivery team being a Favela resident, having knowledge of the community, is crucial in the process of communication and distribution in these areas, since the deliverers are known and also know the residents and the Favela environment. It is clear that the greater the existing relationship with the favela, lower is the chance of stolen loads occurring, being it a broad knowledge about the accesses and/or consumers by the delivery team or some kind of social action that generates credibility of the brand (supplier) towards the community.
"To avoid the risk of cargo stolen, the company tries to hire people who are from the community that makes deliveries. Since you know the region and are familiar with the "favela leaders" and thus, they end up letting the deliveries flow normal. But another aspect that is generated by this strategy is to seek social inclusion...to believe in the people who live there and be provided with their local knowledge of the characteristics and particularities of the favela. "(Interview#18: Last Mile, 2017). Besides that, the better the information flows from the customer to the company, less costly the process is, more efficient and less risky. Thus, the company may think of optimized models, increasing the control and reducing the dependency on always having to send a same delivery team. In this case, was observed in the data, that employee have their own delivery knowledge and the company don’t absorb this reliable information. In case the product has high liquidity in the market, it is more targeted for theft, thus requiring more attention for its delivery and, consequently, greater investments in risk management.
In some cases, it is impossible to carry out last-mile delivery, due to the high cost charged by militias or almost daily frequency of cargo stolen, forcing customers to collect their orders outside the communities at pre-established alternative delivery points. In extreme cases, the company passes to a distributor and leaves a certain area because of the impossibility of a secure access. When, in addition to cargo, cash values are also required to be carried in the case of cash payments, risks are increased and delivery costs increase due to the need to invest in greater vehicle safety, such as safes, locks, sirens and so on.
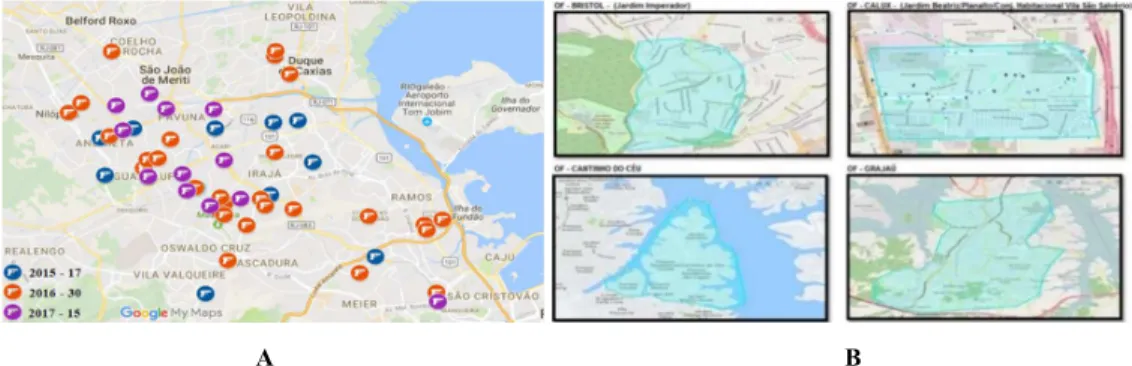
In order to characterize these conditions and the risk variations perceived by the companies interviewed, Fig. 7 provides evidences presented during the interactions that help to identify how risk areas are characterized regarding their geographic location and the number of robberies associated. The different colors correspond to the year and the number of occurrences in the city of Rio de Janeiro, according to legend in the first sequence, while in the second it is presented a delimitation of these regions where the favelas are, considering the criteria of frequency versus severity of robberies, in the city of Sao Paulo.
16
A B
Fig. 7. A: Evidences of favela risk (taken from Interview#11: Shipper, 2017) B:Evidences of risk areas (taken from Interview#12: Shipper, 2017).
4.1.2 Last-mile decisions
The second dimension emerged from the data revealed that the decisions taken respect many factors based on the last-mile conditions mentioned in the first aggregate dimension. The strategies that companies practice in distribution within Favelas focus essentially on the service level: based on the time of delivery to the customer and how often they occur, in the type of vehicle used: whether it is light or heavy and their average occupation; in the type of delivery: if it is own or outsourced and has a local partner within the Favelas or some subcontractor of the carrier; in the delivery time: of the effectiveness of the requests delivered within the promised deadlines and at time window; the security level; whether or not have escorts in the vehicles, if there is a mapping of robberies by Favelas (critical areas) and if there is any relationship with the Favelas (social action, basic baskets, talk with the Favela`s leaders) and lastly in the technology used: from the monitoring of the vehicles and tracking the loads and if there is routing of orders.
Regarding the nature of the risk, it was found that vehicles can be better or worse optimized due to the potential of losses according to the value of the cargo they are carrying, causing the costs to vary, since the optimization of its total load capacity is related to the security level. The social relationship with Favela can be a factor that differentiates successful deliveries from unsuccessful ones, allowing them to deliver without escort and with greater productivity since the risks may be reduced, since this relationship allows greater knowledge and information about the communities. Directing then, that companies have a culture aimed at helping the favela (social actions and social inclusion) and “not only explore it” is seen with good eyes by the communities. Generating jobs for community dwellers is one of the notable examples, even if observed as a strategy in just a few cases.
Each company has its own risk mapping and adopts different strategies according to its own type of product and frequency of cargo theft and may or may not leave an area if the cost of freight is too high. It was identified that resilience is a key factor to be able to prevent and anticipate any occurrence and thus allow for a smoother operation in the long term. However, as a practice, only the veiled escort strategy was observed, in which
17
unarmed people accompany the delivery vehicles without interference even if some claim occurs, with the unique objective of collecting crucial information to prevent future thefts, being primarily operated by risk management companies. As a result, it has been identified that the riskier the favela is, extreme risk area, for example, worst is to send an escort, as it is seen as an affront to the “favela leaders”, increasing the likelihood of loading be stolen. Showing, once again, that optimization and distribution models of last-mile in Favelas are influenced by the level of risk associated with each Favela.
“Through my risk manager I have a limit of possible value, maximum of loading (value of the load) depending on the type of risk that the favela represents. There is a risk value lock in this developed risk matrix. Our company works with three levels of risk: low, medium and extreme. If for some reason, even though I still have capacity and orders for a certain critical zone, but the value exceeds the maximum allowed in an extreme risk zone, I end up taking out products and losing productivity but I mitigate my risks.” (Interview#11: Supplier, 2017).
Customers in Favelas suffer from lower rates of attendance due the restrictions related to cargo stolen, since in many cases observed the deliveries are concentrated with less frequency than the “asfalto” (deliveries outside the Favelas) to reduce loads and propensity for thefts. It has also been identified that there are support points within some Favelas because of the greater volume of orders, where subcontractor of the carrier based within risk areas load their vehicles in the carrier DC returned after it to make the last-mile, serving in some cases as consolidator of freight of the carriers that send to these points higher volumes directly so that then these subcontractors with light and individual vehicles reach the final customers. However, this model is very expensive, as this transshipment does not have enough volume to dilute costs in the medium and long term and is unique to a single company and not shared as a UCC.Also, according to companies the most of deliveries are performed in the morning because it is when the robberies occur less frequently.
It was identified that for each type of product the consumers of Favelas have different expectations and criteria to measure the different service level according to their previous experiences with the companies. Any change in the type of vehicle or deliverers, increases risks in response to possible changes. Showing that any decision made must necessarily understand the conditions in the last-mile in order for the delivery process to flow naturally. “Then I end up delivering in the central street that cuts the Favela going only to a certain point in certain Favela, not going too much inside, and for this I leave out the clients who stay in the side streets or beyond my risk limitations, for security and not sale reasons, because I have several clients there willing to buy my product....in other cases instead of a 3-day visit to the customer I will deliver 1 day only. Avoiding the circulation of my vehicles inside the Favelas.” (Interview # 11: Supplier, 2017).
Another finding from the research, shows that the better the resources are managed and focused in favelas` customers, better will be to prevent the cargo stolen and more clients can be achieved. The technology shipped in the vehicles must respect the risk conditions, since it can disrupt the delivery, disconnect the vehicle in the middle of a
18
community or aggravate some sinister, since the robbers will have to use more force, but on the other hand can also intimidate the theft. The companies need to balance the use of it according the mapping of the last-mile delivery conditions in Favelas presents in the next section. Making the better decision needs to consider the type of product and the type of favela in which the company are going to make the last-mile delivery. It is also essential to have a mapping of the delivery and stopping points in the Favelas so that, matching with the conditions in the last-mile, companies can propose more adequate strategies in terms of favelas distributions systems, safety, forms of relationship with communities and possible sharing UCCs.
“The first premise is that companies only address risk management obligated and does not create a risk management culture in delivery teams. Then, you see a lot of problems in the last-mile in these critical areas.” (Interview # 06: Last Mile, 2014).
The deliveries routing is still very focused on the knowledge of the delivery teams and their expertise gained over the long period delivering on the same route, the same Favela, or in the model “motorista da casa”, where the delivery staff is a resident of the community where himself delivers the goods. This fact causes to the companies a loss of control and visibility of their supply chain, being determinant for the unproductiveness and uncertainties of deliveries in the last mile. Criteria as risk are only incorporated in the observed routing techniques about frequency and number of claims per region, but not with regard to accesses, download and safety points and characteristics of customers. If the accident happened in the route stipulated within the route of the day, hardly any companies will identify any anomaly in the process in a preventive way.
Therefore, deliveries to Favelas are determined by changes in the conditions of the external environment, not controlled by the companies, the product type and the Favela, which determine the decisions based on the risks associated with the added value of the cargo, product liquidity, the knowledge of the favela, the knowledge of favela clients, favela accesses (reliefs, alleys, unnamed streets) and the restrictions of service areas in the Favela. Last-mile logistics entails being impacted by certain conditions that, in turn, affect the perception of risk by companies, leading to strategies that may or may not be credible to use. In this way, the conditions determine the risks and threats that companies will have to face in the last mile of the favelas.
Favela risk, besides being a moderator of delivery conditions, is also a factor that often determines the cost of freight, since all the decisions taken consider the low or high risk associated with a particular Favela. In some cases, a term emerged from the interviews and used to identify the regions where the Favelas are located, companies may choose to abandon or not go to the last mile to make deliveries because of the factors: very specific,
19
expensive, out of process solution of the company, limited in time and scope, outside the corporate culture, high levels of theft or criminality not yet controllable.
"Costs me more deliver in favelas because I have to reduce the occupation of fleet due to robberies in 30% of total optimization. Risk areas cost me 30% more given the capacity limitation that I have to put thinking of a safe route… and this cost I dilute everything in the total account of my freight, being thus unproductive.” (Interview # 21: Supplier, 2017).
Some companies, for example, deliver on the border of Favela with the city, “no pé do morro”, and the residents themselves create an internal distribution system. Already other companies deliver at some focal point (for example, a community center) and the resident pick up the product there. In other cases, delivery to favelas is outsourced to independent deliverers, often locals. In some interviews, it was observed that many interviewees reported that the products are delivered to the house of an acquaintance or the carrier needs to make prior contact by telephone, marking an easily accessible meeting point for delivery of the product.
4.2 Emergent proposed model
The emergent proposed model, Fig. 8, shows last-mile logistics as an independent variable formed by DC’s location, type of vehicle, frequency of deliveries, vehicles occupancy, vehicles monitoring, type of product, and product liquidity. Favela risk is an independent moderating variable, that affect all conditions, leading the companies to achieve or not logistics a good logistics performance formed by stolen risk, access risk and type of favela. In the model, delivery cost, service level and delivery time are managed indicators that leads companies to logistics performance being it a dependent variable moderate by Favelas.
20
4.3 Mapping of the last-mile in Favelas
Through the practices observed and analysis, was identified the need to position the strategies according to previous presented Delivered Products Matrix, Fig 6, matching the characteristics of product delivery with the characteristics of the Favela. The Favela risk emerged from the data as a crucial factor that moderates the conditions faced and decisions made, influencing the strategies and consequently the last-mile performance.
The proposed mapping is divided into 4 quadrants, dividing the products by their value, y-axis and volumetry, x-y-axis, previously performed in the classification of the companies interviewed and adds the Favela Risk in 16 sub-quadrants of conditions in the last mile, pointing to a z-axis. Fig. 9 shows the mapping approach called Mapping the Delivery Conditions of the Last-Mile in Favelas, where each quadrant has 4 decision-making conditions. The colors best illustrate the variations of these conditions, which may vary from a milder risk, higher Safety and easy Access and at the highest level of extreme risk, lower security and difficult access.
Fig. 9. Mapping of the last-mile delivery conditions in Favelas
Some common strategies have been identified among firms, regardless of quadrant as evidenced as assertive in the last mile. These are: delivery always with the same delivery team, relationship with communities and long-term contracts with the carrier and subcontractors. Table 1 summarizes the main last-mile delivery strategies proposed in Fig. 9 for each obstacle and condition faced within Favelas.
4.4 Proposals and Recommendations
Some propositions and recommendations about the last-mile in favelas. Depending on the characteristics of the favela and delivery products, a synergy between distribution models that includes the constant exchange of information, technologies and best practices among
Product
Favela High Value
Low Value
Small Volumetry Large Volumetry
Higher Safety, Easy Access Risk 3 4 Lower Safety, Difficult Access Lower Safety, Easy Access Higher Safety, Difficult Access
21
companies, as well as the local knowledge acquired by them in addressing the favela customers, can result in greater efficiency in terms of logistics performance for the companies that want explore these huge market, thus, overcoming the las-mile hurdles and mitigate the risks.
There is a strong dependence of the companies with their deliverers team, since they seem to dominate the knowledge about last-mile delivery in Favelas;
It is necessary to invest in relationships with local partners allocated within the Favelas, absorbing their knowledge, so that the companies can improve the flow of information from these critical delivery areas, bringing control and increasing the level of service to consumers there;
A good relationship with favela leaders allows companies to avoid theft problems, resulting in a much lower frequency of incidents;
Local partners and subcontractors should be developed from entities already established the communities (ex., CUFA), because it is very difficult to find an external partner who knows the characteristics of favelas and all its restrictions.
22
Table 1
Las-mile delivery strategies
Product/Favela Condition 1 Condition 2 Condition 3 Condition 4
Higher Safety, Easy Access Higher Safety, Difficult Access Lower Safety, Easy Access Lower Safety, Difficult Access
Quadrant 1 The vehicles used are light, with no company logo and may or may not have escorts, according to the favela delivered and its level of safety.
• Generally normal delivery
and routing. • Fixed points of delivery with better access within favelas; • Alternative delivery address; • Light vehicles without escort and without tracker;
• Deliver performs delivery alone while drive circulate after the unload (vehicle does not stand still to avoid being a potential target for theft).
• Support Points - carrier or shipper delivers to a sub-distributor within the last-mile;
• Concentrate deliveries in the morning and decrease occupancy to reduce time in route within favelas;
• Negotiate with favela “leaders” the delivery conditions - influential people of the community or even bandits;
• Risk area matrix (Security Level) - limited load values, limited vehicle
occupancy, limited delivery times, limited frequency of visits; • Fixed delivery team with favela knowledge - by time or resident
• Escort according to security levels previously mapped in risk matrix; • Mobile pick up point - customer meets the request in a nearby location, but outside the favela;
• Deliver performs delivery alone while drive circulate after the unload (vehicle does not stand still to avoid being a potential target for theft).
• No delivery, leaving the area to a distributor. The shipper loses all control over his activities in the last mile.
Quadrant 2 Do not have a high
investment in security. The vehicles are medium to heavy and the escort follows the delimitation of the risk level of the favela delivered. They have company logo.
• No escort, tracking or any
security device. • Fixed points of delivery with better access within the favela, for example: partner bar, central street that consolidates key clients.
• Concentrate deliveries in the morning and decrease occupancy; • Negotiate with favela "leaders" delivery conditions;
• Risk area matrix (Security Level);
• Professionalism in Relationship - social action, ONGs, basic;
• Fixed delivery team with favela knowledge - by time or resident • Develop an internal risk management culture within the company; • Splitting deliveries into more vehicles – reducing delivery time
• Local partner within the favela - point where customer withdraws orders or partner distributes small volumes in more critical areas; • Concealed escort - risk agents seeking information about the favela environment and not holding the load;
• Escort only on the way to the favela but not inside; • Training drivers in risk management.
• No delivery, leaving the area to a distributor. In some cases where delivery is performed is escorted, tracked and deliveries focus on few customers who purchase large volumes.
Quadrant 3 High investment in
security. The vehicles are usually light and without a company logo.
• Tracker and monitoring; • Cargo insurance.
• Customers inform their addresses and delivery particulars - community associations serve as consolidators of information;
• Customer contact before delivery.
• Specialize delivery team (training and with Favela knowledge); • Splitting deliveries into more vehicles – reducing delivery time • Armed escort;
• Very low occupancy due to high added value;
• Negotiate with "leaders" of favelas delivery conditions. • Monitoring and tracking vehicles and orders.
• No delivery, leaving the area to a distributor. The shipper loses all control over his activities in the last mile.
Quadrant 4 No investment in security.
The vehicles are usually heavy with the company logo.
• Cargo insurance; • Normal delivery routing.
• When delivery is possible, leave it at an alternative address or ask the customer to pick it up at the nearest store or DC.
• It tends not to deliver and if it does it uses escort and Specialize
delivery team Escort just on the way to the favela - inside has to use relationship Escort just on the way to the favela - inside has to use relationship with the favela and its representative leaders (- influential people of the community or even bandits).
• No delivery, leaving the area to a distributor. The shipper loses all control over his activities in the last mile.
23
5. CONCLUSION AND FUTURE WORK
The association between the categories allowed to identify the criteria adopted by the companies that lead to the executed strategies. As an important moderator factor in these relations, the risks make the conditions change and, consequently, affects the decisions, thus requiring variations in the strategies implemented due the integrated management of the categories - axial codes.
In addition, the study provided as a practical contribution the identification of categories that determine the variations in the distribution strategies, showing that Favelas are not the same and the type of product to be delivered influences the decisions made. Companies need to find the quadrant that best fits their conditions to make the right decisions considering the associated risks.
It is important to highlight as a limitation of the study that the research focuses on companies that deliver within Favelas, processes and practices implemented, not questioning the recipients of the orders regarding their opinions and experiences with deliveries. Besides these, interviews with favela residents were not conducted, although some of the agents interviewed had great local knowledge of the last mile.
There are many areas of future work related to results and findings about last-mile in Favelas. The emergent proposed model and the conditions mapping serve as a first step towards a theory of last-mile delivery in Favelas. The empirical examination could be extended into a qualitative research with a view to mapping - to measure the risks related to the cost of the last-mile delivery in Favelas for each situation presented in the quadrants. Thus, enable to develop innovative mechanisms that reduce logistics costs. Expecting a reduction of the purchase price, generating a direct income gain to the residents. The social issue must also be approached through the relationship of the companies and their approach to the community. It can, in some way, reduce the number of robberies and make the Favela itself part of the company's distribution chain, as a source of data and information for decision-making, while being impacted by better services and product offerings at lower prices.
7. REFERENCES
ALLEN, J., BROWNE, M. W., & LEONARDI, J. The Role of Urban Consolidation Centers in Sustainable Freight Transport. Transport Reviews, 32(4), 473-490, 2012. BLANCO, E. E., & FRANSOO, J. C. Reaching 50 million nanostores : retail distribution in
emerging megacities Reaching 50 million nanostores : retail distribution in emerging megacities, (January), 2013.
BLANCO, E. & MERCHAN, D. The Future of Megacity Logistics. Megacity Logistics Lab - MIT Center for Transportation & Logistics. September 2015.
24
BOCCIA, M., CRAINIC, T. G., SFORZA, A., & AND STERLE, C. A Metaheuristic for a Two Echelon Location-Routing Problem. Symposium on Experimental Algorithms. Naples, 2010.
BORDIN, E. Q. Análise das empresas transportadoras de carga com ênfase na tecnologia de rastreamento.129p. Master Thesis (Mestrado em Engenharia de Transportes) – Universidade Federal do Rio de Janeiro, Rio de Janeiro: Coppe/UFRJ, 2008.
BOYER, K.K., FROHLICH, M.T., HULT, G.T.M. Extending the supply chain – How cutting-edge companies bridge the critical last mile into customers’ homes, Amacom, New York, USA, 2005.
CHAN, H.K., FIONA, L. & OLATUNDE, A.D. "Adoption of Genetic Algorithm for Cross-Docking Scheduling with Time Window". Decision-Making for Supply Chain Integration, Springer, unknown, pp.1-22 ,2012.
CRAINIC, T.G. Long haul freight transportation. In: Hall, R.W. (Ed.), Handbook of Transportation Science, second ed. Kluwer Academic Publishers, Norwell, MA, pp. 451–516, 2003.
DABLANC L. City distribution, a key element of the urban economy: guidelines for practitioners, in Macharis C., Melo S. (ed), City distribution and urban freight transport: multiples perspectives, Northampton, Edward Elgar Publishing, p. 13-36, 2011.
DICK, B. Grounded theory: a thumbnail sketch. 2002. Available at
<http://www.scu.edu.au/schools/gcm/ar/arp/grounded.html> (accessed on 09 June 2017). DREXL, M., & SCHNEIDER, M. A Survey of the Standard Location-Routing Problem. Johannes Gutenberg University, Gutenberg School of Management and Economics, Main, 2014.
DREXL M, SCHNEIDER M. A survey of variants and extensions of the location-routing problem. Eur. J. Oper. Res. 241(2):283–308, 2015.
DUBE, L. &. PARÉ, G. Rigor in Information Systems Positivist Case Research: Current Practices, MIS Quarterly, v.27, n.4, p.597-635, 2003.
FIRJAN. COM UM ROUBO DE CAMINHÃO POR HORA, PREÇO DO FRETE PARA O RIO SOBE ATÉ 35%. O Estado de S. Paulo Newspaper, 2017. Available at <http://atarde.uol.com.br/economia/noticias/1889838-com-um-roubo-de-caminhao-por-hora-preco-do-frete-para-o-rio-sobe-ate-35> (accessed on 03 September 2017).
FREIGHTWATCH INTERNATIONAL. Supply Chain Intelligence Center. Global Cargo
Theft Threat Assessment. 2013. Available at
<https://www.naed.org/NAEDDocs/Research/Legal%20Issues/FreightWatch%202013% 20Global%20Cargo%20Theft%20Threat%20Assesment%20Full_0.pdf> (accessed on 19 March 2017).
GEVAERS, R., VAN DE VOORDE, E., VANELSLANDER, T. (2009) Innovations in last mile logistics: the relations with green logistics, reverse logistics and waste logistics. - In: Conference proceedings of International Symposium on Logistics 2009, Istanbul, Turkey, S.l., 2009.
GLAESER, E. O TRIUNFO DA CIDADE. Editora BE, 2016.
GLASER, B.; STRAUSS, A. The Discovery of Grounded Theory, Chicago: Aldine, 1967. HOLGUÍN-VERAS, J., SÁNCHEZ-DÍAZ, I., & BROWNE, M. (2016). Sustainable Urban
Freight Systems and Freight Demand Management. Transportation Research Procedia, 12(June) 40–52, 2015.
IBGE. Instituto Brasileiro de Geografia e Estatística. Aglomerados Subnormais: Primeiros Resultados. Rio de Janeiro: IBGE, 2010.
25
INSTITUTO DE SEGURANÇA PÚBLICA DO ESTADO DO RIO (ISP). 2016. Cargo
theft Report. Available at
<http://arquivos.proderj.rj.gov.br/isp_imagens/uploads/RelRouboCarga2016.pdf> (accessed on 28 March 2017).
JANJEVIC, M., KAMINSKY, P., BALLÉ NDIAYE, A. Downscaling the consolidation of goods–state of the art and transferability of micro-consolidation initiatives. Eur. Transp. 54 (4), 1–23, 2013.
LECY, J. D. & BEATTY, K. E. Representative Literature Reviews Using Constrained Snowball Sampling and Citation Network Analysis, January, 2012.
LIN, C. K. Y., & KWOK, R. C. W. Multi-objective metaheuristics for a location-routing problem with multiple use of vehicles on real data and simulated data. European Journal of Operational Research, 175(3), 1833–1849, 2006.
LOGISTICS TREND RADAR Delivering insight today. Creating value tomorrow! 2016.
Powered by DHL Trend Research. Available at
<http://www.dhl.com/content/dam/downloads/g0/about_us/logistics_insights/dhl_logisti cs_trend_radar_2016.pdf> (accessed on 15 March 2017).
MANTEY, Carrie. Supply & Demand Chain Executive. Mar, Vol. 18 Issue 1, p36-38. 3p, 2017.
MEIRELLES, R. & ATHAYDE, C. Um país chamado favela: a maior pesquisa já feita sobre favela brasileira. São Paulo: Edita Gente, 2014.
MERCHAN, D., Transshipment Networks for Last-Mile Delivery in Congested Urban Areas. MASTER THESIS OF SCIENCE IN ENGINEERING SYSTEMS. MIT, 2015. PANDIT, N. R. (December). The creation of theory: A recent application of the grounded
theory method. The Qualitative Report, 2(4), 1996.
PRODHON, C., & PRINS, C. A survey of recent research on location-routing problems. European Journal of Operational Research, 238(1), 1-17, 2014.
SINDICARGA. EMPRESAS DE E-COMMERCE EVITAM 'CEPS DO INFERNO'. O
Estado de S. Paulo. 2017. Available at
<http://atarde.uol.com.br/economia/noticias/1889836-empresas-de-ecommerce-evitam-ceps-do-inferno> (accessed on 03 September 2017).
SHEFFI, Y. The Power of Resilience: How the Best Companies Manage the Unexpected (MIT Press) – September 11, 2015.
STRAUSS, A. & CORBIN, J. Basics of Qualitative Research: Grounded theory procedures and techniques. Newbury Park: Sage, 1990.
STRAUSS, A. & CORBIN, J. Basics of Qualitative Research: Techniques and Procedures for Developing Grounded Theory (3rd ed.). Thousand Oaks, CA: Sage, 2008.
TURNER, B. A. The use of grounded theory for the qualitative analysis of organizational behavior. Journal of Management Studies, 20(3): 333–348, 1983.
WINKENBACH, M., ROSET, A., SPINLER, S., WINKENBACH, M., ROSET, A., & SPINLER, S. Strategic Redesign of Urban Mail and Parcel Networks at La Poste Strategic Redesign of Urban Mail and Parcel Networks at La Poste, 2015.
26
Appendix A – List of interviewees
ID Description of the company Cargo entrevistado Interview date time (hrs)
1 Supplier National Logistics Manager 26/08/2014 1:01:00
2 Carrier Distribution Manager 04/09/2014 1:12:00
3 Last Mile Logistics Manager 04/09/2014 0:36:00
4 Last Mile Operational Director 05/09/2014 1:17:00
5 Carrier National Manager Transportation 10/09/2014 0:42:00
6 Last Mile Operational Director 11/09/2014 1:09:00
7 Carrier Logistics Manager 16/09/2014 1:11:00
8 Last Mile Operational Director 02/10/2014 1:18:00
9 Supplier Distribution Manager 03/10/2014 1:01:00
10 Carrier Logistics Manager 25/11/2014 0:24:00
11 Supplier Operations and Risk Coordinator 24/03/2017 0:56:00
12 Supplier Regional Operations Manager 05/04/2017 0:46:00
13 Supplier Logistics Director 07/04/2017 1:06:00
14 Supplier Logistics Manager 19/04/2017 0:40:00
15 Supplier Logistics Coordenator 24/04/2017 0:45:00
16 Supplier National Operations Manager 25/04/2017 0:42:00
17 Supplier Logistics and Risk Manager 26/04/2017 0:49:00
18 Last Mile Distribution Coordinator 28/04/2017 1:06:00
19 Carrier Logistics Director 28/04/2017 0:48:00
20 Last Mile Corporate Security Manager 05/05/2017 0:24:00
21 Supplier Distribution Manager 05/05/2017 0:31:00
22 Supplier Operations Coordinator 06/05/2017 0:51:00
23 Supplier Logistics Manager 08/05/2017 0:44:00
24 Supplier Logistics Coordinator 09/05/2017 0:22:00
25 Supplier National Manager Transportation 23/05/2017 0:39:00
27
Appendix B – Codes, frequency of appearances (#), and aggregation
Conceptual blocks Axial Codes Aggregate dimensions
Added value of delivery (#19; 4,8%)
Product Type
Product Liquidity (#17; 4,3%)
Favela characteristics knowledge (#11; 2,8%)
Favela
Customers characteristics knowledge
(#15; 3,8%) Last Mile Conditions
Last-mile access (#17; 4,3%)
Geographic area
Restrictions of delivery areas (#13; 3,3%)
Delivery time on customer (#9; 2,3%) Service level Frequency of deliveries (#24; 6,1%) Vehicle characteristics (#31; 7,9%) Vehicle type Vehicles occupancy (#24; 6,1%) Own or outsourced (#38; 9,7%) Delivery Type
Local Partner or subcontractor (#17; 4,3%)
Effectiveness
(#18; 4,6%) Last Mile Decisions
Delivery time
Time windows (#21; 5,4%)
Vehicle Escort (#23; 5,9%)
Security level Mapping thefts (#29; 7,4%)
Favela relationship (#15; 3,8%)
Monitoring and tracking (#23; 5,9%)
Technology used
Routing of orders (#28; 7,1%)