UNIVERSIDADE DE LISBOA
INSTITUTO DE GEOGRAFIA E ORDENAMENTO DO TERRITÓRIO
WILDFIRE SUSCEPTIBILITY MODELLING
IN MAINLAND PORTUGAL
JOÃO CARLOS RODRIGUES MOREIRA VERDE
ORIENTADOR: PROF. DOUTOR JOSÉ LUÍS ZÊZERE
TESE ESPECIALMENTE ELABORADA PARA OBTENÇÃO DO GRAU DE DOUTOR EM GEOGRAFIA ESPECIALIDADE EM GEOGRAFIA FÍSICA
JÚRI
PRESIDENTE: DOUTORA MARIA LUCINDA CRUZ DOS SANTOS FONSECA VOGAIS:
DOUTOR ANTÓNIO JOSÉ BENTO GONÇALVES DOUTOR MÁRIO JORGE MODESTO GONZALEZ PEREIRA
DOUTOR JOSÉ MIGUEL OLIVEIRA CARDOSO PEREIRA DOUTOR JOSÉ LUÍS MOREIRA GONÇALVES DA SILVA ZÊZERE
DOUTOR EUSÉBIO JOAQUIM MARQUES DOS REIS
5 If you discussed this thesis with me, if you talked to me about this, if you gave me ideas and pointers, if you read this, if you helped me in any way, then you should know that I am forever grateful, and that this thesis is also yours.
Thank you all, so very much
« If there is certainty, there is no risk. »
Omar Cardona
« (...) Then I saw that wisdom is better than foolish ways, as the light is better than the dark. »
Ecclesiastes 2:13
« (...) "Geographies," said the geographer, "are the books which, of all books, are most concerned with matters of consequence. They never become old-fashioned. It is very rarely that a mountain changes its position. It is very rarely that an ocean empties itself of its waters.
We write of eternal things."» Antoine de Saint-Éxupèry, in “The Little Prince”
7
Preamble
Becoming a physical geographer is like learning to read. From the moment we are taught how to group syllables, and with those, words, it becomes impossible, in full faculty, to stare at a word and not decipher it, translating its graphical shapes into an idea. The same happens with geography. When one becomes a geographer, one loses the ability of looking around and not giving meaning to what is seen. Mountains are no longer just mountains. Rivers are no more just water running into the ocean. Landscapes morph from scattered things into something a geographer decodes. For everything there is a process. In all things you find evolution, and the physical geographer reads it, even if he doesn’t want to or actively thinks about it.
Learning to read is not an end. Learning to read is just the beginning, part of the process that makes us read better and faster, and then, writing. In a person’s academic run, a Ph.D cannot be an end in itself. A Ph.D is just part of evolution. It is not a moment when all is done, but a moment where reading and writing is perfected, and questions multiply themselves. Beyond a Ph.D lies practice. The practical application of what has been studied and defended. To give back to others, for a common benefit and knowledge, the time they’ve given us to reach this far. I understand, now, that a Ph.D is, far from an ending, a start.
Risk is everywhere, but that’s not something we think about every day when we wake up, even though we spend our time assessing risk in our brains, even if not consciously. We might not perceive it, but every action we take, from the minor to the most significant, bears a risk. When we move forward, when a concrete action is taken, it’s because our brains, in a split second, evaluated the risk of taking it and decided it was acceptable: the benefit outweighed the risk. From the many risks we’re presented within our lives, my course has led to wildfires. Hazard and risk are human properties I consider fit for a physical geographer to study, but their application on the subject of wildfires only appealed to me after cooperating with the team that devised the technical proposal for the National Wildfire Prevention Plan, in 2005. Up until then, as to most Portuguese, wildfires were just a thing on the news, on prime time television, during the summer silly season. I looked at it as a national inevitability, inextricably linked with summer temperatures and, who knows, other questionable or obscure reasoning, summer after summer. I came to learn that was not the case. At all.
I worked for the National Forest Authority (AFN) between 2006 and 2009, and witnessed how selflessly, in those gloomy offices, some of their younger workers strove to develop public service, something often made extremely hard by contingencies I can’t easily frame in the spirit of science or gently adjective. It was in that context that, from 2005 to 2008, I developed my personal investigation and MSc thesis on the subject of Wildfire Hazard assessment, which I defended before a jury, at the University of Lisbon, on January 7th 2009.
Like my experience before that, with the National Wildfire Prevention Plan, working for the National Forest Authority gave me a better understanding of Portuguese wildfires, if only partially, because at the time I was only working with half of it – the prevention side. For a fuller, more global understanding of the problem at hand, I needed the experience that came after that when, in 2009, I became a National Operations Assistant of the National Command
8
for Relief Operations, of the National Authority for Civil Protection (ANPC). Prevention met fire suppression efforts. The picture was, if not complete, brighter. Or, should I say, grimmer? I found it extremely hard to evaluate wildfire risk and had, at the time, to stop at hazard. While I worked for AFN, not even foresters dared to put a value on things. While there, I invested most of my efforts on harmonizing the conceptual risk framework, bringing it closer to the concepts internationally used and accepted with other phenomena. It wasn’t easy as I suppose, for many, the notion of value was not convenient. At AFN I was given the notion that most investments were made on the side of fire suppression, making it harder for prevention to show results, as it takes several years for it to show. Putting that in perspective, later on, at ANPC, I understood that regardless of how numerous or equipped your fire suppression teams are, there are moments when nothing seems to stop fire, in particular in a country where people seem to live happily with fire on their backyards and use it frequently for landscape management. They just don’t like it when fire shows up at the door. Their door. Fire suppression investments were a painkiller. A much needed painkiller, in fact, as prevention takes decades. But the Portuguese must behave differently. The number of daily ignitions, during summertime, is extremely high and must be reduced. How can anyone accept a toll of 400 (even 500) daily ignitions? Hardly.
Civil Protection, in Portugal, seems easily mistaken for wildfire suppression during summer and severe weather conditions during the winter. Far from the truth. Civil Protection is much more than that, and for sure, many of those working in civil protection would rather not have to deal with such an effort during summer. It must be understood that each and every wildfire summer campaign takes a lot of time to plan and prepare during the rest of the year. It’s hardly conceivable to spend so much time preparing for something that has no justification, when there are so many other risks to think, plan and prepare for. If we cannot move Portugal from its place, all we have left is to move the Portuguese. Their minds, that is.
As I investigated for my MSc thesis, I concluded that meteorological parameters had little relevance for wildfire hazard modelling. As a matter of fact, high air temperatures, rainfall and other parameters do have influence when an ignition has already taken place, both slowing fire and making for an easier suppression, or allowing fire to grow and spread faster. But their influence on a structural approach, though, is near naught. My personal experience has shown me that weather conditions carry a blame they don’t always have. It is not rare to experience days with very high severity rating (from the Canadian Fire Weather Index system) and still there are no significant ignitions, in number or affected areas. On the other hand, I have worked on days when the severity rating is reasonably low and yet the number of ignitions skyrocketed. Wildfires in Portugal, as per official reports, are mostly linked to human motivations. Thus, wildfire hazard assessment is possible using few variables, because as hard as it is to model human behavior, historical patterns do help. As a physical geographer, my concern is to perfect as much as possible my work on wildfire risk assessment, creating a tool to reduce uncertainty. We know there is a problem. We know the problem. Everything has been identified. The causes and the most wildfire prone territories are clearly known. It’s necessary, now, to address those questions that, in the field of science, still persist. Wildfires in Portugal will only continue to be a problem for as long as nobody really cares about solving it. The solutions are all at hand.
9
Abstract
Wildfires are a recurrent phenomenon in mainland Portugal, mainly of a seasonal nature, during summer, even though, depending on favourable conditions for ignition and fire spreading, wildfires can occur at any time of the year. Wildfires represent a problem for mainland Portugal because they destroy significant areas of which some populations are dependent on, but also because wildfires lead to significant expenditures in suppression efforts. In this thesis, a low complexity model, integrating high spatial correlation layers has been tested with an updated land cover coverage, showing a good predictive capacity with only land cover, slope and historical data as layers. However, this model benefits from a double integration of historical data in that past wildfires not only enter the model as an independent layer but are also the basis for computing favourability scores for any other layer. For that reason, another method has been explored: Weights of Evidence. This second method is statistically robust and unbiased, and when put to the test with several evidence layers, such as land cover, slope, elevation, aspect, population density, population growth ratio and distance to roads, has shown that it has comparable results to those of the simpler, lower complexity model. It has also shown that adding more evidence layers does not necessarily lead to improved predictive performance.
Wildfire susceptibility assessment at a regional level (NUTSII) has also been studied, showing that with the exception of the smaller NUTSII region (Lisboa), all other regions show worse predictive performance than the model run for the entire mainland, and frequency-area statistics show that while large wildfires are responsible for most of the total burnt area in mainland Portugal, they are generally smaller than what would be expected from a power-law of good fitting. On the other side of the spectrum, smaller wildfires are found to be larger in area than what they should be in regards to statistics.
Keywords
11
Resumo
Os incêndios rurais em Portugal continental são um fenómeno recorrente, de natureza essencialmente sazonal, com um pico de ocorrências durante o Verão, pese embora possam ocorrer em qualquer momento do ano desde que existam condições favoráveis à ignição e propagação. Os incêndios rurais representam um problema para Portugal na medida em que não só destroem vastas áreas florestais das quais as populações dependem, colocando em perigo a segurança e sobrevivência das populações, como também implicam um investimento avultado, anualmente renovado, em meios de supressão.
A floresta nacional é uma paisagem razoavelmente recente, que ao longo dos séculos foi muitas vezes depredada a favor da construção naval ou criação de áreas agrícolas, e que hoje se divide entre povoamentos e áreas incultas com grandes continuidades que promovem a propagação do fogo, após um século XX com algum investimento no sector florestal, quer para efeitos de defesa nacional, quer para captação de fundos comunitários.
Verificou-se, observando algumas das mais relevantes publicações sobre esta matéria, que as abordagens científicas à modelação de risco – nas suas várias componentes – estão muito orientadas ou para os aspectos dinâmicos, por via da exploração de índices numéricos que traduzam a probabilidade de ocorrência do fogo, ou para componentes intrínsecas ao território, que são utilizadas para a sua divisão em várias classes de susceptibilidade.
Nesta tese, a noção de risco que conduz o raciocínio implica o conhecimento de valor, na medida em que se entende um risco como algo que está a jusante da perigosidade: um efeito sobre algo, uma vez concretizado um fenómeno potencialmente danoso, o que pressupõe a identificação da susceptibilidade do território, aliada à probabilidade de ocorrência de um incêndio e, sobre isso, a valoração de elementos em risco com uma determinada vulnerabilidade, algo a que a literatura consultada por diversas vezes alude, embora pareçam existir dificuldades em efectivamente produzir mapas de risco, pela provável complexidade de valoração dos elementos em risco, pese embora se reconheça que o valor directo da floresta Portuguesa se mantenha em torno de mil milhões de euros, não contando assim com valores indirectos que elevam este valor, numa última estimativa conhecida, para um total de mais de 7 mil milhões de euros.
Aplicou-se, inicialmente, um modelo de complexidade reduzida já objecto de publicação em momento anterior, e uma actualização da cobertura do solo, obtendo-se resultados muito positivos em matéria de capacidade preditiva do modelo. Trata-se de um modelo que recorre a temas de forte correlação espacial: a cobertura do solo, os declives e o histórico de incêndios, tendo uma característica que o diferencia face a outros métodos: a informação histórica tem um duplo-uso, constituindo não apenas uma variável independente mas servindo, também, como base para a computação dos scores de favorabilidade de quaisquer outras variáveis nele integradas, o que se entendeu poder servir como um indicador indirecto do comportamento humano, destacando áreas de recorrência das de acidente isolado.
Ainda assim, obviando a dupla entrada em modelação da informação histórica, investigou-se a aplicabilidade de um outro método, criando modelos com recurso ao método Weights of
12
ocupação do solo, declive, altitude, orientação de vertentes, densidade populacional, taxa de variação da população e distância à rede viária, demonstrou atingir bons resultados preditivos, comparáveis com o modelo de menor complexidade previamente explorado, demonstrando, ainda, que a integração de variáveis adicionais não resulta necessariamente numa melhoria do comportamento do modelo.
A susceptibilidade regional aos incêndios rurais (no caso, NUTSII) também foi estudada, tendo sido observado que, com excepção para a menor região (Lisboa), todas as regiões têm um comportamento preditivo inferior ao modelo para a totalidade de Portugal continental, e as estatísticas de frequência-área demonstram que os grandes incêndios são responsáveis pela maior parte da área ardida ainda que, de um ponto de vista estatístico se apresentem globalmente inferiores ao potencial de acordo com uma regra potencial com a qual exibem uma forte correlação. Inversamente, os pequenos incêndios tendem a ser mais extensos do que a estatística faria crer.
Verificou-se, também que não existe um número definitivo de anos a incluir numa série de modelação, embora os modelos estudados apresentem valores elevados de predição com séries curtas de apenas 10 anos de modelação. É possível modelar com séries mais curtas, tanto quanto se pode optar por modelar com toda a série disponível, deixando, porém, um ano para validação independente que permita verificar se o modelo ainda revela ajuste face à realidade, desde que mantendo presente a noção de que os modelos abordados nesta tese não se destinam a prever o comportamento de nenhum ano isolado, mas sim a uma utilização num cenário futuro não limitado, para efeitos de planeamento.
Na observação do comportamento dos modelos com o crescimento das séries anuais de modelação, verificou-se como um ano muito destacado face aos demais pode introduzir perturbações muito visíveis na capacidade preditiva dos modelos. Efectivamente, tomando o ano 2003 como exemplo, observa-se que foi de tal modo pouco selectivo no tipo de ocupação do solo que afectou, que perturbou a capacidade preditiva dos modelos, algo que se estima poder ocorrer de novo, assim exista outro ano com tamanho desvio. Constitui um aspecto relevante o facto de um ano muito distinto ter mais influência na validação do modelo do que na própria modelação, i.e., o ganho que um modelo possa ter por passar a integrar um ano com muita área ardida não é de todo comparável, em magnitude, à perturbação que esse mesmo ano induz na capacidade preditiva dos modelos.
Concluída esta dissertação, demonstrou-se que a susceptibilidade a incêndio rural pode ser avaliada com recurso a um número limitado de temas ou camadas de informação, tais como informação histórica, declive e ocupação do solo, a que podem juntar-se outras conforme o método escolhido. O método base apresentado em primeiro lugar é de muito fácil aplicação e produz resultados que podem replicar-se, de modo aproximado, com o método Weights of
Evidence. Tal facto comprova que é possível realizar avaliações de susceptibilidade com
qualidade, servindo de base a uma correcta gestão de risco que ajude a definir, entre outras estratégias, onde criar quebras de combustível, onde fazer uso prioritário de fogo controlado, onde ter especial atenção na restrição à edificação, por forma a evitar criar novos elementos em risco ou até, numa nota mais operacional, onde incrementar a vigilância e onde privilegiar o pré-posicionamento de meios técnicos e humanos de supressão de incêndios.
13 Não se apresenta, porém, uma solução à prova de toda e qualquer fragilidade. Enquanto abstracção da realidade, um modelo terá sempre margem para erro. Deve existir particular atenção na escala a que se aplica o modelo, que pode tornar necessária a utilização de outras camadas de informação, e, de grande relevância, a adequação da classificação à realidade. Nesta dissertação, a classificação com base em quintis foi adequada para o nível nacional e aplicou-se, também, ao nível regional (NUTSII), mas este tipo de classificação, na tentativa de alocação de 20% das unidades matriciais a cada classe, pode sobrevalorizar as classes, e.g., atribuindo áreas mais extensas às classes de maior susceptibilidade do que verdadeiramente se justifica no território estudado. Dessa forma, a observação cuidada das curvas de predição e o seu uso para uma classificação mais objectiva – quando as curvas não se prestem à classificação baseada em quintis – deve ser acautelada a todo o instante.
Palavras-chave
15
Table of Contents
Chapter 1. Introduction ... 29
1.1 Identifying the problem ... 29
1.2 The context ... 36
Chapter 2. The conceptual framework ... 41
Chapter 3. The state of knowledge on the field of wildfire hazard and risk assessment and mapping... 45
3.1. Meteorological-based wildfire studies ... 45
3.2. Terrain-based wildfire studies ... 49
Chapter 4. The definition of a base model ... 65
4.1 Methodology ... 65
4.2 Updating the original CSP model ... 67
4.2.1. Slope and simple probability ... 69
4.2.2. Land cover ... 73
4.2.3. Computing new favourability scores for the updated land cover layer... 76
4.2.3. Discussion on land cover changes’ impact on model results ... 81
4.2.4. Conclusions on the impact of land cover changes ... 83
4.3. Discussion on the base susceptibility model ... 84
Chapter 5. A solid approach: Weights of Evidence ... 89
5.1. Methodology ... 89
5.2 Testing Weights of Evidence against the reference model CSP ... 92
5.3 Strengthening Weights of Evidence with further evidence layers ... 95
5.3.1. Elevation ... 95
5.3.2. Aspect ... 99
5.3.3. Population Density ... 103
5.3.4. Population Growth Rate ... 109
5.3.5. Distance to Roads ... 113
5.3.6. Combining selected evidence layers ... 117
5.4 Closing thoughts on Weights of Evidence for Wildfire susceptibility assessment ... 118
Chapter 6. On the subject of model stability ... 121
6.1 Prediction from 1975 to 2012 ... 123
6.2 Looking at model variability ... 125
6.3 The impact of widespread affected areas ... 141
16
Chapter 7. Regional susceptibility assessment ... 149
7.1 Regional success rates ... 151
7.2 Regional prediction rates ... 160
7.3 Wildfire susceptibility mapping ... 169
7.4 Regional differences regarding evidence layers ... 176
7.5 Closing thoughts on regional susceptibility assessment ... 183
Chapter 8. Frequency and Magnitude of Wildfires in Mainland Portugal ... 185
8.1 Regional frequency densities ... 185
8.2 Closing thoughts on frequency density ... 191
Chapter 9. Final thoughts ... 193
9.1 What kind of forest does mainland Portugal have and why are wildfires a problem? ... 195
9.2 How does the changing in land cover affect a low complexity wildfire susceptibility model of good predictive capability? ... 195
9.3 How can the Weights of Evidence method help with wildfire susceptibility assessment in mainland Portugal? ... 196
9.4 How many layers should be considered in wildfire susceptibility assessment? ... 197
9.5 How does model behaviour change with yearly dataset intervals? ... 197
9.6 How does wildfire susceptibility change with Portuguese NUTSII regions and what do they show about wildfire magnitude? ... 198
References ... 201
List of Acronyms ... 211
17
Table of Figures
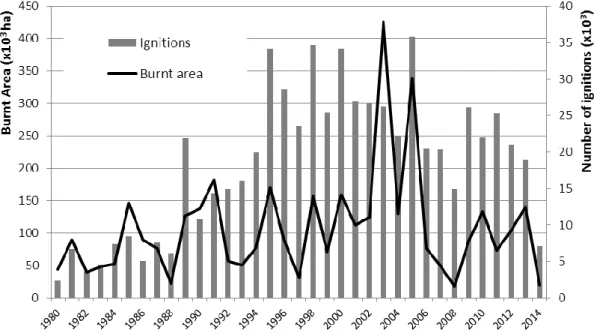
Figure 1.1 – Burnt area and ignitions, between 1980 and 2014, according to official reports.
Source: National forest authority (website browsed on June 8th 2015) ... 30
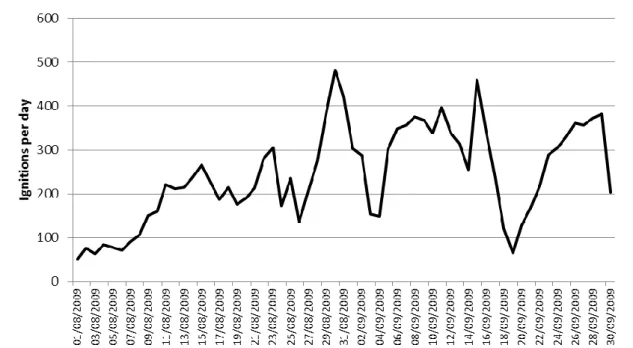
Figure 1.2 – Ignitions, between August 1st and September 30th 2009. Source: National Authority for Civil Protection... 31
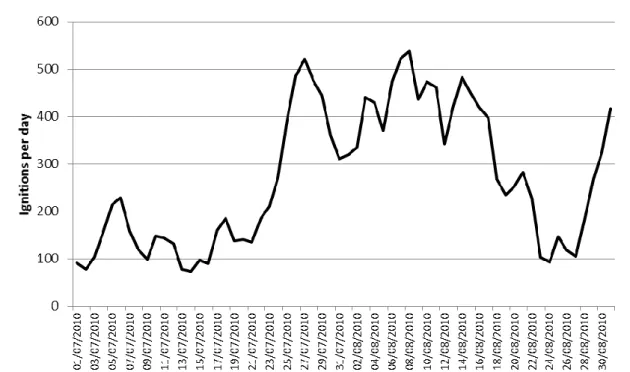
Figure 1.3 – Ignitions, between July 1st and August 30th 2010. Source: National Authority for Civil Protection. ... 32
Figure 1.4 – Ignitions, between October 10th and 24th, 2011. Source: National Authority for Civil Protection. ... 32
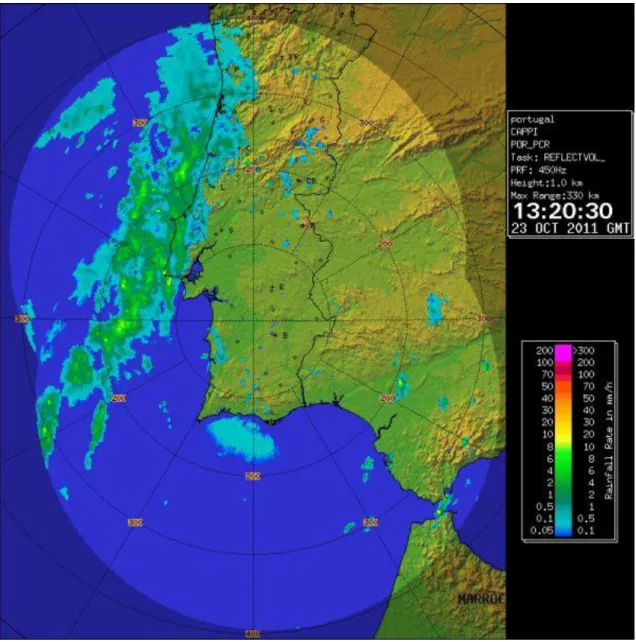
Figure 1.5 – Doppler composite (Rainfall Rate) for October 23rd 2011 at 13:20 UTC. Source: National meteorological authority. ... 33
Figure 1.6 – Burnt areas on 10 year intervals. Clockwise (starting from top left), 1975 - 1984; 1985 – 1994; 1995 – 2004 and 2005 – 2013 (2013 is the last year in the series, hence a 9 year interval). ... 35
Figure 1.7 – Forest areas in 2006 in mainland Portugal. Source: CORINE Land Cover 2006 ... 37
Figure 2.1 – Risk model components ... 42
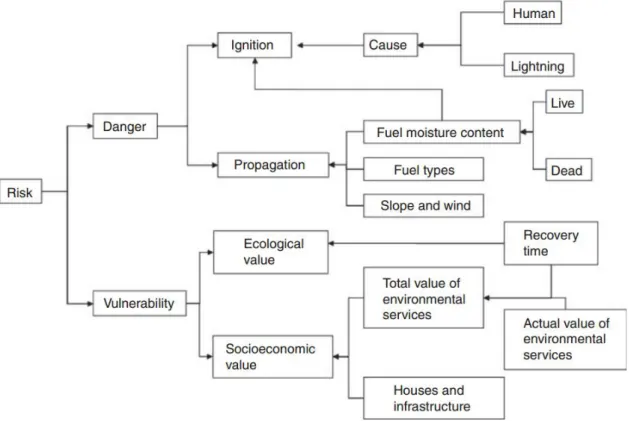
Figure 2.2 – Risk definition of Bachmann and Allgöwer (1999), adapted to the conceptual model herein adopted ... 43
Figure 3.1 – FWI structure, adapted from Van Wagner (1987) ... 48
Figure 3.2 – Structural hazard map (left) and Cyclical hazard map (right) in 2004 (Pereira, Carreiras and Santos, 2004) ... 51
Figure 3.3 – IGP’s susceptibility map for the district of Viana do Castelo, Portugal, 2007 ... 54
Figure 3.4 – Annex to Regulatory Decree n. 55/81, of December 18th, defining wildfire susceptibility classes and «critical zone» location in mainland Portugal. ... 56
Figure 3.5 – Annex to Ordinance n. 1060/2004, of August 21st (mainland Portugal). ... 57
Figure 3.6 – Predicted risk classes by municipality in mainland Portugal. Source: Portuguese meteorological authority. ... 58
Figure 3.7 – Coefficients in the Chuvieco and Congalton (1989) model ... 60
Figure 3.8 – Risk matrix (Bachmann, 2001, p.75) ... 61
Figure 3.9 – Wildfire risk assessment framework, as per Chuvieco et al. (2012), adapted from Chuvieco et al. (2010) ... 62
Figure 4.1 – CORINE Land Cover 2006 in mainland Portugal (for Class Ids see table 4.1) ... 68
Figure 4.2 – Favourability and Frequency for slope classes in mainland Portugal ... 70
Figure 4.3 – Slope in mainland Portugal ... 71
Figure 4.4 – Simple probability of wildfire (from the interval 1975-1994) in mainland Portugal ... 72
Figure 4.5 – Favourability and Frequency for land cover classes on the revised CLC2000 in mainland Portugal ... 77
Figure 4.6 – Favourability and Frequency for land cover classes on the CLC2006 in mainland Portugal ... 78
Figure 4.7 –Frequency for land cover classes in mainland Portugal ... 78
Figure 4.8 –Favourability scores for land cover classes in mainland Portugal ... 79
18
Figure 4.10 – Success and Prediction curves for the reference model CSP with CORINE Land Cover 2000 (C0SP) and CORINE Land Cover 2006 (C6SP) in mainland Portugal ... 81 Figure 4.11 – Success and Prediction curves for the reference model CSP with CORINE Land Cover 2000 (C0SP) and CORINE Land Cover 2006 (C6’SP) using CORINE Land Cover 2000’s favourability scores, in mainland Portugal ... 82 Figure 4.12 – Success and Prediction curves for the modelling series 1975-1994 and independent validation series 1995-2013, in mainland Portugal. The background colours represent the susceptibility classes according to a quintile classification, whose cartographic representation is in figure 4.13. ... 85 Figure 4.13 – Wildfire susceptibility in mainland Portugal (modelling block 1975-1994) ... 87 Figure 5.1 – Possible combinations between presence and absence of predisposing factors and wildfire past occurrences. ... 90 Figure 5.2 –Frequency and W+ for Land Cover layer with burnt pixel set of 1975 to 1994 in mainland Portugal ... 93 Figure 5.3 –Frequency and W+ for Slope layer with burnt pixel set of 1975 to 1994 in mainland Portugal ... 94 Figure 5.4 – Success and Prediction curves for the reference model CSP and Weights of Evidence WofE-CS with burnt pixel set of 1975 to 1994 in mainland Portugal ... 94 Figure 5.5 – Elevation in mainland Portugal ... 96 Figure 5.6 – Favourability and Frequency for Elevation layer with burnt pixel set of 1975 to 1994 in mainland Portugal ... 97 Figure 5.7 –Frequency and W+ for Elevation layer with burnt pixel set of 1975 to 1994 in mainland Portugal ... 98 Figure 5.8 – Success and Prediction curves for the reference model CSP and Weights of Evidence WofE-CSE with burnt pixel set of 1975 to 1994 in mainland Portugal ... 98 Figure 5.9 – Favourability and Frequency for Aspect layer with burnt pixel set of 1975 to 1994 in mainland Portugal ... 100 Figure 5.10 –Frequency and W+ for Aspect layer with burnt pixel set of 1975 to 1994 in mainland Portugal ... 100 Figure 5.11 – Success and Prediction curves for the reference model CSP and Weights of Evidence WofE-CSEA with burnt pixel set of 1975 to 1994 in mainland Portugal ... 101 Figure 5.12 – Aspect in mainland Portugal ... 102 Figure 5.13 –Frequency and W+ for Population Density (2001) layer with burnt pixel set of 1975 to 1994 in mainland Portugal ... 104 Figure 5.14 –Frequency and W+ for Population Density (2011) layer with burnt pixel set of 1975 to 1994 in mainland Portugal ... 104 Figure 5.15 –Frequency and Favourability for Population Density (2001) layer with burnt pixel set of 1975 to 1994 in mainland Portugal ... 105 Figure 5.16 –Frequency and Favourability for Population Density (2011) layer with burnt pixel set of 1975 to 1994 in mainland Portugal ... 105 Figure 5.17 –Population Density (2001) in mainland Portugal ... 106 Figure 5.18 –Population Density (2011) in mainland Portugal ... 107 Figure 5.19 – Success and Prediction curves for the reference model CSP and Weights of Evidence WofE-CSEP01 (Census 2001) with burnt pixel set of 1975 to 1994 in mainland Portugal ... 108
19 Figure 5.20 – Success and Prediction curves for the reference model CSP and Weights of Evidence WofE-CSEP11 (Census 2011) with burnt pixel set of 1975 to 1994 in mainland Portugal ... 108 Figure 5.21 –Frequency and W+ for Population Growth Ratio (1991-2011) layer with burnt pixel set of 1975 to 1994 in mainland Portugal ... 110 Figure 5.22 –Frequency and Favourability score for Population Growth Ratio (1991-2011) layer with burnt pixel set of 1975 to 1994 in mainland Portugal ... 110 Figure 5.23 – Success and Prediction curves for the reference model CSP and Weights of Evidence WofE-CSEG with burnt pixel set of 1975 to 1994 in mainland Portugal... 111 Figure 5.24 – Population Growth Rate 1991-2011 in mainland Portugal ... 112 Figure 5.25 –Frequency and W+ for Distance to Roads layer with burnt pixel set of 1975 to 1994 in mainland Portugal ... 114 Figure 5.26 –Frequency and Favourability Score for Distance to Roads layer with burnt pixel set of 1975 to 1994 in mainland Portugal ... 114 Figure 5.27 – Success and Prediction curves for the reference model CSP and Weights of Evidence WofE-CSER with burnt pixel set of 1975 to 1994 in mainland Portugal ... 115 Figure 5.28 – Distance to Roads in mainland Portugal ... 116 Figure 5.29 – Success and Prediction curves for the reference model CSP and Weights of Evidence WofE-CSERG with burnt pixel set of 1975 to 1994 in mainland Portugal ... 117 Figure 5.30 – Wildfire Susceptibility map for the WofE-CSER model in mainland Portugal ... 120 Figure 6.1 – Modelling and Validation set illustration. As the modelling set increases yearly, the validation set is equally subtracted ... 121 Figure 6.2 – Confusion matrix for ROC applied to wildfires ... 122 Figure 6.3 – Predictive ROC Areas Under the Curve for models run for mainland Portugal .... 123 Figure 6.4 – Validation burnt pixels per 10% partition, in percent of total, for the CSP model in mainland Portugal ... 127 Figure 6.5 – Validation burnt pixels per 10% partition, in percent of total, for the WofE-CS model in mainland Portugal ... 129 Figure 6.6 – Validation burnt pixels per 10% partition, in percent of total, for the WofE-CSE model in mainland Portugal ... 131 Figure 6.7 – Validation burnt pixels per 10% partition, in percent of total, for the WofE-CSEA model in mainland Portugal ... 131 Figure 6.8 – Validation burnt pixels per 10% partition, in percent of total, for the WofE-CSER model in mainland Portugal ... 132 Figure 6.9 – Validation burnt pixels per 10% partition, in percent of total, for the WofE-CSEP01 model in mainland Portugal ... 132 Figure 6.10 – Validation burnt pixels per 10% partition, in percent of total, for the WofE-CSEP11 model in mainland Portugal ... 133 Figure 6.11 – Validation burnt pixels per 10% partition, in percent of total, for the WofE-CSEG model in mainland Portugal ... 133 Figure 6.12 – Validation burnt pixels per 10% partition, in percent of total, for the WofE-CSERG model in mainland Portugal ... 134 Figure 7.1 – NUTSII regions in mainland Portugal ... 150 Figure 7.2 – NUTSII CSP success curves, compared with the national CSP for the modelling block 1975-1994 ... 151
20
Figure 7.3 – NUTSII CSP success areas under the curve, compared with the national CSP for the modelling block 1975-1994 ... 151 Figure 7.4 – NUTSII WofE-CS success curves, compared with the national WofE-CS for the modelling block 1975-1994 ... 152 Figure 7.5 – NUTSII CS success areas under the curve, compared with the national WofE-CS for the modelling block 1975-1994 ... 152 Figure 7.6 – NUTSII WofE-CSE success curves, compared with the national WofE-CSE for the modelling block 1975-1994 ... 153 Figure 7.7 – NUTSII WofE-CSE success areas under the curve, compared with the national WofE-CSE for the modelling block 1975-1994 ... 153 Figure 7.8 – NUTSII WofE-CSEA success curves, compared with the national WofE-CSEA for the modelling block 1975-1994 ... 154 Figure 7.9 – NUTSII WofE-CSEA success areas under the curve, compared with the national WofE-CSEA for the modelling block 1975-1994 ... 154 Figure 7.10 – NUTSII WofE-CSEP01 success curves, compared with the national WofE-CSEP01 for the modelling block 1975-1994 ... 155 Figure 7.11 – NUTSII WofE-CSEP01 success areas under the curve, compared with the national WofE-CSEP01 for the modelling block 1975-1994 ... 155 Figure 7.12 – NUTSII WofE-CSEP11 success curves, compared with the national WofE-CSEP11 for the modelling block 1975-1994 ... 156 Figure 7.13 – NUTSII WofE-CSEP11 success areas under the curve, compared with the national WofE-CSEP11 for the modelling block 1975-1994 ... 156 Figure 7.14 – NUTSII WofE-CSEG success curves, compared with the national WofE-CSEG for the modelling block 1975-1994... 157 Figure 7.15 – NUTSII WofE-CSEG success areas under the curve, compared with the national WofE-CSEG for the modelling block 1975-1994... 157 Figure 7.16 – NUTSII WofE-CSER success curves, compared with the national WofE-CSER for the modelling block 1975-1994... 158 Figure 7.17 – NUTSII WofE-CSER success areas under the curve, compared with the national WofE-CSER for the modelling block 1975-1994 ... 158 Figure 7.18 – NUTSII WofE-CSERG success curves, compared with the national WofE-CSERG for the modelling block 1975-1994... 159 Figure 7.19 – NUTSII WofE-CSERG success areas under the curve, compared with the national WofE-CSERG for the modelling block 1975-1994 ... 159 Figure 7.20 – NUTSII CSP prediction curves, compared with the national CSP for the modelling block 1975-1994 and validation block 1995-2013 ... 160 Figure 7.21 – NUTSII CSP prediction areas under the curve, compared with the national CSP for the modelling block 1975-1994 and validation block 1995-2013 ... 160 Figure 7.22 – NUTSII WofE-CS prediction curves, compared with the national WofE-CS for the modelling block 1975-1994 and validation block 1995-2013 ... 161 Figure 7.23 – NUTSII WofE-CS prediction areas under the curve, compared with the national WofE-CS for the modelling block 1975-1994 and validation block 1995-2013 ... 162 Figure 7.24 – NUTSII WofE-CSE prediction curves, compared with the national WofE-CSE for the modelling block 1975-1994 and validation block 1995-2013 ... 162
21 Figure 7.25 – NUTSII WofE-CSE prediction areas under the curve, compared with the national WofE-CSE for the modelling block 1975-1994 and validation block 1995-2013 ... 162 Figure 7.26 – NUTSII WofE-CSEA prediction curves, compared with the national WofE-CSEA for the modelling block 1975-1994 and validation block 1995-2013 ... 163 Figure 7.27 – NUTSII WofE-CSEA prediction areas under the curve, compared with the national WofE-CSEA for the modelling block 1975-1994 and validation block 1995-2013 ... 163 Figure 7.28 – NUTSII CSEP01 prediction curves, compared with the national WofE-CSEP01 for the modelling block 1975-1994 and validation block 1995-2013 ... 164 Figure 7.29 – NUTSII WofE-CSEP01 prediction areas under the curve, compared with the national WofE-CSEP01 for the modelling block 1975-1994 and validation block 1995-2013 .. 164 Figure 7.30 – NUTSII CSEP11 prediction curves, compared with the national WofE-CSEP11 for the modelling block 1975-1994 and validation block 1995-2013 ... 165 Figure 7.31 – NUTSII WofE-CSEP11 prediction areas under the curve, compared with the national WofE-CSEP11 for the modelling block 1975-1994 and validation block 1995-2013 .. 165 Figure 7.32 – NUTSII WofE-CSEG prediction curves, compared with the national WofE-CSEG for the modelling block 1975-1994 and validation block 1995-2013 ... 166 Figure 7.33 – NUTSII WofE-CSEG prediction areas under the curve, compared with the national WofE-CSEG for the modelling block 1975-1994 and validation block 1995-2013 ... 166 Figure 7.34 – NUTSII WofE-CSER prediction curves, compared with the national WofE-CSER for the modelling block 1975-1994 and validation block 1995-2013 ... 167 Figure 7.35 – NUTSII WofE-CSER prediction areas under the curve, compared with the national WofE-CSER for the modelling block 1975-1994 and validation block 1995-2013 ... 167 Figure 7.36 – NUTSII WofE-CSERG prediction curves, compared with the national WofE-CSERG for the modelling block 1975-1994 and validation block 1995-2013 ... 168 Figure 7.37 – NUTSII WofE-CSERG prediction areas under the curve, compared with the national WofE-CSERG for the modelling block 1975-1994 and validation block 1995-2013.... 168 Figure 7.38 – NUTSII Norte Wildfire Susceptibility (CSP Model) for the modelling block 1975-1994 and validation block 1995-2013 ... 169 Figure 7.39 – NUTSII Norte Wildfire Susceptibility clipped from the mainland Portugal CSP Model for the modelling block 1975-1994 and validation block 1995-2013 ... 169 Figure 7.40 – NUTSII Centro Wildfire Susceptibility (WofE-CSEP11 Model) for the modelling block 1975-1994 and validation block 1995-2013 ... 171 Figure 7.41 – NUTSII Centro Wildfire Susceptibility clipped from the mainland Portugal WofE-CSEP11 Model for the modelling block 1975-1994 and validation block 1995-2013 ... 171 Figure 7.42 – NUTSII Lisboa Wildfire Susceptibility (WofE-CSEP11 Model) for the modelling block 1975-1994 and validation block 1995-2013 ... 173 Figure 7.43 – NUTSII Lisboa Wildfire Susceptibility clipped from the mainland Portugal WofE-CSEP11 Model for the modelling block 1975-1994 and validation block 1995-2013 ... 173 Figure 7.44 – NUTSII Alentejo Wildfire Susceptibility (WofE-CSERG Model) for the modelling block 1975-1994 and validation block 1995-2013 ... 174 Figure 7.45 – NUTSII Alentejo Wildfire Susceptibility clipped from the mainland Portugal WofE-CSERG Model for the modelling block 1975-1994 and validation block 1995-2013 ... 174 Figure 7.46 – NUTSII Algarve Wildfire Susceptibility (CSP Model) for the modelling block 1975-1994 and validation block 1995-2013 ... 175
22
Figure 7.47 – NUTSII Algarve Wildfire Susceptibility clipped from the mainland Portugal CSP Model for the modelling block 1975-1994 and validation block 1995-2013 ... 175 Figure 8.1 – Wildfires (events of 1 hectare or more) per burnt area class, in hectares, in mainland Portugal between 2001 and 2014. ... 186 Figure 8.2 – NUTSII Norte normalized frequency-area statistics. ... 187 Figure 8.3 – NUTSII Centro normalized frequency-area statistics. ... 188 Figure 8.4 – NUTSII Lisboa normalized frequency-area statistics. ... 188 Figure 8.5 – NUTSII Alentejo normalized frequency-area statistics. ... 189 Figure 8.6 – NUTSII Algarve normalized frequency-area statistics. ... 190 Figure 8.7 – Mainland Portugal normalized frequency-area statistics. ... 191 Figure 8.8 – Frequency Density functions for all regions and Mainland Portugal. ... 192
23
Table of Tables
Table 1.1 – Areas by land cover, in thousands of hectares, in the national forest inventories of 1995, 2005 and 2010. Percentual differences given for the previous inventory. Source: ICNF 36 Table 1.2 – Areas by species, in thousands of hectares, for the three most significant species, in the national forest inventories of 1995, 2005 and 2010. Percentual differences given for the previous inventory. Source: ICNF ... 36 Table 3.1 – Themes, classes and their weighs according to IGP’s methodology ... 53 Table 4.1 – Corine Land cover classes considered to model wildfire susceptibility ... 69 Table 4.2 – Favourability scores for land cover classes ... 70 Table 4.3 – Modelling and independent validation blocks for CORINE Land Cover 1990, 2000 and 2006 in mainland Portugal ... 73 Table 4.4 – Areas under the curve for prediction curves for the available editions of CORINE Land Cover (%) in mainland Portugal ... 74 Table 4.5 – Land cover changes, in hectares, from CORINE Land Cover 1990 to 2000 in mainland Portugal ... 75 Table 4.6 – Land cover changes, in hectares, from CORINE Land Cover 1990 to 2000, above 10,000 hectares in mainland Portugal ... 75 Table 4.7 – Favourability scores for land cover classes in mainland Portugal ... 77 Table 4.8 – Land cover changes, in hectares, from CORINE Land Cover 2000 to 2006 in mainland Portugal ... 79 Table 4.9 – Burnt area by total area marks, for success and prediction curves, in mainland Portugal. Higher values in bold. Key: S-C0SP / S-C6SP: Success rates for CORINE Land Cover 2000 and 2006 respectively; P-C0SP / P-C6SP: Prediction rates for CORINE Land Cover 2000 and 2006 respectively (%). ... 81 Table 4.10 – Burnt area by total area marks, for success and prediction curves in mainland Portugal. Higher values in bold. Key: S-C0SP / S-C6SP / S-C6’SP: Success rates for CORINE Land Cover 2000, 2006 and 2006 with 2000’s favourability scores respectively; C0SP / C6SP / P-C6’SP: Prediction rates for CORINE Land Cover 2000, 2006 and 2006 with 2000’s favourability scores respectively (%) ... 83 Table 4.11 – Areas under the curve for the CORINE Land Cover prediction curves (%) in mainland Portugal ... 83 Table 4.12 – Area and predictive value of wildfire susceptibility classes in mainland Portugal for the modelling block 1975-1994 and validation block 1995-2013 ... 85 Table 5.1 – Positive Weights of Evidence (W+) score for Land Cover layer, with burnt pixel set of 1975 to 1994, in mainland Portugal ... 92 Table 5.2 – Positive Weights of Evidence (W+) score for Slope layer, with burnt pixel set of 1975 to 1994, in mainland Portugal ... 93 Table 5.3 – Compared Success rates for models “CSP” and “WofE-CS” with burnt pixel set of 1975 to 1994 in mainland Portugal. Higher values in bold. (%) ... 95 Table 5.4 – Compared Prediction rates for models “CSP” and “WofE-CS” with burnt pixel set of 1975 to 1994 in mainland Portugal. Higher values in bold. (%) ... 95 Table 5.5 – Positive Weights of Evidence (W+) score for Elevation layer, with burnt pixel set of 1975 to 1994 in mainland Portugal. ... 97
24
Table 5.6 – Compared Success rates for models “CSP” and “WofE-CSE” with burnt pixel set of 1975 to 1994 in mainland Portugal. Higher values in bold. (%) ... 98 Table 5.7 – Compared Prediction rates for models “CSP” and “WofE-CSE” with burnt pixel set of 1975 to 1994 in mainland Portugal. Higher values in bold. (%) ... 99 Table 5.8 – Positive Weights of Evidence (W+) score for Aspect layer, with burnt pixel set of 1975 to 1994 in mainland Portugal ... 99 Table 5.9 – Compared Success rates for models “CSP” and “WofE-CSEA” with burnt pixel set of 1975 to 1994 in mainland Portugal. Higher values in bold. (%) ... 101 Table 5.10 – Compared Prediction rates for models “CSP” and “WofE-CSEA” with burnt pixel set of 1975 to 1994 in mainland Portugal. Higher values in bold. (%) ... 101 Table 5.11 – Positive Weights of Evidence (W+) score for Population Density (2001 Census) layer, with burnt pixel set of 1975 to 1994 in mainland Portugal. ... 103 Table 5.12 – Positive Weights of Evidence (W+) score for Population Density (2011 Census) layer, with burnt pixel set of 1975 to 1994 in mainland Portugal. ... 103 Table 5.13 – Compared Success rates for models “CSP” and “WofE-CSEP01” with burnt pixel set of 1975 to 1994 in mainland Portugal. Higher values in bold. (%) ... 108 Table 5.14 – Compared Prediction rates for models “CSP” and “WofE-CSEP01” with burnt pixel set of 1975 to 1994 in mainland Portugal. Higher values in bold. (%) ... 108 Table 5.15 – Compared Success rates for models “CSP” and “WofE-CSEP11” with burnt pixel set of 1975 to 1994 in mainland Portugal. Higher values in bold. (%) ... 108 Table 5.16 – Compared Prediction rates for models “CSP” and “WofE-CSEP11” with burnt pixel set of 1975 to 1994 in mainland Portugal. Higher values in bold. (%) ... 109 Table 5.17 – Positive Weights of Evidence (W+) score for Population Growth Rate (1991-2011) layer, with burnt pixel set of 1975 to 1994 in mainland Portugal. ... 110 Table 5.18 – Compared Success rates for models “CSP” and “WofE-CSEG” with burnt pixel set of 1975 to 1994 in mainland Portugal. Higher values in bold. (%) ... 111 Table 5.19 – Compared Prediction rates for models “CSP” and “WofE-CSEG” with burnt pixel set of 1975 to 1994 in mainland Portugal. Higher values in bold. (%) ... 111 Table 5.20 – Positive Weights of Evidence (W+) score for Distance to Roads layer, with burnt pixel set of 1975 to 1994 in mainland Portugal. ... 113 Table 5.21 – Compared Success rates for models “CSP” and “WofE-CSER” with burnt pixel set of 1975 to 1994 in mainland Portugal. Higher values in bold. (%) ... 115 Table 5.22 – Compared Prediction rates for models “CSP” and “WofE-CSER” with burnt pixel set of 1975 to 1994 in mainland Portugal. Higher values in bold. (%) ... 115 Table 5.23 – Compared Success rates for models “CSP” and “WofE-CSERG” with burnt pixel set of 1975 to 1994 in mainland Portugal. Higher values in bold. (%) ... 117 Table 5.24 – Compared Prediction rates for models “CSP” and “WofE-CSERG” with burnt pixel set of 1975 to 1994 in mainland Portugal. Higher values in bold. (%) ... 117 Table 5.25 – Compared Success rates for models “CSP” and iterations of Weights of Evidence models, with burnt pixel set of 1975 to 1994 in mainland Portugal. Higher values in bold. When compared to the model immediately above: ▲ – higher rate, ▼ – lower rate, ▬ - no change. (%) ... 118 Table 5.26 – Compared Prediction rates for models “CSP” and iterations of Weights of Evidence models, with burnt pixel set of 1975 to 1994 in mainland Portugal. Higher values in
25 bold. When compared to the model immediately above: ▲ – higher rate, ▼ – lower rate, ▬ - no change. (%) ... 118 Table 5.27 – Areas under the curve for models “CSP” and iterations of Weights of Evidence models with burnt pixel set of 1975 to 1994 in mainland Portugal. Higher values in bold. When compared to the model immediately above: ▲ – higher rate, ▼ – lower rate, ▬ - no change. (%) ... 119 Table 6.1 – Areas under the curve for receiver operating characteristic curves for prediction on the CSP and WofE models, for modelling sets from 1975-1975 to 1975-2012 in mainland Portugal. Higher values in bold. When compared with the best rate for the previous year, ▲ – the current year rises rate, ▼ - the current year lowers rate, = no change (%)... 124 Table 6.2 – Validation burnt pixels per 10% Partition, in percent of total, for the CSP model in mainland Portugal. Higher values in bold. (%) ... 126 Table 6.3 – Validation burnt pixels per 10% Partition, in percent of total, for the WofE-CS model in mainland Portugal. Higher values in bold. (%) ... 128 Table 6.4 – Validation burnt pixels per 10% partition, in percent of total, for the WofE-CSE model in mainland Portugal. Higher values in bold. (%) ... 130 Table 6.5 – Validation burnt pixels per 10% partition, in percent of total, for the WofE-CSEA model in mainland Portugal. Higher values in bold. (%) ... 135 Table 6.6 – Validation burnt pixels per 10% partition, in percent of total, for the WofE-CSER model in mainland Portugal. Higher values in bold. (%) ... 136 Table 6.7 – Validation burnt pixels per 10% partition, in percent of total, for the WofE-CSEP01 model in mainland Portugal. Higher values in bold. (%) ... 137 Table 6.8 – Validation burnt pixels per 10% partition, in percent of total, for the WofE-CSEP11 model in mainland Portugal. Higher values in bold. (%) ... 138 Table 6.9 – Validation Burnt pixels per 10% partition, in percent of total, for the WofE-CSEG model in mainland Portugal. Higher values in bold. (%) ... 139 Table 6.10 – Validation burnt pixels per 10% partition, in percent of total, for the WofE-CSERG model in mainland Portugal. Higher values in bold. (%) ... 140 Table 6.11 – Land cover ranking changes, comparing burnt areas of 1975-1994 to those of 2003 alone, in mainland Portugal. Both W+ columns are for the interval 1975-1994. ... 141 Table 6.12 – Summed positive weights (W+ from the Weights of Evidence method discussed in chapter 5) for land cover class Id’s in mainland Portugal ... 142 Table 6.13 – Slope ranking changes, comparing burnt areas of 1975-1994 to those of 2003 alone in mainland Portugal. Both W+ columns are for the interval 1975-1994. ... 142 Table 6.14 – Elevation ranking changes, comparing burnt areas of 1975-1994 to those of 2003 alone in mainland Portugal. Both W+ columns are for the interval 1975-1994. ... 143 Table 6.15 – Aspect ranking changes, comparing burnt areas of 1975-1994 to those of 2003 alone, in mainland Portugal. Both W+ columns are for the interval 1975-1994. ... 143 Table 6.16 – Population Density (2001 Census) ranking changes, comparing burnt areas of 1975-1994 to those of 2003 alone, in mainland Portugal. Both W+ columns are for the interval 1975-1994. ... 144 Table 6.17 – Population Density (2011 Census) ranking changes, comparing burnt areas of 1975-1994 to those of 2003 alone, in mainland Portugal. Both W+ columns are for the interval 1975-1994. ... 144
26
Table 6.18 – Population Growth Ratio (1991-2011 Census) ranking changes, comparing burnt areas of 1975-1994 to those of 2003 alone, in mainland Portugal. Both W+ columns are for the interval 1975-1994. ... 144 Table 6.19 – Distance to Roads ranking changes, comparing burnt areas of 1975-1994 to those of 2003 alone, in mainland Portugal. Both W+ columns are for the interval 1975-1994. ... 144 Table 6.20 – Areas under the curve (%) for receiver operating characteristic curves for prediction on the CSP and WofE models, for modelling set from 1975-2012, with and without 2003 in the independent validation block, for mainland Portugal. ... 145 Table 7.1 – Prediction areas under the curve per NUTSII and model,for the modelling block 1975-1994 and validation block 1995-2013. Higher results in bold. Mainland Portugal presented for reference on row labeled PT. The best models are highlighted in bold. (%) ... 168 Table 7.2 – Favourability scores for the CORINE Land Cover 2006 layer on the CSP model, per NUTSII, for the modelling block 1975-1994 and validation block 1995-2013. Mainland Portugal presented for reference on column labeled PT. ... 176 Table 7.3 – Favourability scores for the Slope layer on the CSP model, per NUTSII, for the modelling block 1975-1994 and validation block 1995-2013. Mainland Portugal presented for reference on column labeled PT. ... 177 Table 7.4 – Weights of Evidence positive weights (W+) for the CORINE Land Cover 2006 evidence layer, per NUTSII, for the modelling block 1975-1994 and validation block 1995-2013. Mainland Portugal presented for reference on column labeled PT. ... 178 Table 7.5 – Weights of Evidence positive weights (W+) for the Slope evidence layer, per NUTSII, for the modelling block 1975-1994 and validation block 1995-2013. Mainland Portugal presented for reference on column labeled PT. ... 178 Table 7.6 – Weights of Evidence positive weights (W+) for the Elevation evidence layer, per NUTSII, for the modelling block 1975-1994 and validation block 1995-2013. Mainland Portugal presented for reference on column labeled PT. ... 179 Table 7.7 – Weights of Evidence positive weights (W+) for the Aspect evidence layer, per NUTSII, for the modelling block 1975-1994 and validation block 1995-2013. Mainland Portugal presented for reference on column labeled PT. ... 180 Table 7.8 – Weights of Evidence positive weights (W+) for the Population Density (2001 Census) evidence layer, per NUTSII, for the modelling block 1975-1994 and validation block 1995-2013. Mainland Portugal presented for reference on column labeled PT. ... 180 Table 7.9 – Weights of Evidence positive weights (W+) for the Population Density (2011 Census) evidence layer, per NUTSII, for the modelling block 1975-1994 and validation block 1995-2013. Mainland Portugal presented for reference on column labeled PT. ... 180 Table 7.10 – Weights of Evidence positive weights (W+) for the Population Growth Ratio (1991-2011) evidence layer, per NUTSII, for the modelling block 1975-1994 and validation block 1995-2013. Mainland Portugal presented for reference on column labeled PT. ... 181 Table 7.11 – Weights of Evidence positive weights (W+) for the Distance to Roads evidence layer, per NUTSII, for the modelling block 1975-1994 and validation block 1995-2013. Mainland Portugal presented for reference on column labeled PT. ... 181 Table 7.12 – Summed Weights of Evidence positive Weights (W+) per evidence layer and NUTSII, for the modelling block 1975-1994 and validation block 1995-2013 ... 182
27 Table 7.13 – Compared rankings (higher to lower) of evidence layer relevance, per NUTSII region, for the modelling block 1975-1994 and validation block 1995-2013. Mainland Portugal presented for reference. ... 183 Table 8.1 – Frequency-area statistics by NUTSII for wildfires (burnt area >= 1 hectare) from the SGIF database for the period 2001-2014. . ... 186
29
Chapter 1. Introduction
Fire does not need to be a problem. Facing fire as anything else other than a problem is when it becomes useful to part fire from wildfire. Fire has been useful for populations since mankind learnt to tame it, around 400 thousand years ago (Bowman et al., 2009). The opportunity to get warm, to cook food and get protection from wild animals might have given man such a satisfaction that he nearly forgot how controlling fire is so many times more apparent than real. When that control gets lost, fires turn into wildfires, with all their consequences: the irreparable loss of lives, and several other values, both tangible and intangible. A wildfire is an unplanned or uncontrolled fire affecting a forested area, even if in a smaller area compared to an agricultural space affected by the same occurrence.
Wildfires have destroyed, in recent years, thousands of hectares in mainland Portugal. Not being a new phenomenon, it has seen increased media coverage in the early years of this century: burnt areas were significant, and fire came too close to cities and their people and the media can quickly get to the places where fire suppression is ongoing. This is also an era of social networks, and wildfires also spread online, contributing for increased attention.
Wildfires can be studied in regard to the number of occurrences or the extent of burnt areas. Treating occurrences, depending on the purpose of a study, might be less interesting: they should not cause a problem if they are quickly suppressed. It should be noted that the greatest number of occurrences in mainland Portugal is recorded in densely populated areas, and particularly along the north coastal zone. While numerous, they do not create special damage as they are usually small fires due to quick intervention and suppression. It is true, though, that being numerous, they present a burden to the fire suppression effort, and if firefighting is dispersed in numerous, yet small, wildfires, equipment and men will not be available to suppress large wildfires, or to prevent some smaller wildfires to grow into big and seemingly uncontrollable ones. Whereas the northern coastal areas are known for numerous ignitions, it is in the countryside that the number of ignitions is smaller, but wildfires tend to burn the most area.
1.1 Identifying the problem
Man, under normal living conditions, no longer needs fire in the open to get warm, cook or protect himself, except if an adventurous tourist, but fire is still very useful to take on tasks that would, otherwise, be expensive and time consuming. In the Mediterranean, fire has been used as a tool for fuel management, reducing forest and agricultural waste that would, otherwise, be available to burn in an uncontrolled manner. Pasture renewal is also a frequent purpose for the use of fire. Taming fire can be far more complex than what many would think at first, and when control over some parameters affecting combustion and fire progression is lost, fires evolve into wildfires that transform landscapes in a fashion Portugal very well knows, for as Atlantic as we might be, our traditions have a lot of the Mediterranean.
Notwithstanding some moments of exceeded optimism, the last of which after the wildfire campaigns of 2007 and 2008, what continues to be observed in mainland Portugal, for at least
30
the past 30 years, is a significant burnt area due to wildfires (Fig. 1.1). The cooler 2014 summer of lesser burnt area and ignitions seems to have helped in decreasing the impact of wildfires, but the future, by definition, is uncertain.
After the highly discussed years of 2003 and 2005, which until now retain the record for burnt areas, it appeared as if something had changed because the following years were of a decrease in yearly burnt areas and somewhat discreet numbers in comparison to previous years. The same was observed for the number of ignitions which also dropped. It was considered, until 2009, that the changes in the fire campaigns and, possibly, a change in negligent behaviors, had allowed for a better control of wildfires and that this problem was, finally, in train to be solved. Unfortunately, the 2009 and 2010 campaigns came as proof that the problem persists, and that those optimistic speeches made in 2007 and 2008 did not have a solid ground.
Given that we cannot change our geography and climate, even though they are not, by themselves, to blame, it becomes necessary to change how the Portuguese relate themselves with fire. It cannot be accepted as a given or natural fact that the number of daily ignitions, for a continued time, reaches above three or four hundred wildfires.
Figure 1.1 – Burnt area and ignitions, between 1980 and 2014, according to official reports. Source: National forest
authority (website browsed on June 8th 2015)
In 2009, for the period of August 1st to September 30th, the daily number of wildfires was almost always above 100, peaking close to 500 ignitions (Fig. 1.2). These numbers were, however, far more expressive in 2010 (Fig. 1.3). From July 1st and up until the 23rd, the number of ignitions was manageable. After that, and until August 30th, there were 24 consecutive days above 300 daily ignitions. On two occasions, the symbolic mark of 500 ignitions was surpassed. These ignitions are those on forests (forest stands and shrubs) but also on agricultural land, in the sense that the means and operatives employed on these two scenarios are, essentially, the same. It should be noted, though, that agricultural fires are not accounted for on Portuguese statistical reports. The year 2011 deserves to be mentioned as well. Usually, the higher
31 number of ignitions is registered from July to September, a period known as the “Charlie Phase” of the wildfire suppression campaign, which typically coincides with the most meteorologically favourable conditions for ignition and spreading of fire. In 2011, however, wildfires went well over that period, and October, usually a quiet month as to wildfires are concerned, in particular after the first autumn showers, was dry and hot, keeping wildfires on the agenda. After a peak of 435 ignitions, on October 15th, wildfires began a downwards tendency, which would be kept until Wednesday, the 19th (Fig. 1.4). On that day, the media started to report that rain was expected for the weekend. Without any significant change on daily severity (in regard to the Canadian Fire Weather Index), the next day saw a rise from 268 to 365 ignitions, and the yearly maximum was reached on Saturday, October 22nd, with 459 ignitions. Even on the day after that, 262 ignitions were recorded, until rainfall hit land and aided firefighters. At 14:20 (UTC+1, Local time), when rainfall was hitting the coastal areas (Fig. 1.5), there were still 33 simultaneous active wildfires inland. As rain progressed inwards, wildfires came to the end, and after several days with hundreds of ignitions, the season was finally over.
Figure 1.2 – Ignitions, between August 1st and September 30th 2009. Source: National Authority for Civil Protection.
This country remains, thus, exposed to loss in value, due to a very high number of daily ignitions, which, in turn, creates good conditions for the loss of control over some of those. As those lost ignitions gain extension, losses will be far higher and hinder local sustenance for those populations exploring the land. This does not come without a sense of irony, in that those same populations are, sometimes, the originators of the wildfires that will put them in a precarious condition.
32
Figure 1.3 – Ignitions, between July 1st and August 30th 2010. Source: National Authority for Civil Protection.
33 Figure 1.5 – Doppler composite (Rainfall Rate) for October 23rd 2011 at 13:20 UTC. Source: National meteorological authority.
This reality presents itself as an opportunity to address wildfires in mainland Portugal under a different perspective, given what has been done up until now. As investigations reveal that a large percentage of wildfires are due to human causes, including pasture renewal (GNR, 2013), it might prove useful – if not efficient – to closely follow, during wet seasons, the need to burn shrubs with prescribed fire, in an orderly and planned fashion to avoid further losses but, still, meeting the needs of those living in rural areas on a daily basis. For that matter, decision makers and operatives need to know exactly where it is desirable and possible, to carry out that kind of pasture land management.
Wildfires, in Portugal, happen mainly North of the Tagus River, and follow a clearly identifiable pattern, as shown in figure 1.6. Dividing the cartographic series of 1975-2013 in 10 year intervals, the affected areas show some recurrence.
34
From the diversity of tools available to plan those interventions, like land cover maps and others, risk mapping is extremely relevant because susceptibility maps clearly point out where are the most favourable conditions for wildfire ignition and spreading (also, they give a clear view of how hard it would be to suppress fire on those places, because slope is one of the entry parameters used for modelling), and risk maps identify where the potential for loss of value is higher.
Making use of risk mapping requires that models used for production are perfected and validated, having as good susceptibility maps as possible. For that reason, there are some questions that should be answered for as solid a mapping as possible, and these questions are considered drivers for better susceptibility mapping and objectives in this thesis:
1. What kind of forest does mainland Portugal have and why are wildfires a problem? 2. How does the changing in land cover affect a low complexity wildfire susceptibility
model of good predictive capability?
3. How can the Weights of Evidence method help with wildfire susceptibility assessment in mainland Portugal?
4. How many layers should be considered in wildfire susceptibility assessment? 5. How does model behaviour change with yearly dataset intervals?
6. How does wildfire susceptibility change with Portuguese NUTSII regions and what do they show about wildfire magnitude?
35 Figure 1.6 – Burnt areas on 10 year intervals. Clockwise (starting from top left), 1975 - 1984; 1985 – 1994; 1995 – 2004
36
1.2 The context
The problem has been identified in the previous section and a context description is in order. Not being an expert in Portuguese forest history, the author does not intend to do an extensive research in this area. Thus, only a very brief presentation of Portuguese forests is made, which can be complemented by other works, which portray a fairly complete picture of how the forest areas have evolved over the years in Portugal (see, for example, the National Wildfire Prevention Plan, ISA (2005), or Vieira (2006)).
Portugal has about two thirds of its territory occupied by forested areas, mostly private. The National Forest Inventory published in 2013 identified as forest areas (forest stands and shrubs and pastures) about 6 million hectares in 2010, slightly more than the 5.9 million hectares in 2005 or 5.8 million hectares 10 years earlier in 1995 (Table 1.1) (ICNF, 2013). In 15 years there has been a decrease in the area occupied by forest stands (from 3,305.4 to 3,154.8 million hectares) and an increase in the area taken by shrubs and pastures (2,539.3 to 2,853.2 million hectares).
The Portuguese forests are dominated by maritime pine, eucalyptus and cork oak, which together represented more than 71% of forested areas in 2010. Among these species only the area of eucalyptus has steadily increased in the last three inventories (+94.6 thousand hectares), while the maritime pine suffers the biggest drop in 15 years, losing 263.4 thousand hectares. The decrease in the area of cork oak is comparatively more discreet, with just 10 thousand hectares as compared to 1995, in spite of a higher loss until 2005 (table 1.2).
Table 1.1 – Areas by land cover, in thousands of hectares, in the national forest inventories of 1995, 2005 and 2010.
Percentual differences given for the previous inventory. Source: ICNF
Land cover 1995 2005 2010
Forest stands 3,305.4 (-2.8%) 3,211.8 (-1,8%) 3,154.8 Shrubs and pastures 2,539.3 (+7.1%) 2,720.3 (+4.9%) 2,853.2 Total 5,844.7 (+1.5%) 5,932.1 (+1.3%) 6,008.0
Table 1.2 – Areas by species, in thousands of hectares, for the three most significant species, in the national forest inventories of 1995, 2005 and 2010. Percentual differences given for the previous inventory. Source: ICNF
Species 1995 2005 2010
Maritime pine 977.9 (-18,7%) 795.5 (-10,2%) 714.5 Eucalyptus 717.3 (+9,5%) 785.8 (+3,3%) 811.9 Cork oak 746.8 (-2,1%) 731.1 (+0,8%) 736.8
CORINE Land Cover 2000, according to what the Portuguese forest authority considers forested areas, accounts for a total of about 4.8 million hectares, a value that stays relatively unchanged in the CORINE Land Cover 2006 even though the latter nears 4.9 million hectares with a difference, between land coverages, below 40 thousand hectares (fig. 1.7), 4,843,200 hectares in 2000 versus 4,882,396 in 2006. In this coverage, cork oak forests have been included in the agricultural class (as agro-forestry areas) which contributes to the difference when compared to the national forest inventories. CORINE Land Cover will be used in this work as the reference land cover layer given its scale and nature (CORINE Land Cover is a polygon coverage whereas the national inventory is a point coverage, requiring interpolation and, therefore, higher commission and omission errors).
37 Figure 1.7 – Forest areas in 2006 in mainland Portugal. Source: CORINE Land Cover 2006
In spite of the fluctuations between the three most recent inventories, the final balance remains similar: about two thirds of the territory correspond to forest areas that, in addition to the notion often conveyed that the country has this capability and vocation, makes people