UNIVERSIDADE DE LISBOA
FACULDADE DE MEDICINA
Utilidade dos Exames de Ressonância Magnética no Diagnóstico da Doença
de Parkinson
Revisão Sistemática e Meta Análise
José Luís Brito de Almeida Gominho Curso de Mestrado em Neurociências
A impressão desta dissertação foi aprovada pelo Conselho Científico da
Faculdade de Medicina de Lisboa em reunião de 18 de Março de 2014
UNIVERSIDADE DE LISBOA
FACULDADE DE MEDICINA
Utilidade dos Exames de Ressonância Magnética no Diagnóstico da Doença
de Parkinson
Revisão Sistemática e Meta Análise
Dr. José Luís Brito de Almeida Gominho
Orientador: Professor. Doutor. Joaquim Ferreira, Faculdade de Medicina de Lisboa
Todas as afirmações contidas neste trabalho são da exclusiva responsabilidade do seu autor, não cabendo qualquer responsabilidade à Faculdade de Medicina da Universidade de Lisboa pelos conteúdos nele
apresentados
Curso de Mestrado em Neurociências Lisboa, Ano 2013
Resumo
:
Com a atual tendência para o envelhecimento da população e sendo a doença de Parkinson (DP) uma patologia que atinge cerca de 2% da população acima dos 65 anos, podemos prever um aumento da sua prevalência. Por outro lado devido às questões éticas e à morbilidade que implicariam as biopsias cerebrais como método de diagnóstico definitivo, a necessidade de encontrar métodos de diagnóstico precoce e não invasivos são de extrema importância. Mesmo nos melhores centros de diagnóstico há uma percentagem importante de desacordo entre o diagnóstico efetuado em vida, de base clínica e o diagnóstico pós-morte, que é histopatológico. A Ressonância Magnética, nas suas diferentes modalidades, proporciona-nos um meio de investigar “in vivo” as regiões corticais e subcorticais que se sabem estarem afetadas na DP.
Diversos estudos recentes procuram demonstrar a utilidade destes testes como bio marcadores de diagnóstico e progressão da doença de Parkinson. Procurei efetuar uma revisão sistemática e meta análise em relação aos exames de Imagens de Ressonância Magnética (IRM) de modo a verificar a sua utilidade no diagnóstico da doença de Parkinson e se poderão ter potencial para serem considerados bio marcadores de diagnóstico e seguimento dos doentes.
Objetivo
Revisão sistemática dos estudos que compararem, a precisão das diferentes modalidades de ressonância magnética no diagnóstico da doença de Parkinson, com diagnóstico clínico e controlos saudáveis, explorando suas potencialidades como bio marcadores.
Material e métodos
Procedeu-se a uma pesquisa na literatura publicada sobre a temática, recorrendo à base de dados PubMed/MEDLINE, Embase, B-on, Google Scholar e ainda na bibliografia dos estudos considerados relevantes. Foram utilizadas as palavras-chave "Parkinson", "Magnetic resonance imaging", "MRI", "DTI", "Diffusion tensor imaging", "Spectroscopy", "MRI of Iron", "fMRI", "bold", “Neuromelanin”, combinados com operadores booleanos apropriados para cada pesquisa. Foram selecionados estudos redigidos em Inglês, Francês, Espanhol e Português.
Critérios de inclusão:Estudos neurorradiológicos, com mais de cinco pacientes,
até a presente data, que envolvam Imagens de ressonância magnética (MRI) de diferentes modalidades tais como: Exames Estruturais (T1, T2, Neuromelanina, Ferro e outras técnicas); Diffusion Tensor Imaging (DTI); Espectroscopia em Ressonância Magnética (MRSI); Ressonância Magnética Funcional (fMRI) no diagnóstico da Doença de Parkinson e que comparem a precisão do teste com diagnóstico clínico e controlos saudáveis, explorando suas potencialidades como bio marcadores.
Foram excluídos, estudos que não usaram critérios formais de diagnóstico clínico, estudos incluindo pacientes submetidos a estimulação cerebral profunda, parkinsonismo idiopático ou vascular, casos relatados, editoriais, comentários, cartas, estudos em animais, estudos de diagnóstico diferencial com outras síndromes parkinsonianos e demências da DP.
Resultados
Dos 834 estudos identificados e atendendo aos critérios de seleção foram
separados 109 estudos que após a leitura dos “Abstracts” verificou-se que
apenas 52 preenchiam os requisitos dos critérios de inclusão. Destes estudos, foram obtidas as versões integrais publicadas, que foram integralmente lidas e sempre que existentes registados por mim, os seguintes dados: a referência, o ano, o título, o número de pacientes e controlos, a idade média, o estádio Hoehn & Yahr, a medicação, a modalidade de IRM, a região estudada, a intensidade do campo magnético do sistema, as conclusões e ainda se possível, a especificidade, a sensibilidade, a área sob a curva ROC e valores-p (Sigma) do teste t-Student (t-test) da comparação entre os valores obtidos dos exames dos pacientes com DP e a dos controlos saudáveis.
Os resultados obtidos foram divididos em quatro grupos, em função da modalidade de estudo de IRM (imagens de ressonância magnética), para avaliação: 1º exames estruturais utilizando os métodos clássicos e IRM do ferro e da Neuromelanina; 2º exames utilizando DTI (Diffusion Tensor Imaging); 3º exames de espectroscopia de RMN; 4º fMRI (ressonância magnética funcional) incluindo a de em estado de repouso (RS-fMRI).
1º Exames estruturais utilizando os métodos clássicos e IRM, do ferro e
Neuromelanina.
Neste grupo de estudos podemos verificar que, utilizando T1 imagens Inversão
de recuperação (a área) 24; T2W (o volume) 33; T1p (sensível á perda neuronal)
diminuição significativa na SN (substância nigra) dos pacientes com DP, quando comparados com controlos saudáveis pareados por idade, e um aumento significativo dos valores do R2 * (= 1/T2 *) e T2p, (sensível à deposição de ferro)
em pacientes com DP 41, 27, quando comparados com controlos saudáveis. É de
salientar que estas alterações se mantem ainda que tenhamos valores de sistemas com diferentes intensidades dos campos magnéticos 3T; 4T; 7T. 2º Exames utilizando DTI (Diffusion Tensor Imaging).
Com este tipo de exames podemos detetar em pacientes com DP, alterações na
AF (anisotropia fracionada) e DM (difusibilidade média) em todo o cérebro 74,
mas que são mais pronunciadas na substância branca frontal e parietal refletindo deste modo um dano microestrutural generalizado. Estas alterações ocorrem
nos estádios iniciais da PD75, em fibras de projeção do tálamo 11. Os valores da
MK (mean kurtosis) e da AF foram significativamente menores no cíngulo
anterior 22, na área motora, na pré-motora e motora suplementar do córtex 64,nas
áreas de substância branca próximas das áreas motoras suplementares,
cápsulas externa e interna, tálamo direito, putamen esquerdo 65 e como se
demonstra na meta-análise há uma redução significativa da AF na SN. 3º Exames de espectroscopia de RMN
Na espectroscopia dos metabolitos Substância Nigra na doença de Parkinson foram observadas diferenças significativas entre doentes PD e controlos
saudáveis nas razões, NAA / Cr, NAA / Cho, NAA / (Co + Cr) 66, 76. Com estes
exames podemos obter um in perfil neuro-químico “in vivo”, incluindo neurotransmissores (Glu e GABA) e os níveis de antioxidantes (GSH), que estão
razão NAA / Cr diminuiu seletivamente, em paralelo com disfunção neuronal nos
DP (P = 0,045) 73. No putamen e mesencéfalo foi encontrada uma redução
bilateral de fosfatos de alta energia, como adenosina trifosfato e fosfocreatina
como recetores finais da energia da fosforilação oxidativa mitocondrial 71.
4º Exames de fMRI ressonância magnética funcional incluindo os de em estado de repouso (RS-fMRI).
Usando diferentes paradigmas e comparando pacientes com DP, com controlos saudáveis, encontramos nos diferentes estudos uma redução da percentagem de mudança de sinal em todos os núcleos dos gânglios da base contra lateral e ipsilateral, tálamo lateral e medial, M1 (córtex motor primário) e área motora suplementar. Foram detetadas correlações negativas significativas entre a UPDRS e a ativação BOLD bilateralmente nos núcleos, caudado e putamen, segmento externo contra lateral do globo pálido, bilateralmente nos núcleos sub-talâmicos, substantia nigra e tálamo contra lateral.
A bradicinesia é o sintoma que mais consistentemente previu a ativação BOLD nos gânglios da base e tálamo. Além disso, a ativação BOLD no globo pálido interno contra lateral, estava relacionada com tremor.
A atividade cortical reduzida no córtex motor primário e na área motora suplementar nos pacientes com DP recém-diagnosticada, não se relacionam
com sintomas motores 58.
Durante a execução de movimentos automáticos, os pacientes com doença de Parkinson em comparação com os controlos saudáveis, necessitam de mais atividade cerebral no cerebelo, na área pré-motora, no córtex parietal, no
precuneus e córtex pré-frontal para compensar a disfunção dos gânglios basais
51.
Usando RS-fMRI para estudar a conectividade funcional (CF), verificou-se que os pacientes PD apresentam uma disrupção da rede motora. O aumento CF em estado de repouso entre os núcleos sub-talâmicos (NST) e áreas motoras corticais e os sintomas de rigidez e tremor na PD podem estar relacionados a um acoplamento anormal dessas áreas.
Com estudos selecionados foram efetuadas meta análises ponderando o efeito de tamanho da amostra nos 1º e 2º grupo, tendo-se verificado que neles há diferenças significativas (em t-test utilizando p-value) no que respeita á redução de volume e da anisotropia fracionada (AF) da Substância Nigra (SN) entre os doentes de Parkinson e os controlos saudáveis.
Foi detetada uma redução média de volume da SN, estimada pela tamanho do efeito das IRM Estruturais de (0,877, 95% intervalo de confiança de 1,049 a
-0.705, p <0.0001)apresentando os estudos um baixo nível de heterogeneidade
(Q [12] =14,598 p =0,264 I2 =17,795).
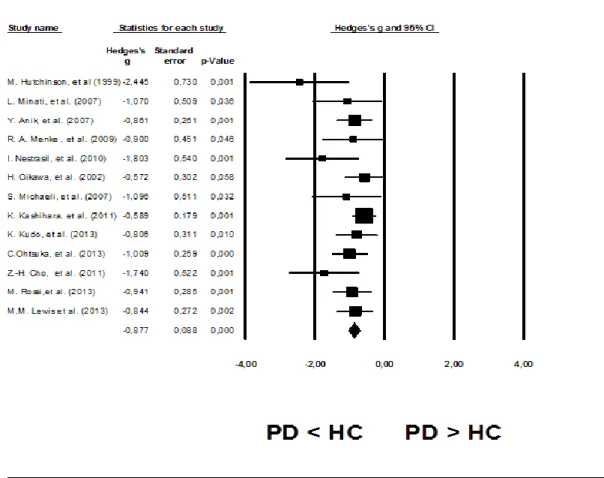
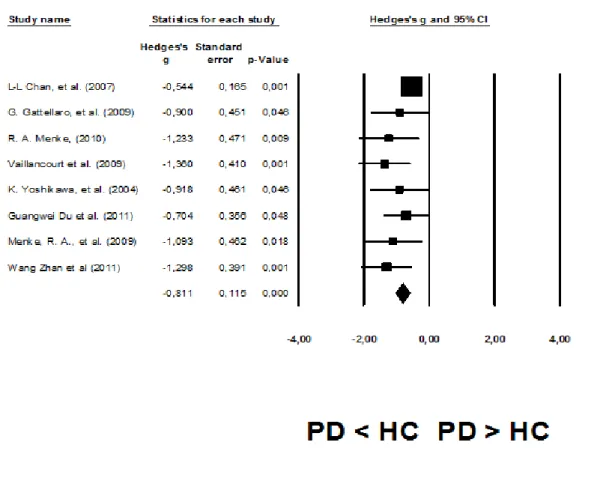
Na AF da SN em DTI a redução média dos valores da AF estimada atendendo ao efeito tamanho dos estudos foi de (0,811, 95% intervalo de confiança de -1,036 a -0,586, p <0,0001) com um baixo nível de heterogeneidade entre os
estudos (Q [6] =7,327, p =0,396 I2 = 4,465).
Conclusões
Estes resultados são encorajadores pois pode-se concluir que os exames de imagem de ressonância magnética possuem uma boa capacidade discriminativa dos doentes de Parkinson em relação aos controlos saudáveis e poderão
desempenhar um papel importante na deteção, na monitorização da progressão e no impacto terapêutico na DP. Entretanto, serão necessários estudos longitudinais e prospetivos com um número mais elevado de doentes utilizando as várias modalidades, isoladamente ou em associação, para melhorar a acuidade diagnóstica e confirmar a sua utilização como bio marcadores.
Palavras-chave:
Doença de Parkinson, Imagens de Ressonância Magnética, DTI (Diffusion Tensor Imaging), fMRI ressonância magnética funcional, Espectroscopia de RMN
Key Words:
MRI; substantia nigra; Parkinson’s disease; DTI; diffusion tensor imaging; fMRI; spectroscopy
Índex
Resumo: ...5 Objetivo...5 Material e métodos ...6 Resultados ...7 Conclusões ...10 Palavras-chave: ...11 Key Words: ...11 GLOSSARY ...15Usefulness of Magnetic Resonance Imaging Examinations in the Diagnosis of Parkinson's disease ...18 Abstract ...18 Objectives: ...18 Methods: ...18 Results: ...18 Conclusions: ...19 Background ...20
Basic principles of Magnetic Resonance. ...22
Structural or conventional magnetic resonance imaging ...22
Contrast T1 ...22
Contrast T2 ...23
Volumetric MRI ...23
Diffusion Tensor Imaging (DTI). ...24
Magnetic Resonance Spectroscopy (MRS)....24
Functional magnetic resonance imaging (fMRI) ...26
Objectives ...27
Material and Methods ...27
Results ...29
1st - Structural and Iron and Neuromelanin MRI ...30
Structural Changes: ...30
Meta-Analysis of structural MRI....39
2nd - DTI (diffusion tensor imaging) with FA and MD ...40
Diffusion changes in circuit of the striatum, cortex and white matter. ...42
Meta-Analysis of DTI studies. ...48
3rd - Single-voxel Spectroscopy ...49
4th - fMRI that includes RS-fMRI (resting state fMRI). ...53
Cortex ...53
Basal ganglia ...55
Resting State fMRI....56
Discussion ...60
Structural and Iron and Neuromelanin MRI...60
DTI (diffusion tensor imaging) with FA and MD ...60
Spectroscopy (MRS) ...61
Functional magnetic resonance imaging, including RS-fMRI (resting state fMRI). ...61
Limitations. ...63
Conclusion ...64
Acknowledgements: ...64
References: ...66
Attachment – 1 (All data collected from structural studies) ...76
Attachment – 2 (All data collected from DTI studies) ...77
Attachment – 3 (All data collected from Spectroscopy studies) ...78
Table index
Table 1 - Studies selection process ... 29
Table 2 - Structural MRI Selected studies ... 34
Table 3 - Quality assessment of the structural MRI studies ... 35
Table 4 - Studies of Structural MRI not included in the Meta-Analysis ... 37
Table 5 - Studies Selected for the Meta-Analysis of Structural MRI... 38
Table 6 - Meta-Analysis of p-values (Hedge’s g) of the volume's differences of SN between PD and HC in Structural MRI ... 39
Table 7 - Selected Studies of DTI in Parkinson's disease... 44
Table 8 - Quality assessment of DTI studies ... 45
Table 9 - Studies not included in the DTI Meta-Analysis ... 46
Table 10 - Studies included in the DTI Meta-Analysis of FA in SN ... 47
Table 11 - Meta-Analysis of DTI (FA) in SN ... 48
Table 12 - Selected Spectroscopy Studies ... 51
Table 13 - Quality assessment of the Spectroscopy studies... 52
Table 14 - Selected studies of fMRI and RS-fMRI ... 58
Table 15 - Quality assessment of the fMRI and RS-fMRI studies ... 59
Figure Index Figure 1 - T1 and T2 MRI Images ...23
GLOSSARY
1H-MRS: Proton Magnetic Resonance Spectroscopy 3D: Three-Dimensional
AD: Alzheimer's disease
ADC: Apparent Diffusion Coefficient ASL: Arterial Spin Labeling
AUROC: Area under the ROC
BOLD: Blood Oxygen Level Dependent CBD: Corticobasal Degeneration
CC: Corpus Callosum
CDA: Coefficient of Diffusibility Apparent Cho: choline-containing compounds Cr: Creatine + phosphocreatine
DESPOT: Driven Equilibrium Single Pulse Observation of T1/T2 DKI: Diffusional Kurtosis Imaging
DTI: Diffusion Tensor Imaging; DWI: Diffusion- Weighted Imaging; FA: Fractional Anisotropy
fMRI: functional MRI GP: Globus Palidus HC: Healthy Controls
IDP: Idiopathic Parkinson´s disease LB: Lewy Bodies
LBD: Lewy Body Dementia LC: Locus Coeruleus MA: Meta-Analysis MD: Mean Diffusivity MRI: Conventional MRI
MRI: Magnetic Resonance Imaging
MRS: Magnetic Resonance Spectroscopy MSA: Multiple System Atrophy;
MTR: Magnetization Transfer Ratio NAA: N-acetyl aspartate
PD: Parkinson Disease
PSP: Progressive Supra nuclear Palsy RF: Radio Frequencies
RN: Red Nucleus
ROI: Region of Interest
RS-fMRI: Resting State Functional MRI RSNs: Resting-State Networks
SIRRIM: Segmented Inversion Recovery Ratio Imaging SMA: Supplementary Motor Area;
SN: Substantia Nigra
SNc: Substantia Nigra pars compacta TFE: Turbo Field Echo
T-test: t-Student test
UPDRS: Unified Parkinson Disease Rating Scale VBA: Voxel-Based Analysis.
Usefulness of Magnetic Resonance Imaging Examinations in the
Diagnosis of Parkinson's disease
A systematic review and Meta-Analysis
Abstract
Objectives:
We performed a systematic review of the studies comparing the accuracy of the different modalities of magnetic resonance imaging in the diagnosis of Parkinson's disease with clinical diagnosis and healthy controls, exploring its potentials as biomarkers.
Methods:
We searched for studies and research reviews in, the MEDLINE, EMBASE, B-on (the online knowledge Library) databases, and in bibliography cited in relevant studies, comparing the MRI differences between Parkinson’s disease patients and healthy controls to access the accuracy of the different methods, the results were extracted and estimates were pooled by random-effects meta-analysis. Results:
834 studies were identified using MRI in PD but only 48 studies were eligible for inclusion, with a total of 1362 Parkinson’s disease patients and 1023 healthy
controls, whose results were divided into four groups: 1st- Structural, Iron and Neuromelanin MRI; 2nd- DTI (diffusion tensor imaging) with FA and MD; 3rd-
Spectroscopy (MRS); 4th- fMRI that includes RS-fMRI (resting state fMRI). It was
found changes in basal ganglia, thalamus, white and gray matter in the different
MRI modalities. In the 1st and 2nd group we performed a meta-analysis for the
Volume and Fractional Anisotropy (FA) of the Substantia Nigra (SN) respectively. A good effect size of the reduction was found for both in the PD patients versus controls in structural MRI (-0,877, 95% confidence interval -1,049 to -0.705, p < 0.0001) and in DTI (-0,811, 95% confidence interval -1,036 to -0,586, p < 0,0001). With a low level of heterogeneity.
Conclusions:
Magnetic Resonance Imaging has a good accuracy in separate PD patients from Healthy Controls, and could have a role in detecting pre manifest disease, monitoring progression and drug therapeutic impact. Larger prospective and longitudinal studies using DTI, Spectroscopy, fMRI, RS-fMRI and other modalities of MRI on larger cohorts of patients with Parkinson´s disease are needed to investigate some of the actual encouraging preliminary findings. Standardization of protocols is a need and will be a reality in the future and that will help us to get better and comparable results. Combination of modalities could improve the
diagnostic accuracy.
Key Words: MRI; substantia nigra; Parkinson’s disease; DTI; diffusion tensor
Background
Parkinson's disease (PD) is a progressive neurodegenerative disease that affects negatively the motor control in approximately 2% of the population above 65
years 30. In the pathophysiology of motor changes in the DP a selective loss of
dopaminergic neurons in the caudal and ventral lateral layers in the substantia
nigra pars compacts (SNc) is involved, which project to the striatum57, with the
appearance of intracellular inclusions known as Lewy bodies (LB), aggregation of neurofilaments, lipids, iron, hyper phosphorylated proteins, ubiquitin and
Alpha-synuclein 55 that are located in the axonal processes of neurons, indicating
the presence of neurodegeneration in Parkinson's patients 5.
Neuronal loss and the Lewy bodies are not restricted to the SNc they are also found in the dorsal nucleus of the Vagus, basal nucleus of Meynert, locus
coeruleus and cortical neurons 48. The loss of dopaminergic neurons in substantia
nigra causes the depletion of dopamine in the striatum, in the caudolateral sensorimotor putamen and also the loss of neurons from other dopaminergic and non-dopaminergic areas of the brain which leads to the onset of clinical manifestations of PD.
Another characteristic of SN projection neurons is that they contain a pigment called neuromelanin. Neuromelanin-laden neurons are therefore also present in the locus coeruleus (LC). Neuromelanin exhibits ferrous properties that can affect the MRI signal in the presence of other metals found in the brain stem, such as iron and copper
Although PD is frequent, it may be difficult to diagnose clinically, particularly in the early stages and approximately 5 to 10% of patients diagnosed with PD are misdiagnosed. Early symptoms are subtle and often attributed to aging. The main
signs of Parkinson's disease are, bradykinesia, resting tremor, rigidity and
postural instability. However a diagnoses accuracy (specificity) of 90% is the best we can achieve with the evaluation based on clinical diagnostic criteria. On the other side, 15 to 25% of the patients diagnosed with PD by clinical criteria, present at the autopsy other diagnoses such as, multiple system atrophy (MSA)
Progressive Supranuclear Palsy (PSP) Alzheimer's disease (AD),
cerebrovascular disease, essential tremor, senile tremor, tremor by lesion of Red nucleus.
The improvement in diagnostic accuracy and the ability to predict the rate of progression are of the most importance to the development of neuroprotective treatments.
The need to find a non-invasive methods of diagnosis is paramount, due the morbidity and ethical issues that would arise, with brain biopsies as a method of definitive diagnosis. Even in the best centers there is an important proportion of disagreement between the clinical-based diagnosis and the post-mortem diagnosis, which is obtained by histopathology.
Magnetic resonance imaging in its different modalities provides us with a tool to investigate "in Vivo" the cortical and sub cortical regions that we know to be affected in the PD, a methodology currently very studied. Several recent reports have demonstrated the usefulness of these techniques as potentials biomarkers of diagnostic and progression of Parkinson's disease.
In This systematic review we will look at advanced MR techniques that can provide SN Visualization: Volumetry, magnetization transfer, Diffusion tensor imaging (DTI), neuromelanin imaging, Spectroscopy, fMRI and resting-state fMRI (RS-fMRI) that have also been used to investigate respectively SN anatomy and functional connectivity.
Basic principles of Magnetic Resonance.
On MRI the magnetic properties of the hydrogen nuclei of the human body are used. The hydrogen nucleus has only a proton which provides a good NMR signal, in addition, it is the most abundant element in the human body. We use their properties and their interaction with a strong external magnetic field and radio frequencies (RF) to produce a detailed image of the human body. This magnetic field is measured in Tesla units. One (1) Tesla unit is equivalent to 10.000 Gauss. The Earth's magnetic field is about 0.5 Gauss, which implies that when we are using a 1 T magnet, it will generate around the individual a magnetic
field 20,000 times stronger than the Earth 16. Currently equipment’s capable of
generating 3, 4 and 7T already exists for clinical use, and there are 14 T systems that are used for research but that will soon be used in "in Vivo" diagnostics. Structural or conventional magnetic resonance imaging
Contrast T1
The T1 relaxation time is the time it takes for 63% of the protons to align with the external magnetization field, after a RF pulse stimulation. A sampling of the NMR signals in a T1 relaxation gives T1 weighted images. T1 time is tissue class dependent, for example in lipids protons will relax faster than protons in water, or in molecules that are much larger, which is one of the reasons why MR images have good tissue contrast. In the brain, T1-weighting make that the nerve
connections of white matter to appear white, and the congregations of neurons
of grey matter to appear grey, while cerebrospinal fluid appears dark 2.
Contrast T2
The T2 weighted images are obtained after a refocusing of the spins in the x-y direction following a 180º RF pulse. T2 relaxation is caused by reduction in magnetization in the X -Y plane, also called transverse relaxation. This is caused by in-homogeneity of the magnetic field on a molecular level, leading to a dephasing of the protons with decay of the transverse magnetization. T2 relaxation time describes how fast the decay of the NMR is because of T2 relaxation. T2 time is longer in pure water than tissues or liquids containing protein. The contrast of "white matter," "grey matter'" and "cerebrospinal fluid" is
reversed using T2 imaging compared to T1 imaging. See figure 1, below 2.
Volumetric MRI
The ability to acquire three-dimensional high resolution imaging, (3D) MRI is the result of technical improvements and analytical techniques. "Low flip angle gradient echo Imaging" is a method that enables this analysis. Through this method may be obtained "thin slices", with size of voxel of 1 x 1 x 1 mm or smaller depending on the intensity of magnetic fields generated by the system. An advantage the MRI 3D is the ability to get detailed images of complex anatomical structures as the brain.
Diffusion Tensor Imaging (DTI).
This powerful concept goes beyond conventional magnetic resonance imaging because it gives us the image of movement of molecules at a microscopic scale. Diffusion is a 3D process that can perform identically in all directions (isotropic) as in the cerebral cortex, or in an aligned direction (anisotropic) as in the white matter, where the fibers influence the movement of the molecules. The latest application of this technique is the follow-up of the nerve fibers inside the brain, the tractography, which, in combination with functional magnetic resonance
imaging, can open a new window in the study of connectivity of brain structures4.
During 50 msec water molecules move in the brain an average distance of 10 µm crossing and interacting with many structures such as tissue, cell membranes, fibers or macromolecules. The overall effect of diffusion in an image voxel of a few mm3, reflects statistically the movement and distribution of water molecules present in the voxel. The observation of this movement gives us the visualization of the geometric organization of the tissue. This is the only non-invasive way to observe this diffusion "in vivo”. Diffusion is an intrinsic physical process and totally independent of the effect of MR or magnetic field. It's not the case with most
parameters accessible on RM such as T1 or T2 4. The magnitude (diffusibility)
and directionality (anisotropy) of water molecules in the brain can be quantified by its coefficient of diffusibility apparent (CDA) and fractional anisotropy (FA)
respectively 7.
Magnetic Resonance Spectroscopy (MRS).
MRS provides a non-invasive method to quantify the concentration of metabolites visible on the MRI of the brain. The technique is based on the general principle,
which the resonant frequency of a metabolite is specific and depends on the chemical environment. Most of the studies of clinical MRS have been concentrated in metabolites visible on a proton spectroscopy (1H-MRS), measured in a given volume (Voxel) of individualized tissue and located in the brain. The metabolites of interest and that can be more easily studied with 1H-MRS in long echo periods are, the N-acetyl-aspartate (NAA), creatine / phosphocreatine (Cr) and choline (Cho). The synthesis and degradation of the
membrane in neuronal cells can produce changes in Cho 61. The lactate is an
indicator of anaerobic Glycolysis. In addition, several other compounds and neurotransmitters can also be studied, such as glutamate, glutamine, GABA,
myoinositol 13. The NAA is contained almost exclusively within the neurons 56
and, therefore, it is considered that it can act as an “in vivo” marker of neuronal loss or dysfunction. In most cases, measurements of NAA were based on regional ratio NAA /Cr.
The justification for the use of the resonance of Cr as the denominator is based on the concept that the creatine and phosphocreatine are in chemical equilibrium and the concentration of both compounds should remain unchanged in neurodegenerative disease processes. Alternative methods are now available for the measurement of concentrations of metabolites, such as those that use water
as an internal standard for calibrating 36 and those involving calibration to an
external standard 34, which should allow a significant improvement on quantitative
accuracy of 1H-MRS 37. It is now possible, to quantify in absolute the millimolar
Functional magnetic resonance imaging (fMRI)
Functional magnetic resonance imaging (fMRI) is a technique that allows us to view the activated brain areas in relation to a specific task or stimulus driven paradigms. The most common clinical use is to evaluate and identify critical functional areas of the brain in pre-surgery, in order to facilitate the implementation of a surgery as functional as possible. The fMRI is also being used in the study of normal functional anatomy, to investigate the phenomenon of neuroplasticity in healthy individuals and in patients with various neurological
or psychiatric processes, including multiple sclerosis 42 and the PD.
When evaluating changes in brain metabolism (i.e., fluctuations in oxygenated blood in relation to the de-oxygenated), fMRI measures the increases and
decreases of activity of regional brain over time. Specifically, fMRI allows
measurements of tissue perfusion, changes of the blood volume or changes in oxygen concentration levels. The amount of oxygenated blood delivered to specific areas of the brain increases following the increased metabolic activity. The contrast on the blood oxygen level dependent is usually referred as BOLD. However another fMRI technique was developed the Arterial Spin Labeling (ASL) which is a method that measures brain blood flow quantitatively per unit of tissue
mass 13 and thus assess perfusion changes at the brain level.
The main advantages of fMRI as a technique for imaging measurement of brain activity related to a specific motor or sensorial task are, for obtaining the signal it does not require injections of radioactive isotopes, and the resolution in terms of functional image is usually about 1.5 x 1.5 mm, although resolutions less than 1 mm are already possible. The fMRI has been widely used to explore the
functional neuroanatomy of cognitive and motor functions of many diseases, as
in the case of PD 47.
In recent years, there is an increasing interest in the application of the technique in resting state, called “Resting State fMRI” (RS-fMRI) or functional connectivity magnetic resonance imaging. RS-fMRI investigates synchronous activations between regions that are spatially distinct, that occur in the absence of a stimulus or task, to identify the links in a rest state (RSNs) "resting-state networks”. The focus of RS-fMRI are the spontaneous fluctuations of low frequency (0.1 Hz <) in BOLD signal. The functional significance of these fluctuations was presented for the first time by Biswal and colleagues in 1995. In this study, subjects were told
not to perform any cognitive, language or motor tasks 26.
A systematic review that will be performed is to analyze the studies carried out and published up to the present date, looking for evidence that justify the use of these diagnostic tests for Parkinson's disease.
Objectives
Primary: Systematic review of the studies comparing the accuracy of the different modalities of magnetic resonance imaging in the diagnosis of Parkinson's disease with clinical diagnosis and healthy controls, exploring its potentials as biomarkers.
Material and Methods
Literature search and data extraction.
A search for papers published, until August 2013, was done in MEDLINE, EMBASE, B-on (the online knowledge Library). We also carried out research in
the bibliography cited in relevant studies, and on Google Scholar (http://scholar.google.com/). Some bibliography was asked to the companies related to this type of diagnostic technology. We used for search terms including, "Parkinson", "Magnetic resonance imaging", "MRI", "DTI", "Diffusion tensor imaging", "Spectroscopy", "MRI of Iron", "fMRI", "bold", “Neuromelanin”, combined with Boolean operators suitable for each search. We restricted our search to the languages English, French, Spanish and Portuguese. All titles and abstracts from the retrieved articles were screened by a single reviewer and the full text of those that may be eligible was obtained. Reference lists of identified studies were searched for additional studies. We reviewed all articles and extracted the data. We included the studies if they, had more than 5 patients, were published as full text articles and used MRI, DTI, fMRI, RS-fMRI, Spectroscopy, Iron and neuromelanin MRI of PD patients confirmed with clinical diagnostic criteria and comparing them with a healthy control group.
We excluded studies that did not use formal clinical diagnostic criteria, studies including patients undergoing deep brain stimulation, studies analyzing mixed patient groups jointly, for example, including both idiopathic and vascular Parkinsonism, as well as duplicate publications, reported cases, editorials, comments, letters, animal studies, studies of differential diagnosis with other parkinsonian syndromes and PD dementias.
From each study a single reviewer recorded the following data when available: reference, year, title, number of patients and controls, the mean age, the Hoehn & Yahr stage, the medication, the modality, the studied region, the magnetic field strength of the MRI scanner, conclusions and if possible the specificity, sensitivity, area under the ROC, p-values of the t-test (Table 2 and Table 7).
Due to the heterogeneity of the studies designs and the missing data in relation with Sensitivity and Specificity and area under the ROC curve, we decided to use for the Meta-Analysis of the different region the brain, those presenting p-values of the t-test results comparing patients with PD and healthy controls.
Results
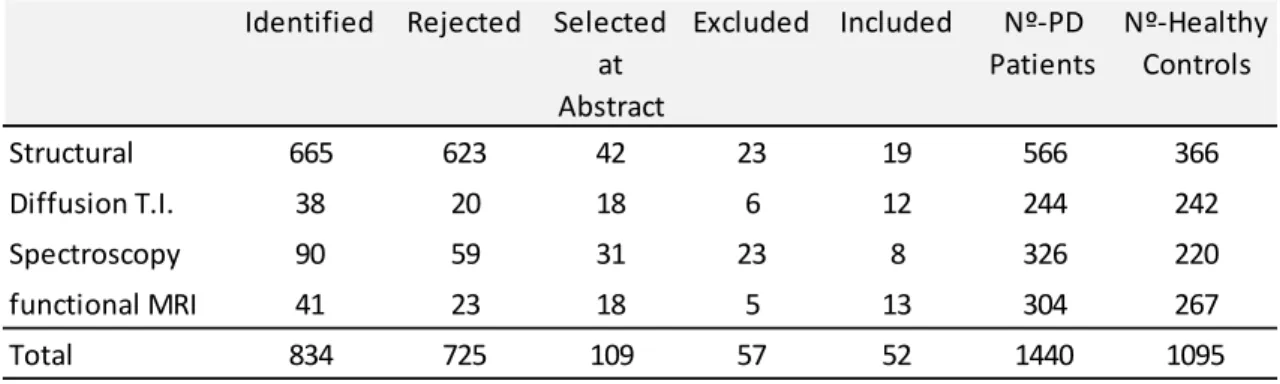
We identified 834 studies using MRI in PD, but when we started the rejection due to duplications and some of the other exclusion criteria we ended up 109. By reading the abstracts we concluded that 61 were not eligible for inclusion due to the exclusion criteria. 52 studies were eligible for inclusion, with a total of 1440 Parkinson’s disease patients and 1095 healthy controls, as we can see in the Table 1 studies selection process. The key details of eligible studies are provided in the Table 2 and Table 7.
The studies were divided into 4 groups:
1st -Structural and Iron and Neuromelanin MRI; 2nd - DTI (diffusion tensor
imaging) with FA and MD; 3rd-Spectroscopy (MRS); 4th- fMRI that includes
RS-fMRI (resting state RS-fMRI). Table 1 - Studies selection process
Identified Rejected Selected at Abstract Excluded Included Nº-PD Patients Nº-Healthy Controls Structural 665 623 42 23 19 566 366 Diffusion T.I. 38 20 18 6 12 244 242 Spectroscopy 90 59 31 23 8 326 220 functional MRI 41 23 18 5 13 304 267 Total 834 725 109 57 52 1440 1095
1st - Structural and Iron and Neuromelanin MRI Structural Changes:
Reviewing the published literature selected up to date, we found that several studies began investigating the substantia nigra degeneration on disease of Parkinson's through magnetic resonance imaging (MRI), using different approaches. Some used the images of contrast T2W as Pujol et al. (1992), Stern et al. (1989) but M. Hutchinson et al. claimed in the study published in 1999, with
6 PD patients with mean age of 58 years old and 6 age-matchedHealthy Controls
(HC) that they have shown for the first time, the potential effectiveness of sequences of the Inversion recovery images, in substantia nigra, to separate Parkinson's patients and healthy control. However, more work will be needed to refine the technique, in particular the use of thinner slices, faster sequences, and
the use of automated image segmentation techniques 33.
M. Hutchinson et al. in 2006 in another study with 12 PD and 12 age-matched HC, introduced an approach that using the SIRRIM (Segmented Inversion Recovery Ratio Imaging) technique based on two IR imaging sequences that were designed to suppress white and gray matter to assess loss of neural cells in situ by means of a ratio image (white matter suppressed image to gray matter suppressed image) and conclude that these technique Is sensitive enough to identify patients in early-stage of IPD ( idiopathic Parkinson’s Disease) and that the radiological index correlated with the Unified Parkinson Disease Rating Scale
(UPDRS) 40.
Anik Yonca et al. in 2007 using a new technique MTR (magnetization transfer ratio imaging) in a group of 33 early period of PD (in the first year of diagnostic)
with a mean age of 66.9 years old patients and 30 HC, concluded that these can be a useful technique for assessing PD because the decrease in MTR is more prominent in the SN pars compacta and probably begins before the onset of clinical disease. This reduction of MTR was also found in the pars reticulata, pons
and Red nucleus of PD patients 63.
Deoni et al., in 2005 describes a quantitative Imaging of high resolution technique, using the balance of single pulse driven of T1 (DESPOT1), which proved to allow a better visual discrimination between the main nuclei of the
thalamus 12.
R. Menke et al., in 2009 combining the Volumetry of SN, T1 (DESPOT1) and their connectivity with the thalamus by DTI in a group of 10 PD patients with mean age of 63,7 and 10 age-matched HC, achieved in the detection of PD patients a
sensitivity of 100% and a specificity of 80% 30.
Shalom Michaeli et al., in their study in 2007 using a 4Tesla equipment and 8 PD patients with a mean age of 61 and 8 age-matched HC, demonstrates that a new magnetic resonance method "rotating transverse frame (T2p) and longitudinal (T1p) T2 MRI methods" are sensitive to iron and neuronal loss respectively, that there is a statistically significant difference between the Parkinson's patients and
controls 46.
Maija Rossi et al. in 2013, using a 3T equipment conducted a study, with 36 PD patients with mean age of 71 and 21 age-matched HC, and acquired the sequences Malpt, SWI and T2W. The string Malpt was used to perform T2* the mapping that allowed the calculation of R2* (R2 = 1/* T2*). After the execution of statistical calculations she conclude that R2* and SWI can detect the differences
between the DP and controls, but not with T2W. Clinically the results of R2* were stronger than the other two sequences because they reflected clinical observations and that these changes were probably caused by iron deposits that
not only were present in SN but also in GP (Globus Pallidus) 41.
Mechelle Lewis et al., 2013, using the same sequence and calculation R2* in a 38 recruited PD patients, mean age 60.6 and 23 age-matched HC, found that the values obtained in the Red Nucleus (RN) correlated with the UPDRS in those patients in whom they had suspended the L-dopa medication, but not with the duration of the illness or medication dosage. That the values of R2* in RN were significantly higher in patients with dyskinesia when compared to those without dyskinesia, and that the values of these, are not different from healthy controls. It was found the association between high iron content in RN with dyskinesia
associated with PD 27.
K. Kudo et al., 2013, using a 3D TFE (Turbo Field Echo) technique with off-resonance magnetization transfer pulse for neuromelanin-sensitive MRI on a 3T scanner in 18 PD patients with mean age 68.8 and 27 age-matched HC, stated that these semi-automated method of volume measurement of the substantia nigra pars compacta, can distinguish the PD group from the control group with
high sensitivity (83%) and specificity (85%), especially for early stage of PD 23.
Chigumi Ohtsuka et al., 2013 using a 3T scanner in a 61 selected PD patients divided in 2 groups 37 consecutive patients with suspected early stage PD that had not received any medical or surgical treatment for Parkinsonism and were at Hoehn & Yahr (H&Y) stage 1–2. And 31 consecutive patients with advanced PD having an H&Y stage of 3–5, who were hospitalized for deep brain stimulation or
medication adjustment and 22 age-matched healthy subjects. They concluded that Neuromelanin-sensitive MR imaging is able to detect significant signal attenuation in the lateral part of the SNc (AUROC 0.86) and in the LC (locus coeruleus) (AUROC 0.88), even in patients with early PD. The results suggested that neuromelanin-sensitive MR imaging can discriminate between PD patients, even at the early stage, and healthy individuals with high sensitivity and
specificity67.
Zang-Hee Cho et al., 2011, using a 7.0T MRI, in an attempt to directly visualize the SN and quantify the differences in shape and boundaries of SN between PD subjects in comparison with the normal control subjects, uses a group of 10 PD patients with a mean age of 58.3 for stage H&Y 1 and 59 for the stage H&Y 3, and conclude that it appears to be the clear visualization and eventual quantitation of PDs and normal controls based on the difference in the gross anatomical shape and the quantitative undulation values between the controls
and PDs.he shown significant differences between the two groups (P = 0.0002)
69.
P.A. Gowland et al., 2013, Using a high-resolution 7 Tesla scanner, 10 PD patients with mean age of 64 and 8 age and sex-matched HC, assessed to a direct in vivo visualization of nigrosome, substructures of the substantia nigra pars compacta (SNc), they concluded that the absence of nigrosome 1 in the SNc on MRI scans might prove useful in developing a neuroimaging diagnostic test
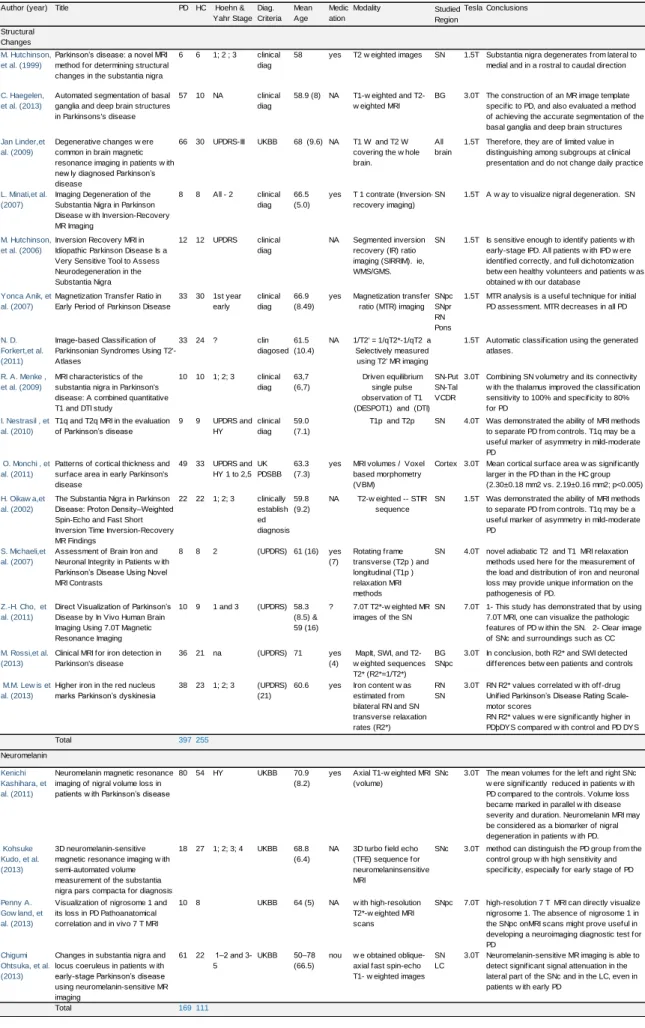
Table 2 - Structural MRI Selected studies
Author (year) Title PD HC Hoehn & Yahr Stage Diag. Criteria Mean Age Medic ation Studied Region Tesla Conclusions Structural Changes M. Hutchinson, et al. (1999)
Parkinson’s disease: a novel MRI method for determining structural changes in the substantia nigra
6 6 1; 2 ; 3 clinical diag
58 yes SN 1.5T Substantia nigra degenerates from lateral to medial and in a rostral to caudal direction
C. Haegelen, et al. (2013)
Automated segmentation of basal ganglia and deep brain structures in Parkinsons's disease
57 10 NA clinical diag
58.9 (8) NA BG 3.0T The construction of an MR image template specific to PD, and also evaluated a method of achieving the accurate segmentation of the basal ganglia and deep brain structures
Jan Linder,et al. (2009)
Degenerative changes w ere common in brain magnetic resonance imaging in patients w ith new ly diagnosed Parkinson’s disease
66 30 UPDRS-III UKBB 68 (9.6) NA All brain
1.5T Therefore, they are of limited value in distinguishing among subgroups at clinical presentation and do not change daily practice
L. Minati,et al. (2007)
Imaging Degeneration of the Substantia Nigra in Parkinson Disease w ith Inversion-Recovery MR Imaging
8 8 All - 2 clinical diag
66.5 (5.0)
yes SN 1.5T A w ay to visualize nigral degeneration. SN
M. Hutchinson, et al. (2006)
Inversion Recovery MRI in Idiopathic Parkinson Disease Is a Very Sensitive Tool to Assess Neurodegeneration in the Substantia Nigra
12 12 UPDRS clinical diag
NA SN 1.5T Is sensitive enough to identify patients w ith early-stage IPD. All patients w ith IPD w ere identified correctly, and full dichotomization betw een healthy volunteers and patients w as obtained w ith our database
Yonca Anik, et al. (2007)
Magnetization Transfer Ratio in Early Period of Parkinson Disease
33 30 1st year early clinical diag 66.9 (8.49) yes SNpc SNpr RN Pons
1.5T MTR analysis is a useful technique for initial PD assessment. MTR decreases in all PD
N. D. Forkert,et al. (2011)
Image-based Classification of Parkinsonian Syndromes Using T2'-Atlases
33 24 ? clin diagosed
61.5 (10.4)
NA 1.5T Automatic classification using the generated atlases.
R. A. Menke , et al. (2009)
MRI characteristics of the substantia nigra in Parkinson's disease: A combined quantitative T1 and DTI study
10 10 1; 2; 3 clinical diag 63,7 (6,7) SN-Put SN-Tal VCDR
3.0T Combining SN volumetry and its connectivity w ith the thalamus improved the classification sensitivity to 100% and specificity to 80% for PD
I. Nestrasil , et al. (2010)
T1q and T2q MRI in the evaluation of Parkinson’s disease 9 9 UPDRS and HY clinical diag 59.0 (7.1)
SN 4.0T Was demonstrated the ability of MRI methods to separate PD from controls. T1q may be a useful marker of asymmetry in mild-moderate PD
O. Monchi , et al. (2011)
Patterns of cortical thickness and surface area in early Parkinson's disease 49 33 UPDRS and HY 1 to 2,5 UK PDSBB 63.3 (7.3)
yes Cortex 3.0T Mean cortical surface area w as significantly larger in the PD than in the HC group (2.30±0.18 mm2 vs. 2.19±0.16 mm2; p<0.005)
H. Oikaw a,et al. (2002)
The Substantia Nigra in Parkinson Disease: Proton Density–Weighted Spin-Echo and Fast Short Inversion Time Inversion-Recovery MR Findings 22 22 1; 2; 3 clinically establish ed diagnosis 59.8 (9.2)
NA SN 1.5T Was demonstrated the ability of MRI methods to separate PD from controls. T1q may be a useful marker of asymmetry in mild-moderate PD
S. Michaeli,et al. (2007)
Assessment of Brain Iron and Neuronal Integrity in Patients w ith Parkinson’s Disease Using Novel MRI Contrasts
8 8 2 (UPDRS) 61 (16) yes (7)
SN 4.0T novel adiabatic T2 and T1 MRI relaxation methods used here for the measurement of the load and distribution of iron and neuronal loss may provide unique information on the pathogenesis of PD.
Z.-H. Cho, et al. (2011)
Direct Visualization of Parkinson’s Disease by In Vivo Human Brain Imaging Using 7.0T Magnetic Resonance Imaging
10 9 1 and 3 (UPDRS) 58.3 (8.5) & 59 (16)
? SN 7.0T 1- This study has demonstrated that by using 7.0T MRI, one can visualize the pathologic features of PD w ithin the SN. 2- Clear image of SNc and surroundings such as CC
M. Rossi,et al. (2013)
Clinical MRI for iron detection in Parkinson's disease
36 21 na (UPDRS) 71 yes (4)
BG SNpc
3.0T In conclusion, both R2* and SWI detected differences betw een patients and controls
M.M. Lew is et al. (2013)
Higher iron in the red nucleus marks Parkinson’s dyskinesia
38 23 1; 2; 3 (UPDRS) (21)
60.6 yes RN SN
3.0T RN R2* values correlated w ith off-drug Unified Parkinson’s Disease Rating Scale-motor scores RN R2* values w ere significantly higher in PDþDYS compared w ith control and PD DYS subjects Total 397 255 Neuromelanin Kenichi Kashihara, et al. (2011)
Neuromelanin magnetic resonance imaging of nigral volume loss in patients w ith Parkinson’s disease
80 54 HY UKBB 70.9 (8.2)
yes SNc 3.0T The mean volumes for the left and right SNc w ere significantly reduced in patients w ith PD compared to the controls. Volume loss became marked in parallel w ith disease severity and duration. Neuromelanin MRI may be considered as a biomarker of nigral degeneration in patients w ith PD.
Kohsuke Kudo, et al. (2013)
3D neuromelanin-sensitive magnetic resonance imaging w ith semi-automated volume measurement of the substantia nigra pars compacta for diagnosis of Parkinson’s disease
18 27 1; 2; 3; 4 UKBB 68.8 (6.4)
NA SNc 3.0T method can distinguish the PD group from the control group w ith high sensitivity and specificity, especially for early stage of PD
Penny A. Gow land, et al. (2013)
Visualization of nigrosome 1 and its loss in PD Pathoanatomical correlation and in vivo 7 T MRI
10 8 UKBB 64 (5) NA SNpc 7.0T high-resolution 7 T MRI can directly visualize nigrosome 1. The absence of nigrosome 1 in the SNpc onMRI scans might prove useful in developing a neuroimaging diagnostic test for PD
Chigumi Ohtsuka, et al. (2013)
Changes in substantia nigra and locus coeruleus in patients w ith early-stage Parkinson’s disease using neuromelanin-sensitive MR imaging 61 22 1–2 and 3-5 UKBB 50–78 (66.5) nou SN LC
3.0T Neuromelanin-sensitive MR imaging is able to detect significant signal attenuation in the lateral part of the SNc and in the LC, even in patients w ith early PD
Total 169 111
MapIt, SWI, and T2-w eighted sequences T2* (R2*=1/T2*) Iron content w as estimated from bilateral RN and SN transverse relaxation rates (R2*)
Axial T1-w eighted MRI (volume)
3D turbo field echo (TFE) sequence for neuromelaninsensitive MRI w ith high-resolution T2*-w eighted MRI scans w e obtained oblique-axial fast spin-echo T1- w eighted images 7.0T T2*-w eighted MR images of the SN Modality T2 w eighted images T1-w eighted and T2-w eighted MRI T1 W and T2 W covering the w hole brain.
T 1 contrate (Inversion-recovery imaging)
Segmented inversion recovery (IR) ratio imaging (SIRRIM). ie, WMS/GMS. Magnetization transfer
ratio (MTR) imaging
T1p and T2p
MRI volumes / Voxel based morphometry (VBM) T2-w eighted -- STIR sequence Rotating frame transverse (T2p ) and longitudinal (T1p ) relaxation MRI methods 1/T2' = 1/qT2*-1/qT2 a Selectively measured using T2' MR imaging Driven equilibrium single pulse observation of T1 (DESPOT1) and (DTI)
Quality Assessment of the Structural MRI studies:
No Unclear Yes
Table 3 - Quality assessment of the structural MRI studies
P a ti e nt s > a 5 ca sos W a s the s pe ct rum of pa ti e nt s re pr e se nt a ti v e ? W e re s e le ct ion cr it e ri a cl e a rl y de scr ibe d? Is t he r e fe re nce s ta ndar d lik e ly t o cor re ct ly cl a ss if y t he t a rge t condi ti on? Is t he t im e pe ri od be tw e e n re fe re nce st a ndar d a nd inde x te st s hor t e noug h ? Did the w hol e s a m pl e or a r a ndom se le ct ion of t he s a m pl e , re ce iv e v e ri fi ca ti on us ing a r e fe re nce st a ndar d of di a gn os is ? ( pa rt ia l D id pa ti e nt s re ce iv e t he s a m e re fe re nce s ta ndar d re gar dl e ss of t he te st r e sul t? W a s the e xe cut ion of t he r e fe re nce st a ndar d de scr ibe d in suf fi ci e nt de ta il to pe rm it it s re pl ica ti on? ( re fe re nce st a ndar d e xe cut ion) W e re t he r e fe re nce s ta ndar d re sul ts int e rpr e te d w it hout k now le dg e of t he re sul ts of t he t e st ? W e re t he t e st r e sul ts int e rpr e te d w it hout k now le dg e of t he r e sul ts of the r e fe re nce s ta ndar d? W e re uni nt e rpr e ta bl e / int e rm e di a te te st r e sul ts r e por te d? (uni nt e rpr e ta bl e t e st r e sul ts ) W e re w it hdr a w a ls f rom t he s tudy e xpl a ine d? W a s the e xe cut ion of t he t e st de scr ibe d in suf fi ci e nt de ta il to pe rm it re pl ica ti on of t he t e st ? ( inde x te st e xe cut ion) Autor 1 2 3 4 5 6 7 8 9 10 11 12 M. Hutchinson, et al. (1999) 6 C. Haegelen, et al. (2013) 57 Jan Linder,et al. (2009)
66 L. Minati,et al. (2007) 8 M. Hutchinson, et al. (2006) 12 Yonca Anik, et al. (2007)
33 N. D. Forkert,et al. (2011) 33 R. A. Menke , et al. (2009) 10 I. Nestrasil , et al. (2010) 9 O. Monchi , et al. (2011) 49 H. Oikawa,et al. (2002) 22 S. Michaeli,et al. (2007) 8 Z.-H. Cho, et al. (2011) 10 M. Rossi,et al. (2013) 36 M.M. Lewis et al. (2013) 38 Neuromelanin Kenichi Kashihara, et al. (2011)
80 Kohsuke Kudo, et al. (2013)
18 Penny A. Gowland, et al. (2013)
10 Chigumi Ohtsuka, et al. (2013)
Looking separately at the groups we concluded that we only had data to do a Meta-Analysis (MA), using the sigma (p-value) of the t- Student test to compare (using Hedge´s g, effect size calculation) the differences between the PD patients
and healthy controls, in the 1st and 2nd groups.
In the first group we analyzed the differences of the SN regarding to the volume or size measured using different methodologies and in the second we measured FA in the SN.
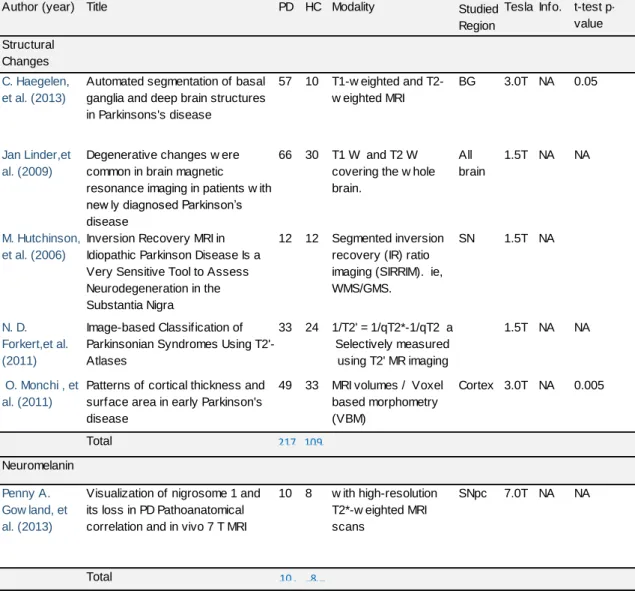
In the first group of 19 selected studies in the table 2, 6 were not included in the
MA, table 4: the 1st was a basal ganglia method segmentation where the
differences in volume of SN between PD and HC were not referred (C Haegelen,
et al.2013); a 2nd where no p-value was found (M Hutchinson et al. 2006); a 3rd
with a good sensitivity (0.94)and a good specificity (0.91) in the diagnostic
accuracy but which did not present the t-test (Forkert 2011); a 4th where they
presented the excellent capacity to differentiate the nigrosome in a 7Tesla system
but did not present the results of the t-test (Gowland2013); 5th in this study the
t-test has a very good result but the differences found were in the cortex surface
(Monchi 2011) and 6th where they found changes but not referent to the SN
Table 4 - Studies of Structural MRI not included in the Meta-Analysis
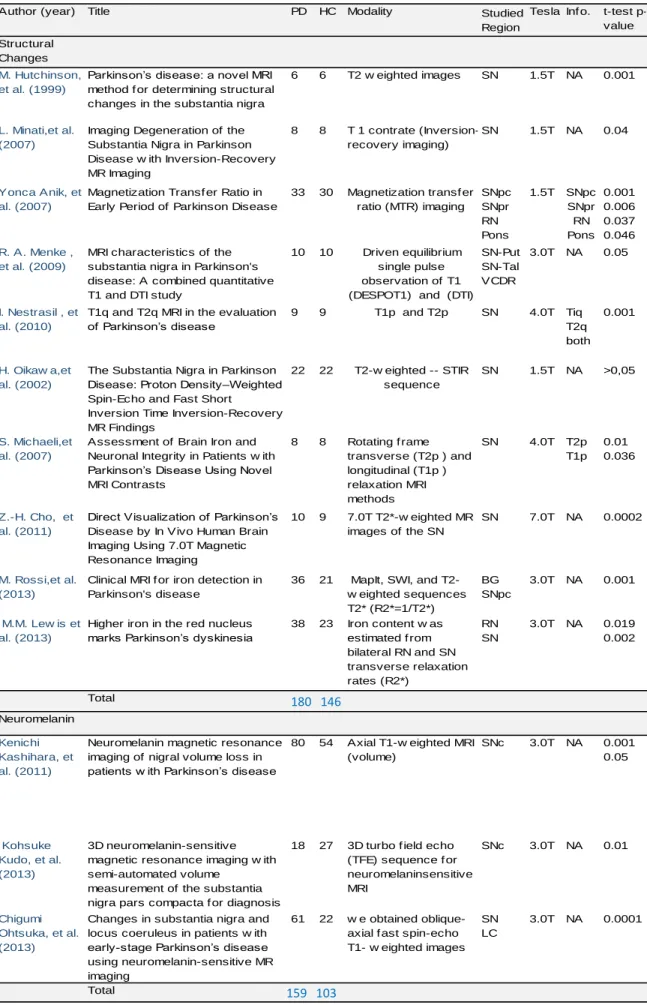
The 13 studies selected for the Meta-Analysis are represented in the table 5 with the Author, the year, the title, number of patients and controls the MRI modality, the studied region, the magnetic field of the scanner, the info (information of the studied region, p-value) and the p-value (sigma) of the t- Student test (t-test) , table 5.
Author (year) Title PD HC Studied
Region
Tesla Info. t-test
p-value Structural
Changes
C. Haegelen, et al. (2013)
Automated segmentation of basal ganglia and deep brain structures in Parkinsons's disease
57 10 BG 3.0T NA 0.05
Jan Linder,et al. (2009)
Degenerative changes w ere common in brain magnetic resonance imaging in patients w ith new ly diagnosed Parkinson’s disease 66 30 All brain 1.5T NA NA M. Hutchinson, et al. (2006)
Inversion Recovery MRI in Idiopathic Parkinson Disease Is a Very Sensitive Tool to Assess Neurodegeneration in the Substantia Nigra 12 12 SN 1.5T NA N. D. Forkert,et al. (2011) Image-based Classification of Parkinsonian Syndromes Using T2'-Atlases
33 24 1.5T NA NA
O. Monchi , et al. (2011)
Patterns of cortical thickness and surface area in early Parkinson's disease 49 33 Cortex 3.0T NA 0.005 Total 397 255 Neuromelanin Penny A. Gow land, et al. (2013)
Visualization of nigrosome 1 and its loss in PD Pathoanatomical correlation and in vivo 7 T MRI
10 8 SNpc 7.0T NA NA Total 169 111 w ith high-resolution T2*-w eighted MRI scans Modality T1-w eighted and T2-w eighted MRI T1 W and T2 W covering the w hole brain.
Segmented inversion recovery (IR) ratio imaging (SIRRIM). ie, WMS/GMS.
MRI volumes / Voxel based morphometry (VBM) 1/T2' = 1/qT2*-1/qT2 a Selectively measured using T2' MR imaging 217 109 10 8
Table 5 - Studies Selected for the Meta-Analysis of Structural MRI
Author (year) Title PD HC Studied
Region
Tesla Inf o. t-test p-value Structural
Changes
M. Hutchinson, et al. (1999)
Parkinson’s disease: a novel MRI method f or determining structural changes in the substantia nigra
6 6 SN 1.5T NA 0.001
L. Minati,et al. (2007)
Imaging Degeneration of the Substantia Nigra in Parkinson Disease w ith Inversion-Recovery MR Imaging
8 8 SN 1.5T NA 0.04
Yonca Anik, et al. (2007)
Magnetization Transf er Ratio in Early Period of Parkinson Disease
33 30 SNpc SNpr RN Pons 1.5T SNpc SNpr RN Pons 0.001 0.006 0.037 0.046 R. A. Menke , et al. (2009)
MRI characteristics of the substantia nigra in Parkinson's disease: A combined quantitative T1 and DTI study
10 10 SN-Put SN-Tal VCDR 3.0T NA 0.05 I. Nestrasil , et al. (2010)
T1q and T2q MRI in the evaluation of Parkinson’s disease 9 9 SN 4.0T Tiq T2q both 0.001 H. Oikaw a,et al. (2002)
The Substantia Nigra in Parkinson Disease: Proton Density–Weighted Spin-Echo and Fast Short
Inversion Time Inversion-Recovery MR Findings
22 22 SN 1.5T NA >0,05
S. Michaeli,et al. (2007)
Assessment of Brain Iron and Neuronal Integrity in Patients w ith Parkinson’s Disease Using Novel MRI Contrasts 8 8 SN 4.0T T2p T1p 0.01 0.036 Z.-H. Cho, et al. (2011)
Direct Visualization of Parkinson’s Disease by In Vivo Human Brain Imaging Using 7.0T Magnetic Resonance Imaging
10 9 SN 7.0T NA 0.0002
M. Rossi,et al. (2013)
Clinical MRI f or iron detection in Parkinson's disease 36 21 BG SNpc 3.0T NA 0.001 M.M. Lew is et al. (2013)
Higher iron in the red nucleus marks Parkinson’s dyskinesia
38 23 RN SN 3.0T NA 0.019 0.002 Total 397 255 Neuromelanin Kenichi Kashihara, et al. (2011)
Neuromelanin magnetic resonance imaging of nigral volume loss in patients w ith Parkinson’s disease
80 54 SNc 3.0T NA 0.001 0.05 Kohsuke Kudo, et al. (2013) 3D neuromelanin-sensitive magnetic resonance imaging w ith semi-automated volume
measurement of the substantia nigra pars compacta f or diagnosis of Parkinson’s disease
18 27 SNc 3.0T NA 0.01
Chigumi Ohtsuka, et al. (2013)
Changes in substantia nigra and locus coeruleus in patients w ith early-stage Parkinson’s disease using neuromelanin-sensitive MR imaging 61 22 SN LC 3.0T NA 0.0001 Total 169 111
MapIt, SWI, and T2-w eighted sequences T2* (R2*=1/T2*) Iron content w as estimated f rom bilateral RN and SN transverse relaxation rates (R2*)
Axial T1-w eighted MRI (volume)
3D turbo f ield echo (TFE) sequence f or neuromelaninsensitive MRI
w e obtained oblique-axial f ast spin-echo T1- w eighted images 7.0T T2*-w eighted MR images of the SN Modality T2 w eighted images T 1 contrate (Inversion-recovery imaging) Magnetization transf er ratio (MTR) imaging T1p and T2p T2-w eighted -- STIR sequence Rotating f rame transverse (T2p ) and longitudinal (T1p ) relaxation MRI methods Driven equilibrium single pulse observation of T1 (DESPOT1) and (DTI)
159 103 180 146
Meta-Analysis of structural MRI.
Out of 13 studies that we do a MA (*), there was one study in which the SN volume loss was not found in PD (H.Oikawa et al., 2002) but in the remaining, a significant reduction of the volume was found. The effect size for the reduction was pooled from all (13) with a total of 339 PD and 249 HC showing a large mean effect size (-0,877, 95% confidence interval -1,049 to -0.705, p < 0.0001). Studies have a low heterogeneous although low-level heterogeneity was
detected (Q [12] =14,598 p =0,264 I2 =17,795) (Table 6) (*).
Table 6 - Meta-Analysis of p-values (Hedge’s g) of the volume's differences of SN between PD and HC in Structural MRI
(*) For the statistic calculations was used the software “Comprehensive Meta-Analysis” of Biostat,Englewood, USA version 2.2.064 of July 27, 2011 licensed to Jose Gominho
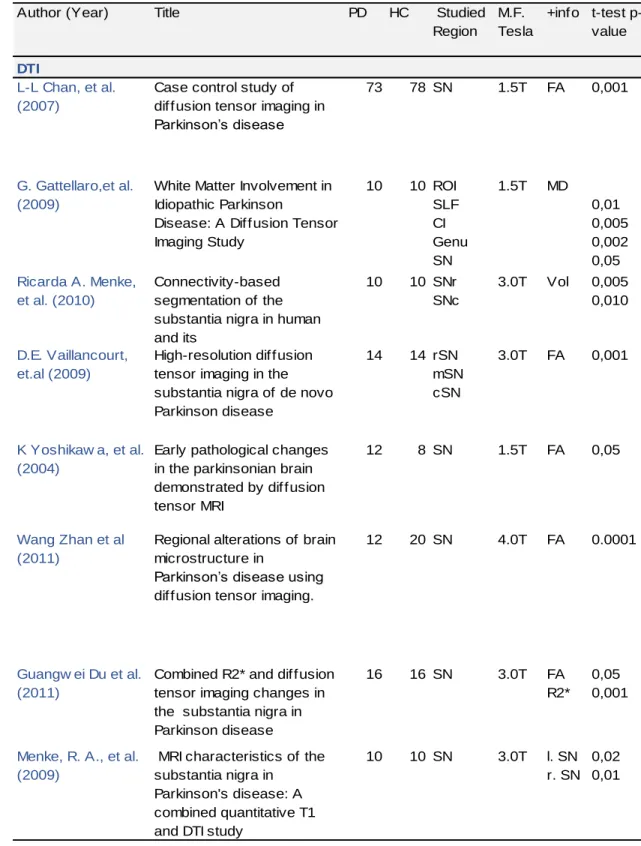
2nd - DTI (diffusion tensor imaging) with FA and MD Diffusion changes in Substantia Nigra
F. J. Maijer et al., 2013, in the paper “Update on diffusion MRI in Parkinson’s disease and atypical parkinsonism”, says that changes of FA can be detected in SN and on its projection nigro-striatum in the early stages of the disease and the
values correlates in a reverse way with the severity of Parkinson's disease 29.
D.E. Vaillancourt, et al., 2009 in a study, with 14 PD patients with a mean age of 57 years old, in Stages H&Y 1 and 2 and 14 HC, using high-resolution DTI protocol at 3 Tesla to study specific segments of degeneration in the SN (FA) found that the reduction is greater in the caudal region than in the rostral of SN and can be observed with a sensitivity and specificity of 100% on discrimination of patients with early-stage, non-treated PD and healthy controls with p-value of
0.001 in t-test 60.
A multimodal approach to diffusion MRI which can be combined with other sequences such as R2* ((R2 = 1/* T2*), proton transverse relaxation rate which shows the increase of iron in the tissues, to improve the diagnostic value in the
identification of DP. In studies of Péran et al. 38 reached 95% accuracy (area
under the ROC curve) using combinations of R2* on SN, FA on SN and MD in Striatum, on discrimination of DP and healthy controls.
Menke, R.,A. et al, 2009 and 2010, used a new approach combining the Volumetry, driven equilibrium single pulse observation of T1/T2 (DESPOT), of SN
and its connectivity (DT) with the Thalamus in a group of 10 PD patients with a mean age of 63,7 and 10 age-matched (HC), provide 100% sensitivity and 80%
of specificity 30. Based on the connectivity profiles were identified two regions an
intern corresponding to SNc (pars compacta) and an external corresponding to SNr (reticulata). However these studies found no significant differences in
diffusibility determinations between patients and healthy controls 32.
Guangwei Du et al., 2011, in another multimodal imaging study combining the transverse relaxation rate (R2*) and fractional anisotropy (FA) on SN of a 16 Parkinson´s disease patients, with a mean age of 59.2 and 16 age-matched (HC), had a high accuracy in the differentiation of patients compared with controls,
(t-test with a p-value of 0.05 for FA and 0,001 for R2*) 14.
L-L Chan, et al., 2007, using DTI in 73 PD patients with a mean age of 63.6 and 78 age-matched HC, found that FA value in the substantia nigra on DTI was lower in PD compared with healthy controls, and correlated inversely with the clinical severity of PD. Because of the overlap of FA values between PD and controls,
no single FA value had both a high positive and negative predictive power 7.
Wang Zhan et al., 2011, using DTI in 12 PD patients with a mean age of 67.4 and 20 age-matched HC, found a reduced fractional anisotropy (P < 0.05, corrected) in PD subjects in regions related to the pre-central gyrus, substantia nigra, putamen, posterior striatum, frontal lobe, and the supplementary motor areas. In SN, reduced FA (p< 0.0001) in relation to HC, correlated with increased total
Diffusion changes in circuit of the striatum, cortex and white matter.
C. Tessa et al., 2008, in a study with 27 PD patients mean age of 60.9 y and 16 age-matched HC in stages 1 and 2 of H&Y, detected an increase of FA values in novo PD, more pronounced in patients with the akinetic-rigid type, probably reflecting diffuse subtle GM loss. Those changes in values FA in the brain of PD patients are observed in the initial phase of the disease, even before there was
significant atrophy 52.
K Yoshikawa, et al., 2004 demonstrated a Reduction of FA values are observed in the motor cortex, motor, pre-motor and supplementary motor in PD, when compared to the control population. He studies 12 PD patients with mean age of
71.3 y and 8 HC 64.
Zhan et al. showed a good correlation between the increase in FA in post central
gyros, somatosensory cortex and the increasing deterioration of the disease 65.
The increase of the values of the FA in the early stages of PD were also described
by Tessa, C. et al. being interpreted as likely diffuse loss of grey matter 52.
Gattellaro et al., 2009, in a case control study with 10 PD patients, mean age 63.8 and 10 HC, found increased MD and decrease the values of FA in the genu of the Corpus Callosum in the superior longitudinal fasciculus and cingulum, already in the early stages of PD. Changes of diffusion in the genu of Corpus Callosum may indicate the degeneration of the axonal links inter hemispherical between front zones.
D.E. Vaillancourt, et al., 2013, More recently shown in a study with 20 PD patients and 20 HC (mean age 57.9), that the nucleus involved in the motor and cognitive
processes are affectively disrupted, whereas those who are involved in sensory processes are relatively spared. In addition, this study also showed that the
current methodology has utility to explore the microstructural integrity in PD 59.
In a recent case control study (to be published) with 15 PD patients and 15 HC, Koji Kamagata, et al., 2013, using a new interpretation of the diffusion images, the "Diffusional kurtosis imaging", the author refers that, it allows a greater sensitivity to detect changes of the cingulate, earlier than the traditional method of DTI, and has an area under the ROC curve of 0.91, with a 0.94 specificity and
sensitivity of 0.87 22.
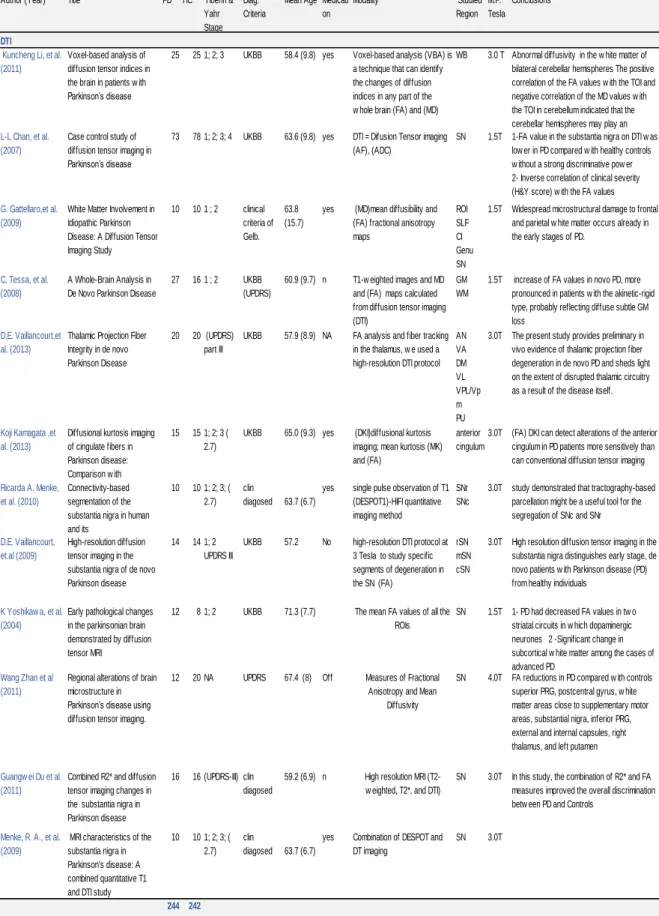
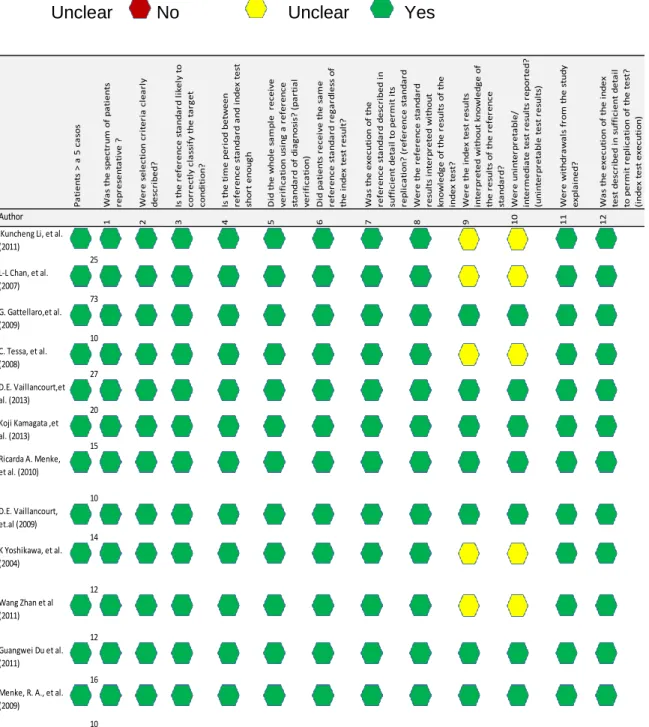
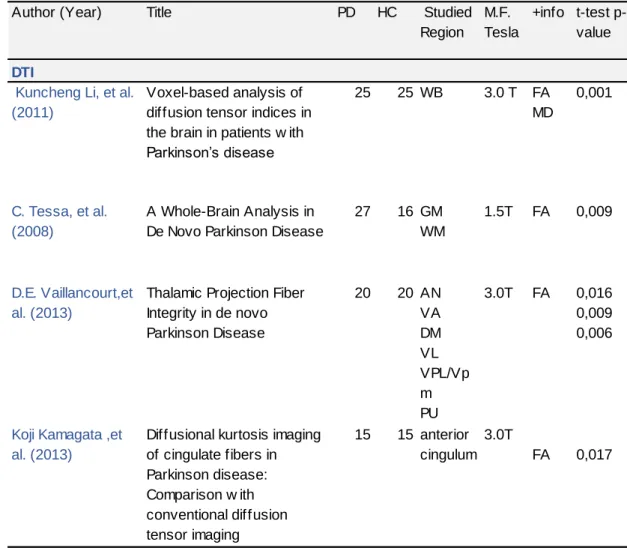
The 12 studies selected for the DTI Meta-Analysis are represented in the table 7 with the Author, the year, the title, number of patients and controls, the Hoehn & Yahr stage, the diagnostic criteria, the medication, the MRI modality, the studied region, the magnetic field of the scanner and the conclusion. In the table 8 are the quality assessment of the studies.