F
ACULDADE DEE
NGENHARIA DAU
NIVERSIDADE DOP
ORTODevelopment of an Autonomous
Underwater Profiler
João Manuel Matos Monteiro
F
ORJ
URYE
VALUATIONMestrado Integrado em Engenharia Electrotécnica e de Computadores Supervisor: Nuno Alexandre Cruz
Resumo
A monitorização dos oceanos é crítica para perceber o nosso planeta sendo necessário recolher dados sobre as propriedades da água para melhor compreender os fenómenos dos oceanos. Uma das formas de recolher estes dados é através de perfis verticais da coluna da água que permitem perceber a variação das propriedades da água com a profundidade. Tendo em conta a dificuldade de obter medidas por operadores humanos dentro de água, vários dispositivos autónomos têm vindo a ser desenvolvidos com o intuito de realizar estas operações de forma sistemática, fiável e com a mínima intervenção humana.
Um profiler é um veículo que se move predominantemente ao longo do eixo vertical. Este tipo de veículo autónomo move-se principalmente na coluna vertical de água e deriva no plano horizontal onde é sujeito a correntes. Este é particularmente indicado para aplicações onde se pretende deslocamento predominantemente na vertical, uma vez que este tipo de sistema é mais eficiente devido ao seu desenho que minimiza o arrasto na direção vertical. Sendo um veículo autónomo, permite reduzir a logística associada a uma missão, sendo por isso mais versátil.
Para fazer descer o profiler existem dois sistemas de propulsão que são tipicamente usados: ajustar a flutuação do veículo para o deslocar para cima e para baixo ou usando propulsores para mover o sistema.
Os profilers que se movem através de flutuação fazem-no alterando a sua flutuação que faz com que estes afundem ou subam, sendo que a principal vantagem deste tipo de propulsão é o facto de apenas necessitar de energia nas alturas de alterar a sua flutuação, o que faz com que sejam bastante eficientes para grandes descidas. No entanto, uma vez que a flutuação do veículo depende da densidade da água, este não é indicado para ambientes a baixas profundidades, uma vez que, a densidade da água varia significativamente, afetando o desempenho do veículo. Além disso, em ambientes com baixas profundidades, as descidas e subidas são de menor duração aumentando a frequência dos ajustes de flutuação e, consequentemente, o consumo.
No caso dos profilers que usam propulsores para mover o sistema, o desempenho durante a descida não é tão afetado pela densidade da água uma vez que é mais fácil controlar a velocidade de descida controlando os motores devidamente. A principal desvantagem deste sistema de propulsão é o facto de precisar sempre de energia para mover o veículo, o que diminui a sua eficiência para mergulhos a grandes profundidades.
Neste trabalho apresenta-se o desenvolvimento de um novo profiler autónomo para realizar perfis em zonas costeiras. O objetivo principal é que este permita adquirir perfis até 200 m de pro-fundidade. Além disso, este veículo deve ser fácil de transportar para facilitar a logística durante uma missão e permitir adicionar sensores.
Abstract
Ocean’s monitoring is critical for understanding our planet and data on water properties needs to be gathered to better understand oceans phenomena. One of the ways of collecting these data is through vertical profiles of the water column that allow to understand variation of water properties with depth. Taking into account the difficulties of obtaining measurements by human operators in the water, various autonomous profiling vehicles were developed that allow to perform these tasks in a systematic and more reliable way and with minimal human intervention.
An underwater profiler is a vehicle that moves predominantly along the vertical axis. This type of autonomous vehicle moves mainly in the vertical column of water and drifts along the hor-izontal plan subjected to currents. It is particularly suitable for applications where the movement needed by the vehicle is predominantly vertical, where these systems are more efficient because of their design that minimizes drag on the vertical direction. Being an autonomous vehicle greatly improves the versatility of the system and reduces logistics during the mission.
To drive a profiler downwards in the vertical direction there are two propulsion systems com-monly used: adjusting the buoyancy of the vehicle to make the profiler move up or down or using thrusters to drive the profiler.
Buoyancy driven profilers move by changing their buoyancy that causes the vehicle to either sink or rise. The main advantage of this type of propulsion is that it only uses energy to change its buoyancy making them extremely energy efficient on great descents. However, since the buoyancy of the vehicle depends on water density, this type of propulsion is not suitable for shallow water environments where water density varies greatly and affects the performance of vehicle. Moreover, in shallow waters, the frequency of buoyancy adjustments is greater due to the small descents causing more power consumption in these conditions.
Thruster driven profilers use thrusters to move the vehicle. The downwards performance of the thruster is not affected by the water density as much as the buoyancy, since it’s easier to control descent rate with the appropriate thruster control. The main disadvantage of using a thruster is that it is an active propulsion that constantly needs energy to drive the profiler making it inefficient for dives in greater depths.
In this work it is presented the development of a new autonomous profiling vehicle for coastal areas. The main objective of the vehicle is to acquire profiles up to 200 m of depth. This vehicle must be portable to ensure low logistics during deployment and allow to easily add payloads.
Agradecimentos
Antes de mais, quero agradecer à minha família, e de uma forma especial aos meus pais e ao meu irmão, por me acompanharem ao longo da minha vida.
Além disso, agradeço ao meu orientador, o professor Nuno Cruz, que me acompanhou ao longo desta dissertação e me orientou ao longo de todo o processo, bem como a todo o pessoal do CRAS que esteve sempre disponível para me ajudar ao longo deste caminho.
Não posso deixar de agradecer também de uma forma especial ao André Pinto e ao Vitor H. Pinto pois, além de contribuirem com muitos momentos de descontração, tiveram também mão neste trabalho durante as longas discussões sobre os problemas que foram aparecendo.
Agradeço também a todos os amigos que fiz durante estes 5 anos de faculdade por estarem sempre disponíveis para ajudar e por todos os momentos que passámos em conjunto.
Por último mas não de forma menos especial, agradeço aos meus amigos de sempre pela amizade e disponibilidade para os bons e menos bons momentos desta vida.
Um muito obrigado a todos. Esta dissertação também é vossa.
João Monteiro
“How many roads must a man walk down Before you call him a man? ”
Bob Dylan
Contents
1 Introduction 1 1.1 Context . . . 1 1.2 Motivation . . . 2 1.3 Goals . . . 2 1.4 Document Organization . . . 22 State of the Art 5 2.1 Propulsion . . . 6 2.2 Software Architecture . . . 6 2.2.1 Mission Control . . . 7 2.2.2 Data Logging . . . 7 2.3 Motion Control . . . 7 2.4 Operational Examples . . . 8 3 System Overview 11 3.1 Usage Scenarios . . . 11
3.2 Requirements and Assumptions . . . 11
3.2.1 Prototype Requirements . . . 12 3.2.2 Operational Requirements . . . 12 3.2.3 Safety Requirements . . . 13 3.3 System Design . . . 13 3.3.1 Physical Diagram . . . 14 3.3.2 Functional Diagram . . . 15 3.4 Software Architecture . . . 17 3.4.1 Software Modules . . . 17 3.4.2 Device Drivers . . . 18
3.4.3 Inter Process Communication . . . 18
4 Implementation 19 4.1 Bill of materials . . . 19
4.1.1 Processing Unit . . . 19
4.1.2 Propulsion System . . . 21
4.1.3 Scientific Data Sensors . . . 21
4.1.4 Navigation Sensors . . . 22 4.1.5 Communication System . . . 22 4.1.6 Power System . . . 22 4.1.7 Internal Sensors . . . 23 4.1.8 Interfaces . . . 23 ix
x CONTENTS 4.2 Hardware Implementation . . . 23 4.3 Software Implementation . . . 26 4.3.1 Device Drivers . . . 27 4.3.2 Mission Plan . . . 38 4.3.3 Software Architecture . . . 40 4.3.4 Logging Process . . . 41 4.3.5 Log . . . 42 4.3.6 Mission Log . . . 43
5 Vehicle Model and Simulation 45 5.1 Coordinate Frames . . . 45
5.2 6 DOF Model of the Vehicle . . . 46
5.2.1 6 DOF Rigid Body Equations of Motion . . . 47
5.2.2 Hydrodynamic Forces and Moments . . . 48
5.3 Thrusters Mapping . . . 51
5.4 Vehicle Parameters and Coefficient Derivation . . . 51
5.4.1 Vehicle Reference Frames . . . 51
5.4.2 Vehicle Weight and Buoyancy . . . 52
5.4.3 Center of Buoyancy and Center of Gravity . . . 53
5.4.4 Determination of the Center of Buoyancy . . . 55
5.4.5 Moments of Inertia . . . 56 5.4.6 Hydrodynamic Damping . . . 57 5.4.7 Added Mass . . . 59 5.4.8 Thrusters Parameters . . . 60 5.5 Simulation . . . 61 5.6 Model Validation . . . 62 6 Controllers 65 6.1 Speed Controller . . . 65 6.1.1 Lyapunov Theory . . . 65 6.1.2 Nonlinear Control . . . 66 6.2 Position Controller . . . 67 6.2.1 Position Reference . . . 68 6.3 Controller Gains . . . 69 6.4 Controllers Simulation . . . 69 6.4.1 Goto Z . . . 69 6.4.2 Surface . . . 72 6.4.3 Hover . . . 73 7 Experimental Results 77 7.1 Validation Tests . . . 78 7.1.1 Sealing . . . 78 7.1.2 Stationary . . . 78 7.1.3 Dive . . . 83 7.1.4 Angular Test . . . 84 7.2 Controller Tests . . . 85 7.2.1 Go To z Test . . . 85 7.2.2 Surface . . . 88 7.2.3 Hover . . . 89
CONTENTS xi
7.3 Multiple Maneuvers . . . 92
7.3.1 Hover at Different Depths and Surface . . . 92
8 Conclusions and Future Work 95
8.1 Main Contributions . . . 95
8.2 Future Work . . . 96
List of Figures
3.1 Subsystems that constitute the profiler . . . 13
3.2 Physical diagram . . . 15
3.3 Functional diagram . . . 16
3.4 Software modules . . . 18
4.1 Prototype of the Autonomous Underwater Profiler . . . 19
4.2 Beaglebone Black Wireless . . . 20
4.3 T100 thrusters . . . 21
4.4 Final configuration of the profiler . . . 24
4.5 Frame and electronics mounted inside the profiler . . . 24
4.6 Schematic of the interface board . . . 25
4.7 Interface board . . . 25
4.8 Top endcap . . . 26
4.9 IMU class . . . 27
4.10 Flowchart of the initialization of the IMU . . . 28
4.11 Flowchart for reading yaw, pitch and roll from the IMU . . . 29
4.12 Temperature class . . . 29
4.13 Flowchart representing the initialization of the temperature sensor . . . 30
4.14 Flowchart for reading temperature values from the temperature sensor . . . 30
4.15 Pressure class . . . 31
4.16 Flowchart describing the initialization of the pressure sensor . . . 31
4.17 Flowchart for reading values from the pressure sensor . . . 32
4.18 Battery Manager class . . . 33
4.19 Flowchart describing battery manager initialization . . . 33
4.20 Flowchart for reading info from battery manager . . . 34
4.21 GPS class . . . 34
4.22 Flowchart for reading position from GPS . . . 35
4.23 PWM Class . . . 36
4.24 Flowchart for initializing PWM . . . 36
4.25 ADC class . . . 37
4.26 Mission and Actions classes . . . 39
4.27 Example of a possible mission configuration . . . 40
4.28 Data Time class . . . 41
4.29 Example of a data log . . . 43
4.30 Example of a mission log . . . 43
5.1 Autonomous Underwater Profiler reference frames . . . 52
xiv LIST OF FIGURES
5.2 Simulation of the release of the profiler from a starting point of 90o degrees in
pitch with 3 cm distance between CB and CG . . . 53
5.3 Simulation of the release of the profiler from a starting point of 90o degrees in pitch with 5 cm distance between CB and CG . . . 54
5.4 Simulation of the position of the profiler using two thrusters at 0.75 N each with 5 cm between CB and CG . . . 54
5.5 Simulation of the position of the profiler using two thrusters at 0.75 N each with 3 cm between CB and CG . . . 55
5.6 Results of the experimental tests and simulation . . . 56
5.7 Approximated profile of the vehicle used for damping coefficients calculation . . 58
5.8 Performance chart of T100 thruster . . . 60
5.9 PWM positive side . . . 61
5.10 PWM negative side . . . 61
5.11 Simulation of the position in z starting from 2.5 meters . . . 62
5.12 Simulation of the position in z when acting on the 4 thrusters with a force greater than the positive buoyancy . . . 63
5.13 Simulation of the position in z, pitch and roll when acting on the 2 thrusters with a force greater than the positive buoyancy . . . 63
6.1 Block diagram of the controllers . . . 67
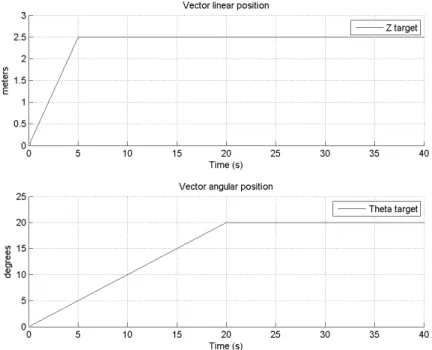
6.2 Position reference with velocity in z of 0.5 m/s and in pitch of 0.05 rad/s . . . 69
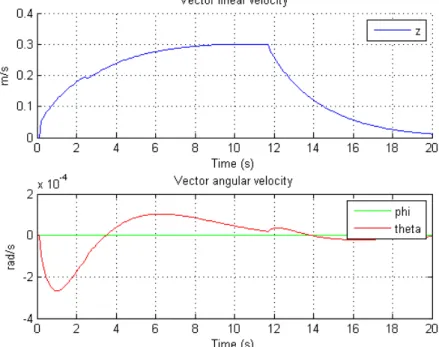
6.3 Speed during gotoz maneuver with 0 in pitch and roll . . . 70
6.4 Position during gotoz maneuver with 0 in pitch and roll . . . 70
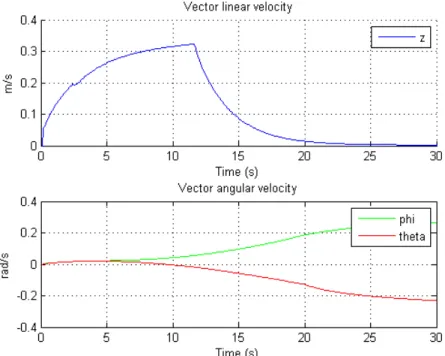
6.5 Speed during gotoz maneuver with 0 in pitch and roll . . . 71
6.6 Position during gotoz maneuver with 0 in pitch and roll . . . 71
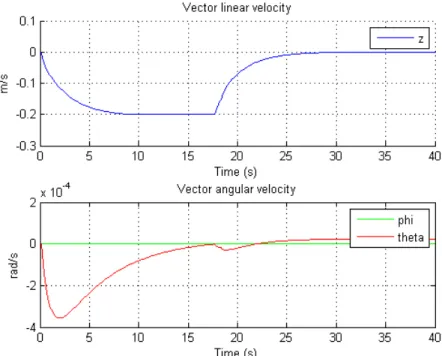
6.7 Speed during surface maneuver . . . 72
6.8 Depth during surface maneuver . . . 73
6.9 Speed during hover maneuver . . . 74
6.10 Depth during hover maneuver . . . 74
7.1 Profiler at surface in the test tank at ISEP . . . 77
7.2 External temperature with the profiler stopped . . . 79
7.3 Pressure with the profiler stopped at surface . . . 79
7.4 Depth with the profiler stopped at surface . . . 80
7.5 Yaw with the profiler stopped . . . 80
7.6 Pitch with the profiler stopped . . . 81
7.7 Roll with the profiler stopped . . . 81
7.8 Internal temperature of the profiler . . . 82
7.9 Internal temperature of the profiler . . . 82
7.10 Remaining percentage and time to empty of the batteries of the profiler . . . 83
7.11 Depth variation when pushing the profiler . . . 84
7.12 Pitch variation when inclining the vehicle in Pitch . . . 84
7.13 Roll variation when inclining the vehicle in Pitch . . . 85
7.14 Depth, pitch and roll of the profiler when diving up to 0.4 m . . . 86
7.15 Depth, pitch and roll of the profiler when diving up to 0.4 m . . . 87
7.16 Depth, pitch and roll during gotoz to 3.5 meters . . . 88
7.17 Depth during gotoz and surface . . . 89
7.18 Results of the experimental tests for hover control . . . 90
LIST OF FIGURES xv
7.20 Depth during hover . . . 92
List of Tables
2.1 Comparative table of different profilers . . . 9
4.1 Comparative table of Single Board Computers . . . 20
4.2 Shared memory . . . 38
4.3 Data log . . . 42
5.1 Notation used for marine vehicles . . . 46
5.2 Linear drag adjustment factors . . . 56
5.3 Vehicle’s center of buoyancy and center of gravity . . . 56
5.4 Vehicle’s moments of Inertia . . . 57
5.5 Integration limits . . . 58
5.6 Drag coefficients . . . 59
5.7 Added mass coefficients . . . 60
6.1 Gotoz controller gains . . . 72
6.2 Surface controller gains . . . 73
6.3 Hover controller gains . . . 75
Abbreviations
ADC Analog-to-Digital Converter
ALACE Autonomous Lagrangian Circulation Explorer APEX Autonomous Profiling Explorer
ASIP Air Sea Interaction Profiler
ATX Advanced Technology Extended
AUV Autonomous Underwater Vehicle
AVP Autonomous Vertical Profiler
BBB Beaglebone Black
CB Center of Buoyancy
CG Center of Gravity
CPU Central Processing Unit
CRC Cyclic Redundancy Check
CTD Conductivity Temperature Depth
DOF Degrees of Freedom
ESC Electronic Speed Controller
FIFO First In First Out
GPIO General Purpose Input/Output
GPS Global Positioning System
HUP Hybrid Underwater Profiler
I2C Inter Integrated Circuit
IBPS Intelligent Battery and Power System
IMU Inertial Measurement Unit
IPC Inter Process Communications
LQR Linear Quadratic Regulator
PID Proportional Integral Derivative PMIC Power Management Integrated Circuit
PWM Pulse Width Modulation
RAM Random Access Memory
RMC Recommended Minimum Data for GPS
RPi Raspberry Pi
SBC Single Board Computer
SPI Serial Peripheral Interface TTL Transistor-Transistor Logic
UART Universal Asynchronous Receiver/Transmitter
USB Universal Serial Bus
Chapter 1
Introduction
In a ever changing world where most of the surface is covered by water, there is a need to under-stand, monitor and explore the oceans and rivers to have a better knowledge of our planet.
The oceans and rivers house innumerable ecosystems that balance the world. In order to protect the richness of those ecosystems we need a deeper understanding of the conditions that house them [1,2]. In the depths of the world’s oceans there are also unexplored regions that have a great profit potential like deep sea mining, oil and gas [2]. There’s also the need to survey the currents and the interaction between atmosphere and the sea to better understand meteorological phenomena [3,4]. Data collected in oceans is also used to track climate change and estimate future changes using forecast models. In order to have a better knowledge on this issue, we need accurate measurements that allow to understand the changes that are happening in the weather [5]. Finally, there’s also the need to inspect underwater structures like cables and pipelines or foundations of constructions like bridges, to diagnose faults and prevent malfunctions in these critical systems [6].
All these possibilities present challenges related to underwater exploration since, in most cases, it is undesirable to have humans in such conditions. Therefore, there’s the need to develop systems that allow us to overcome those challenges.
1.1
Context
In order to tackle the above mentioned challenges, a variety of solutions have been developed. Taking into account the difficulties of obtaining underwater measurements in a systematic way, autonomous vehicles that allow to perform these tasks in a systematic and reliable way and with minimal human intervention were developed. These vehicles can acquire data in both horizontal and vertical plans and in zones that have different constraints.
To gather a better knowledge of the water properties, there is the need to have measurements along the vertical profile of the water column to understand its properties variation with growing depth. These measurements allow to know how the different conditions vary in a certain region as depth grows. Similarly, in order to descend to deepest zones of the ocean, there’s the need of
2 Introduction
systems that allow predominantly vertical movement along the water column. In order to achieve these goals, different solutions were explored.
The Rosette conductivity–temperature–depth (CTD) device is a system that allows to obtain a profile using a winch in a boat but these method is labour intensive and slow [7].
To acquire profiles with minimal human operation autonomous profilers have appeared, like the Autonomous Profiling Explorer (APEX) or the Autonomous Lagrangian Circulation Explorer (ALACE). This type of profilers move in the water column by changing their buoyancy, but have low speeds of descent, that make them unsuitable for coastal areas profiles because these areas change more dynamically than open sea zones [7]. Additionally, this kind of profiles are not indicated for coastal profiles due to the higher variation of water densities in shallow water zones that causes problems on the propulsion system [8]. Moreover, since in shallow waters the descents are smaller, the frequency of the buoyancy adjustments increases making this propulsion system less efficient in these conditions.
1.2
Motivation
The superficial layers of the oceans are key areas to understand the world that surrounds us. To gather that knowledge, we need to study and monitor the coastal areas in order to understand the ecosystems [8,7] as well as the interactions between the atmosphere and the ocean [4].
To acquire data on the superficial layers of the oceans, a new approach was used that allows to minimize the problems presented by buoyancy driven profilers. By using a thruster [4,7] on the profiler, the problem introduced by the variability of water densities is minimized.
Following this approach, it will be presented a thruster driven profiler that minimizes the dis-advantages of the buoyancy driven profilers in these areas and develops the work already done to propose a different solution from those already explored. Additionally, the proposed vehicle also allows limited horizontal motion by controlling the heading of the vehicle.
1.3
Goals
The main goal of this work is to develop an autonomous underwater profiler, ie, an autonomous vehicle that moves predominantly in the vertical column of water.
The secondary goal of this work is to build a system that can be expansible and implement additional control algorithms that allow more maneuvers.
1.4
Document Organization
This document describes the work done during the development of the profiler from the conception of the system until testing and conclusions on the work done.
1.4 Document Organization 3
Therefore, chapter 2 and chapter 3 can be understood as the conception phase, chapter 2
presents the state of art while chapter 3defines the requirements and proposes a possible solu-tion.
Chapters 4, 5and6 correspond to the implementation of the system. Chapter4 focuses on the implementation of the prototype, chapter5 presents the model used to simulate the vehicle behavior and chapter6presents the controllers designed to maneuver the vehicle.
In chapter7the profiler is tested and the achieved results are presented.
Finally, chapter8concludes this work: the results are discussed and some suggestions of future work are presented to further improve the system developed.
Chapter 2
State of the Art
An underwater profiler is a vehicle that moves predominantly along the vertical axis. This type of autonomous vehicle moves mostly in the vertical column of water and drifts along the horizontal plan, subjected to currents. They are particularly suitable to applications where the movement needed by the vehicle is predominantly vertical, where these systems are more efficient due to their design that minimizes drag on the vertical direction.
Vertical profiles are important for identification of water properties variation with depth for instance the temperature-depth typically used in oceanographic studies. Typically, this kind of systems are used to profile the water column to gather information about water properties at great [9] or low depths [4] and to maintain a fixed distance to seabed [10]. An autonomous vehicle greatly improves versatility and reduce logistics during the mission compared to other alternatives, like Rosette CTD systems that depend on a support vessel. This characteristic allows to deploy the vehicle and recover it after a mission plan sent to a profiler is executed without human intervention. The main disadvantage of this type of vehicle is that it is not controlled along the horizontal plan, being subjected to drift caused by currents which makes it difficult to control its position.
A profiler is composed by a set of subsystems that allow the vehicle to move according to a planned mission. To achieve this, a profiler is typically composed by the following subsystems:
• a propulsion system, usually based on buoyancy or thrusters, as described in section2.1; • a power system (composed of batteries and voltage converters like the described in [4])
re-sponsible for providing power to all the subsystems. Typically it is used a set of rechargeable batteries like Lithium-ion batteries [4,7];
• a set of sensors that are used to control the movement of the profiler and to acquire the desired data during the mission. This set can be divided in two: navigation sensors, to know the vehicle position and payloads, to acquire data on water properties. The pressure sensor can be considered a navigation sensor since it allows to measure the depth and, at the same time, a payload since it allows to measure depth for Temperature-depth profiles;
• a communications system to send gathered data during the mission and the location of the profiler;
6 State of the Art
• a central processing unit with one (like the Netburner MOD5234 used in [8]) or more proces-sors (in a distributed architecture like the used in [7]) that controls the mission and processes data
More subsystems can be added to provide more functionality like a mooring station like the one used in [11]. In [4], a light is also mounted in the vehicle to locate the vehicle at night as well as a magnetic switch to wake up the system. In [12], an airdrop device is added to safely drop the vehicle from the air.
2.1
Propulsion
To drive a profiler downwards it is necessary to have a propulsion system. Therefore, two propul-sion systems are the most commonly used: adjusting the buoyancy of the vehicle to make the profiler move up or down [13,12,14,15] or using one or more thrusters to drive the profiler down and combining a positive buoyancy with propulsion to move up [4,7].
Buoyancy driven profilers move by changing their volume, which causes the vehicle to either sink or rise. The main advantage of this type of propulsion is that it only uses energy to change its buoyancy, making them extremely energy efficient on great descents and, therefore, more suitable to use in great depths [13,9]. However, since the buoyancy of the vehicle depends on water density, this type of propulsion is not suitable for shallow water environments where water density varies greatly and, therefore, affect the performance of vehicle. This limitation causes the vehicle to have greater settling times [8,15] that can be critical for the performance of the system in environments as dynamic as coastal waters. In these zones these vehicles also spend more energy since they need to adjust buoyancy more often than in greater descents. Moreover, changing the buoyancy of the vehicle takes longer than actuating the thrusters making it more difficult to control the profiler. Another approach used to minimize the limitations of the buoyancy driven profilers is to use a set of thrusters as propulsion, normally associated with a positive buoyancy [4,7]. The positive buoyancy is used as safety measure in case of electronics failure making the profiler always come back to the surface [16], although having the drawback of requiring more energy to drive the profiler downwards. The downwards performance of the thruster is not affected by the water density as much as the buoyancy and it allows to achieve greater speeds and shorter settling times as shown in [10]. The main disadvantage of using a thruster is that it is an active propulsion, that constantly needs energy to drive the profiler, making it inefficient for dives in greater depths or to stop in the bottom of the sea, which can be required to some applications (like the suggested in [17]).
2.2
Software Architecture
The profiler software that allows to execute a planned mission is similar to other AUV’s and typ-ically can be divided in two main subsystems: Mission Control and Data Logging. The software can be implemented in either a distributed architecture like seen in [7], where different processing
2.3 Motion Control 7
units perform different tasks or in a centralized architecture where there is only one processing unit that runs all the tasks [18].
2.2.1 Mission Control
Mission control executes the mission plan acquiring data from sensors related with the vehicle movement (like depth and attitude of the vehicle). It also controls the vehicle propulsion accord-ing to the mission plan. In [4], mission control is also responsible of controlling remote commu-nications and wake up the system. In [7], a distributed architecture is proposed based on nodes (each node is a different processing unit) where one is responsible for controlling the mission and the communications, another is responsible for data acquisition of vehicle payloads and thruster control and the other node acquires all scientific data. In [18], a main process estimates the vehicle position and executes the mission plan.
2.2.2 Data Logging
The data acquired from sensors needs to be logged to a storage device to be analyzed after the mission. The data is typically logged to an SD card [8] or a hard disk [4].
In [18] this is achieved using an independent process to increase the system modularity and robustness. The other processes send a message to the logging process that is responsible to log the data. Each measure is typically associated with a timestamp to ensure data validation and synchronization between multiple processes that run concurrently.
2.3
Motion Control
To perform the required maneuvers, a profiler must run an algorithm that controls the propulsion system.
In the buoyancy driven profiler described in [8], a task implements a PID controller using the measurements of depth and altitude above seabed. This controller computes an intermediate depth trajectory using basic filtering to keep the depth changes within the dynamic capabilities of the profiler.
To acquire a profile of the column of water, the vehicle described in [7] runs at a constant speed and, as it nears the target depth, ramps down the thruster voltage to zero bringing the profiler close to the target depth. Then, the profiler ascends using the positive buoyancy defined on construction. The vehicle described in [4] operates in a similar way. The AVP [7] can also hover at a fixed depth. It uses a controller comprising of Linear Quadratic Regulator (LQR) in combination with a complementary filter as described in [10].
In the horizontal plan, a profiler normally drifts with the current. To have some control along the horizontal plan, [17] have proposed a method to select the currents in order to move to the desired location, using the ones that move in that direction or wait in the seabed until the currents point in the desired direction. To overcome the limitation on horizontal movement [14] proposed
8 State of the Art
a buoyancy driven approach that combines characteristics of a vertical profiler and an underwa-ter glider to correct the horizontal displacement caused by the influence of currents, allowing to persistent monitor a certain region without drifting.
Another approach to solve the drift problem introduced by the currents is the moored profiler like the ones presented in [19], [20] or [21]. Since these vehicles are moored, they don’t drift with the current allowing to generate water column profiles in the desired location, even in adverse weather conditions ([21]). However, since these are moored in the seabed they are not as versatile as other profilers.
2.4
Operational Examples
As seen along this chapter, many different approaches have been used in the construction of au-tonomous profilers. In table 2.1, characteristics of some operating vehicles are presented and compared.
From the table2.1 it is easy to confirm that profilers driven by motors are more suitable for lower depths applications, while buoyancy driven profilers are more suitable for greater depths. It is also possible to conclude that the weight of profilers varies considerably between devices. In this case the added weight is related with more payloads and the fact that, in the heaviest system, are used two sets of sensors for the same measures [4]. This system also has the largest battery, which adds more weight.
2.4 Operational Examples 9
Table 2.1: Comparative table of different profilers AVP [7,11] HUP [14] Airdropped profiler [12] ASIP [4] APEX Argo [22] APEX Deep Float [9] Length 1.17m 2.1m 0.70m 2m 1.27m 0.432m Diameter 0.184m 0.23m N.P 0.19m 0.165m 0.432m Weight on Air ∼13Kg N.P 7Kg 80Kg 25 Kg N.P Max. Depth 200m N.P 1000m 100m 2000m 6000m
Propulsion DC Motor Buoyancy Buoyancy DC Motor Buoyancy Buoyancy
Speed (m/s) Nominal =0.4; Max =1 N.P N.P Ascend ∼0.25 N.P N.P Endurance 7 days@4 dives per day (100 m) 30 days@3 dives per day 50 profiles N.P 4 years, 150 pro-files 300 pro-files Power Li-Ion 324 Wh N.P N.P Li-ion 1000Wh N.P N.P Pressure D N.P D D N.P N.P CTD D N.P N.P D D D Temperature D D D D D D Depth D D D D D D GPS D N.P D D N.P N.P Turbidity D D N.P D D D Fluorometer D N.P N.P D D D Echo-sounder D N.P N.P N.P N.P N.P Dissolved Oxy-gen D N.P N.P N.P D D Attitude N.P D D D N.P N.P Acoustics N.P D N.P N.P D N.P Shear N.P N.P N.P D N.P N.P PAR N.P N.P N.P D N.P N.P Radiometers N.P N.P N.P N.P D N.P Nutrients N.P N.P N.P N.P D N.P Transmissometers N.P N.P N.P N.P D N.P Satellite Com-munications Optional D D D D D RF communica-tions D N.P N.P N.P N.P N.P
Chapter 3
System Overview
In this chapter it will be presented an overview of the system that was developed, as well as the usage scenarios that lead to a set of requirements and assumptions needed to develop the system. It will also be presented a functional diagram that allowed to implement the presented requirements and the software architecture.
The presented system was designed to operate mainly in coastal areas. It aims to be a portable and easy to deploy autonomous vehicle, with enough energy for a 24 hour mission. It will also provide more versatility than similar vehicles by allowing to perform some movement along the horizontal plane, hover on a defined distance to the sea bottom and profile on a specific location (compensating the displacement caused by the currents).
3.1
Usage Scenarios
In order to understand the addressed challenges, a set of usage scenarios was identified to illustrate the use of the vehicle in real world application. Some of those usage scenarios are:
• Profile the coastal area to acquire data for oceanographic studies; • Profile along a pollution spot to measure the thickness of the plume;
• Acquire profiles on zones with maritime traffic (for instance in a port) to acquire data for oceanographic studies without disturbing maritime traffic;
• Acquire images of the sea bottom with a fixed distance (benthic fauna and flora);
3.2
Requirements and Assumptions
From the analysis of the usage scenarios were identified a set of requirements and assumptions that can be divided in three subsections:
• prototype requirements, related with the characteristics that the prototype must have; 11
12 System Overview
• operational requirements, related to the maneuvers that the profiler must perform; • safety requirements, that should guarantee the fault handling of the vehicle.
These assumptions allow to define requirements like battery life and weight of the vehicle.
3.2.1 Prototype Requirements
The list of prototype requirements takes into account the following guidelines: the profiler must be an autonomous system with a modular design and that allows low logistics operation during deployment and recovery. This system should be designed to operate on coastal areas without wired connections. The defined guidelines imposed the following requirements:
• Battery life should be sufficient to perform 10 profiles to 200m depth with a velocity of 1m/s along 24 hours;
• At the end of the mission, the vehicle should communicate its position on water to be recov-ered;
• The profiler should have a configuration that allows to be easily recovered from the water; • The mission plan must be communicated using a wireless connection;
• The prototype must allow to add new sensors if needed; • The vehicle must be designed to profile the coastal area;
• The system should have a weight on air and length not greater than 30 Kg and 1.5 m respec-tively;
3.2.2 Operational Requirements
The system should allow a defined set of maneuvers that take into account the usage scenarios considered. The list of requirements related with operation requirements is as follows:
• The controllers should allow to profile in the same position (in case of drift caused by currents, the profiler should recover to its original position);
• The profiler should allow to acquire different profiles along a horizontal direction ; • The vehicle should allow hovering at a fixed distance above the bottom of the sea; • The vehicle should allow to profile within 2 different depths without needing to surface; • The profiler must need only one operator to successfully launch and recover the vehicle; • The vehicle should work on calm conditions;
3.3 System Design 13
3.2.3 Safety Requirements
The profiler must detect situations that can cause damage to the system. The main situations identified are: water entrance on the pressure housing, overheating caused by malfunction of the system, collision with the bottom of the sea and battery levels insufficient to conclude the mission plan. The profiler should then be able to detect the following faults and act accordingly:
• Detect water entrance;
• Detect overheating inside the pressure case; • Sea bed detection to avoid collision; • Monitor battery status;
3.3
System Design
To better understand the overall design of the profiler, figure3.1 illustrates the main subsystems and interconnections.
Figure 3.1: Subsystems that constitute the profiler
These include:
• Power System - Powers all the subsystems. Includes the batteries, voltage converters and power buses needed to power the other systems;
• Processing Unit - Runs the onboard software described in section3.4; • Propulsion System - Responsible for propelling the profiler;
14 System Overview
• Navigation System - Includes the sensors that allow the profiler to know it’s position, head-ing and attitude;
• Scientific Data System - Set of sensors used to acquire scientific data (for instance depth and temperature);
• Communication System - Responsible for communicating with the outside world. Allows the profiler to receive the mission plan and communicate its position in the end of the mis-sion;
• Internal Sensors - Set of sensors to monitor possible faults inside the pressure housing;
3.3.1 Physical Diagram
In this system, the position of the subsystems is crucial to their correct performance since some subsystems only work above the water level while others need to be in contact with the water and others can’t be in contact with water.
Additionally, the passive attitude of an underwater vehicle is determined by the relative posi-tion of his centre of mass and centre of buoyancy. In order to achieve the desired attitude, (vehicle pointing downwards) the gravity centre of the vehicle has to be below the buoyancy centre. For this to be possible, the weight must be concentrated in the underside of the vehicle.
Taking into account these constraints, a physical diagram was designed to illustrate the position of each subsystem in the vehicle:
3.3 System Design 15
Figure 3.2: Physical diagram
Both the top and bottom are free flooding and only the pressure housing needs to be water-proof. In figure3.2, thrusters are mounted on the top of the profiler to drive the profiler down. As seen in chapter2, the vehicle should have a positive buoyancy for safety purposes. The set of antennas also need to be in the upper side of the profiler to ensure that when the profiler comes to the surface, the antennas are outside of the water to guarantee proper functioning. The navigation and communication systems are mounted near the antennas and need to be waterproof, since elec-tronics can’t be in contact with water. The power system, the processing unit and internal sensors are mounted inside the pressure housing to avoid contact with water. The power system is placed at the bottom since it represents a great weight. This placement contributes to balance the profiler. The scientific data sensors are mounted in the interface with the outside because they need to be in contact with water to accurately measure the water properties.
3.3.2 Functional Diagram
Taking into account the defined requirements in section3.2, a proposed designed is presented in figure3.3, that details the main subsystems presented in figure3.1.
In the following design, the subsystems’ position is the same as in the system to be imple-mented. This is an important aspect of the design, since the position of the components has an
16 System Overview
impact on the correct operation of the subsystem (for instance, the GPS antenna needs to be at the top of the profiler because GPS only works if the antenna is above the water surface).
Figure 3.3: Functional diagram
The functional diagram presented in3.3is composed by:
• a Processing unit, responsible for processing data, control the thrusters and mission man-agement;
• four thrusters to drive the profiler and allow to control the heading;
• a GPS module to obtain the position of the vehicle when its antenna is above the water level; • a Wi-fi module to receive the mission plan before deployment and retrieve data from the
profiler;
• a satellite communication module to transmit vehicle position in the end of the mission; • a pressure sensor to obtain pressure and calculate depth;
• an echo-sounder to measure distance to the bottom; • an internal temperature sensor to detect overheating;
3.4 Software Architecture 17
• an IMU to estimate vehicle attitude and heading;
• an external temperature sensor to measure water temperature; • batteries to power the system;
• a charger controller to charge batteries (only used off mission); • power converters and power buses to power the different devices;
• an I2C bus where the devices that use I2C are connected, to communicate with the process-ing unit;
During the lifetime of the vehicle, more sensors or modules can be added as needed. Additional sensors are restricted by space on the device, by the number of interfaces that the processing unit offers and the compatibility with the processing unit.
3.4
Software Architecture
The software architecture should be implemented in a way that allows an easy accommodation to new sensors, since the modularity of the system is also a considered requirement. This software must run in real-time and have multiprocesses to ensure that different tasks are performed in useful time.
3.4.1 Software Modules
To satisfy the set of requirements defined in section3.2, a set of software modules is needed to interconnect all the subsystems mentioned in section3.3and to perform tasks such as reading data from the sensors, control the thrusters, communicate position, save data to a storage device, etc.
Having these guidelines in mind, the software to be developed consists of three separate pro-cesses as shown in figure3.4: Mission Control and Supervision, Data Logger and Sensors.
The process Sensors should acquire data from all the sensors available and communicate these measurements to the processes that use them. The time associated with each acquired measure-ment should be registered and also communicated to other processes.
Since writing data to the memory is a slow task, the process Data Logger is responsible for logging the data read from the sensors. This process should implement a queue that guarantees that no data received is lost. The data values in the queue will then be written to disk, allowing the user to see the evolution of all data acquired in the end of the mission. All data should be timestamped with the time of acquisition. This process runs periodically and each time the configured period elapses, this module accesses the data read from the sensors and saves it to the queue to be written in a logging file.
The process Mission Control and Supervision is responsible for executing the mission plan received by the user, taking into account the data acquired by the Sensors process. This process
18 System Overview
Figure 3.4: Software modules
needs to estimate the position of the vehicle, based on sensor readings, and control the thrusters to perform the desired maneuvers. This process is also responsible for, in case of fault detection or in the end of the mission, surface and communicate the vehicle position.
Each mission is planed using a configuration file where each maneuver to be performed is described. The Mission Control and Supervision process builds a state machine based on the information present on the configuration file that executes the mission plan defined sequentially. For each maneuver is required to define a timeout as a safety measure to guarantee that, in case the maneuver is not completed, the profiler does not get lost trying to complete it.
3.4.2 Device Drivers
To communicate with each device attached to the processing unit is necessary to use a device driver.
Therefore, for each device, it will be implemented a class with methods that provide an inter-face for the software modules interact with each device. Each class has to be capable of initialize a device and allow to read data from this.
3.4.3 Inter Process Communication
Since each software module is implemented in a different process, it is necessary to use methods to communicate and share data between processes and, at the same time, guarantee that the shared data is valid.
Therefore, the data will be shared between processes using shared memory that allows to share a memory segment between the different processes running.
As this method does not guarantee synchronization between processes, semaphores will be used to guarantee synchronization between processes.
Chapter 4
Implementation
During this chapter, it will be presented the implementation of the vehicle shown in figure4.1. It will describe the bill of materials used in the implementation of the vehicle, the criteria considered in their selection, the onboard software implemented in the processing unit and the design of the controllers that allow to perform the required maneuvers.
Figure 4.1: Prototype of the Autonomous Underwater Profiler
4.1
Bill of materials
This section describes the criteria considered in the selection of the materials. The materials used take into account the requirements described in Chapter3.
4.1.1 Processing Unit
Scientific literature on autonomous underwater vehicles describes several works using Linux as operating system [18,15,23]. This operating system is free and open-source and is suitable for this kind of application since it allows multitasking, inter process communication and allows to interact with other devices using device files.
For the selection of the processing unit the main selection criteria were: power consumption, that should be as low as possible to allow more mission time, interfaces available to communicate
20 Implementation
with the other components, weight, since the system weight is a requirement and size, because space available is limited.
Single board computers are typically small size and lightweight. Having this in mind, two single board computers were considered: the Raspberry Pi (RPi) [24] and the Beaglebone Black (BBB) [25], since both are capable of running a Linux distribution, consume low power and pro-vide various interfaces. The choice between these two embedded systems was made based on the set of requirements defined in Chapter3and on the Table4.1that compares both their main features.
Table 4.1: Comparative table of Single Board Computers [24],[25] Characteristics Raspberry Pi 3 Model B Beaglebone Black Wireless
CPU Cores 4 2
CPU Clock Frequency 1.2 Ghz 1 Ghz
RAM 1 GB 512 MB
Storage Micro SD 4 GB;Micro SD
GPIO 40 65
I2C Bus 1 2
SPI Bus 1 2
UART Ports 1 4
Analog Input — 7 (12 bits)
Power consumption ∼400 mA @ 5V 210-460mA @ 5V
USB Ports 4 1
Ethernet 10/100 BaseT —
Wifi 802.11b/g/n 802.11 b/g/n
Bluetooth Bluetooth 4.1 plus BLE Bluetooth 4.1 plus BLE
BBB provides more interfaces, which is an important factor considering that one of the defined requirements is the capability of adding more sensors. Another factor in favor of the BBB is the built-in PMIC that manages the board power sources.
RPi has more USB interfaces but it requires a memory card to support the board operating system, while the BBB has already 4GB of eMMC on-board flash storage, and still allows the usage of an additional memory card.
4.1 Bill of materials 21
Considering the facts presented above, the Beaglebone Black Wireless was chosen because it has more interfaces that are needed to communicate with the other components.
4.1.2 Propulsion System
Taking into account the requirements defined in Chapter3, four thrusters were chosen to propel the vehicle. The thrusters selected were the T100 thrusters by BlueRobotics [27] (Figure4.3) since they are an affordable solution for underwater propulsion and are able to provide the necessary forces to drive the profiler downwards. The use of four thrusters allows to control the attitude of the vehicle and, therefore, perform the desired maneuvers.
Figure 4.3: T100 thrusters [27]
The speed of the brushess motor is controlled by four Afro Slim ESC 20 Amp [28] (one for each motor). This ESC supports up to 20 Ampere of current which allows to drive this thruster (maximum current is 11.5 Ampere) and has a voltage range of 7.4 Volt to 14.8 Volt. This ESC also has a compact format which is good for this application since space inside the hull is limited. To control the speed it uses a PWM signal as its input.
4.1.3 Scientific Data Sensors
To provide relevant data about water properties it was used a temperature sensor and a pressure sensor. This last one allows to calculate the depth in meters.
The used temperature sensor was the Blue Robotics Celsius Fast-Response since this device is already prepared to be attached to an watertight enclosure. It provides data through an I2C and has an accuracy of ± 0.1oC from -5 to 50oC. The pressure sensor used was the Blue Robotics Bar30. This pressure sensor can measure up to 30 Bar at depths up to 300 m with 0.2 mBar (equivalent to 2 mm) resolution. It also uses I2C to communicate.
22 Implementation
4.1.4 Navigation Sensors
The pressure sensor mentioned above is also a navigation sensor since it is used to calculate depth. Additionally, the vehicle uses an IMU to calculate its orientation and a GPS to know its abso-lute position when at surface.
The IMU used is the SparkFun 6 DOF Digital Combo Board - ITG3200/ADXL345 [29,30]. Combining the measurements from the accelerometer and the gyroscope present in this device, we can estimate the orientation of the system. This device communicates over I2C.
The GPS used is the Amaryllo Roots [31]. This device is used to obtain vehicle’s position when at surface. This device has an USB interface to connect to the processing unit.
4.1.5 Communication System
The vehicle should be able to receive the mission plan using an wireless connection and commu-nicate its position at the end of the mission.
To receive the mission plan, the processing unit used already has 802.11 b/g/n 2.4GHz WiFi interface that allows to access the system remotely. However, it was used TP-Link TL-WN725N Wireless USB adapter [32] mounted at the top of the profiler since, similarly to the GPS, WiFi does not work properly underwater.
4.1.6 Power System
As defined in section3.2, the vehicle should have enough power to perform 10 profiles to 200 m, along 24 hours. Considering this requirement, it was necessary to choose a set of batteries that provided enough power. Taking into account that space is limited and weight should be as low as possible, it was used Li-ion batteries, since this type of batteries offer higher energy density.
To choose the number of batteries necessary to provide power, it was considered three mo-ments of operation: idle, where the vehicle is waiting to perform a profile; during descent, where the profiler is performing a profile and transmitting its position at the end of the mission. Consid-ering the power consumption of every component used it was estimated the consumption during these three phases.
During idle time the estimated consumption is 3.42 W. During this period, the Iridium module can be used in low power mode since the position is not being transmitted. During the descent the vehicle has all subsystems turned on except for the Iridium module that is on low power mode. To estimate the consumption of the thrusters we used data from the MARES AUV and assumed a value of 70 W to drive the profiler down. Considering the other systems, the final value estimated for the consumption during descent is about 75 W. During the transmission of the final position, the Iridium module is used to transmit current position causing an increase in power consumption yielding a power consumption of 5.75 W during this period.
To calculate the battery capacity necessary to meet the requirements, it was considered that the profiler moves at a speed of 1 m/s during profiling, spends 24 hours in idle mode and that it
4.2 Hardware Implementation 23
spends half an hour in transmitting its position. Using the values presented above, the estimated capacity needed to fulfill the requirements is 126.95 Whr.
To manage power distribution to the system, as well as charging of the batteries after mission, it was used the Ocean Server BBDC-02R Dual Battery Controller with ATX Power Supply [33]. This module is an Intelligent Battery and Power System (IBPS) capable of providing the necessary power to the system and already has DC-DC converters to provide the necessary voltage levels.
To meet the capacity estimated above were used 2 Ocean Server BA95HC-FL [34] batteries yielding, a total capacity of 190 Whr. These are smart batteries that are compatible with the IBPS used and allow to easily access state data, like time to end and percentage to end.
4.1.7 Internal Sensors
As defined in section 3.2, the vehicle should detect water entrance and overheating inside the pressure case. Therefore, it was used a temperature sensor TMP 36 [35] to measure the tempera-ture inside the pressure housing. This device measures temperatempera-ture from -40oC to 125oC with an accuracy of ± 2oC that is good enough to detect overheating.
4.1.8 Interfaces
To communicate with the RS232 devices, two MAX232 [36] were used. This integrated circuit is a dual driver/receiver that allows to convert TTL to RS232 and RS232 to TTL levels. Since the BeagleBone Black has only one USB port, it was used a 4 port USB powered hub [37] to interface with the GPS, camera and the external Wi-fi.
4.2
Hardware Implementation
The prototype was mounted using modules available in the laboratory, like the pressure housing and endcaps, and 3D printed parts like the supports for the thrusters or the nose of the profiler. Figure4.4presents the final configuration of the profiler.
24 Implementation
Figure 4.4: Final configuration of the profiler
The electronics are mounted inside the pressure housing fixed to an aluminum frame (figure
4.5). The batteries are mounted at the bottom to lower the center of gravity of the vehicle and are fixed in the tray using 3D printed supports . The IBPS is mounted close to the batteries to reduce the cable length between the batteries and the power controller. Since space inside the pressure housing is limited, the processing unit and the ESCs are mounted on the other side of the the IBPS.
4.2 Hardware Implementation 25
On top of the processing unit is mounted an interface board (figures 4.6and4.7) where the sensors are connected.
Figure 4.6: Schematic of the interface board
This board was designed to have 4 RS232 connections (and the MAX232 devices to convert voltage levels), 4 connectors to connect to an I2C bus and the analog temperature sensor to measure internal temperature. This board was developed to reduce wiring inside the pressure housing due to space limitation. This way, all the interfaces are connected in the same place.
Figure 4.7: Interface board
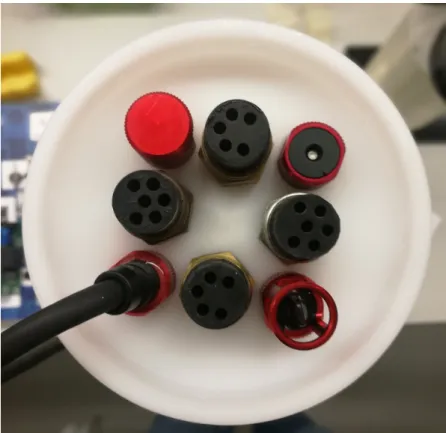
In the endcaps that seal the pressure housing are mounted the connectors to the outside of the pressure housing. In the upper endcap (figure4.8) are mounted:
26 Implementation
• the pressure and temperature sensor, to reduce cable length inside the pressure housing since the upper endcap is closer to the interface board were the sensors are connected
• two connectors to the thrusters, that need to be connected to the ESCs. These two connectors are branched for the four thrusters due to space limitations in the upper endcap
• the USB cables to the Wifi module and GPS, since these need to be mounted at the top end of the profiler to ensure that are above water level when the vehicle is at surface
• the charging cable that allows to recharge the batteries without needing to disassemble the vehicle.
• a connector that seals the pressure housing. This was used to test the sealing of the pressure housing
In the bottom lid is mounted a USB connector to interface with a camera.
Figure 4.8: Top endcap
4.3
Software Implementation
In this section, the software implementation will be presented that allows to execute the architec-ture proposed in3.4. It will also be described the interactions between different subsystems and how the different subsystems communicate with the processing unit.
4.3 Software Implementation 27
4.3.1 Device Drivers
To implement the software architecture described in section 3.4 it is necessary to develop a set of device drivers that allow to interface with the different subsystems described in section 3.3. Interfacing with the different hardware devices (as the I2C bus, UART ports, etc) available in the BeagleBone Black uses device files which allow the software to interact with the device driver as if it were a file [38].
For each device it was developed a library that implements a class with a set of methods that allow to interface with the device. It was used the Blacklib C++ library [39]. This library allows to use GPIO pins and interface with devices using I2C, UART and SPI.
4.3.1.1 I2C Devices
In this vehicle there are three devices that use an I2C interface to communicate data (IMU, tem-perature sensor and pressure sensor).
The IMU is composed by an accelerometer and a gyroscope. Therefore, to read the measure-ments provided by the IMU it is necessary to read both the accelerometer and the gyroscope. The IMU class (figure4.9) defined as follows:
Figure 4.9: IMU class
The initialization of the device is made according to the flowchart represented in figure4.10. This device is initialized by configuring the gyroscope and accelerometer for the desired operation, waiting 70 ms for the gyroscope to initialize and saving the time that is used for angle calculation
28 Implementation
Figure 4.10: Flowchart of the initialization of the IMU
The estimation of the angles using the measurements from the accelerometer and the gyro-scope is made using the algorithm implemented by [40]. The implementation of the filter was adapted from the FreeIMU library described in [41]. The angle measurement follows the flowchart represented in figure4.11.
4.3 Software Implementation 29
Figure 4.11: Flowchart for reading yaw, pitch and roll from the IMU
The class developed to interface with the temperature sensor is represented in figure4.12.
Figure 4.12: Temperature class
This implementation is based on the Arduino example available at [42]. As shown in figure
4.13, during initialization, the calibration parameters are read and stored in the private variables K0, K1, K2, K3 and K4 that are used to calculate the temperature as described in the datasheet.
30 Implementation
Figure 4.13: Flowchart representing the initialization of the temperature sensor
In the readTemperature method (figure4.14), the conversion is started and, when available, is used to calculate the temperature as described in the datasheet [43].
Figure 4.14: Flowchart for reading temperature values from the temperature sensor
4.3 Software Implementation 31
Figure 4.15: Pressure class
The Pressure class based on the Arduino implementation available at [42]. This class has a method to initialize the pressure sensor, reading the parameters from the sensor that are used for pressure calculation as shown in figure4.16.
32 Implementation
The pressure reading (figure4.17) is started and, when finished, is used to calculate the pres-sure using the method described in the datasheet [44]. It is also implemented a CRC method, as described in the datasheet, to detect possible errors during internal parameters reading.
Figure 4.17: Flowchart for reading values from the pressure sensor
4.3.1.2 RS-232
The Intelligent Battery Power System uses an RS-232 interface to communicate battery status. To communicate using RS-232 it is used one of the UART ports available in the BeagleBone Black configured with 19200 baudrate, no parity bit, one stop bit and 8 data bits as indicated in the IBPS software manual [45]. The class developed to interface with the battery manager is defined as shown in figure4.18.
4.3 Software Implementation 33
Figure 4.18: Battery Manager class
This class allows to read the remaining percentage and remaining time in minutes from the batteries connected to the Intelligent Battery Power System. The data transmitted from the IBPS is defined accordingly to the Smart Battery Data Specification [46]. As shown in figure4.19, when the class constructor is called, the UART port is opened using the configurations mentioned above and it is sent two bytes to start receiving the hexadecimal data from the IBPS.
Figure 4.19: Flowchart describing battery manager initialization
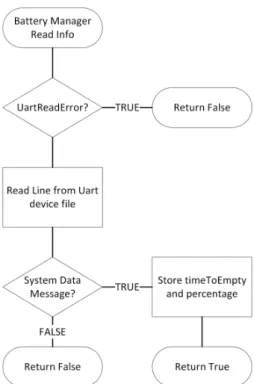
To obtain percentage and remaining time, it is read the device file of the UART port. When the system data message is received (message identified with "$S") the percentage and remaining time is saved (4.20).
34 Implementation
Figure 4.20: Flowchart for reading info from battery manager
4.3.1.3 USB
The USB is used to communicate with the GPS and Wi-fi.
For using the USB Wi-fi module, it was necessary to disable the onboard Wi-fi module. The GPS outputs data using the NMEA 0183 standard [47]. To interface with the USB, it is used its device file where the data is received from the GPS. The class developed is defined in figure4.21.
Figure 4.21: GPS class
The GPS constructor opens the respective device file.
To get a position fix is used the RMC message that contains the minimum recommended data wich includes time, status (indicates if fix is valid), latitude and longitude, speed over the ground,
4.3 Software Implementation 35
track angle in degrees, date and magnetic variation [47]. As shown in figure4.22, the data received from the GPS is only stored if the fix is valid.
Figure 4.22: Flowchart for reading position from GPS
4.3.1.4 PWM
The thrusters are controlled using PWM signal sent to the ESC’s. The Blacklib C++ library pro-vides a class to use PWM on the BeagleBone Black. However, this class does not work on the current version of the kernel of the BBB because the location of the device files is different than in the previous versions. Therefore it was developed a class (figure 4.23) to interface with the available PWM pins based on this example [48] that loads the PWM on Beagle Bone Black.
36 Implementation
Figure 4.23: PWM Class
The class constructor (figure4.24) configures the pins for PWM use and saves the path for the device files that allow to enable PWM, change period and duty cycle.
Figure 4.24: Flowchart for initializing PWM
4.3 Software Implementation 37
• period to change the period value in nanoseconds; • duty_cycle to change duty cycle value in nanoseconds;
• enable that if set to one enables the PWM or if set to zero disables the PWM.
The setPeriod, setDutyCycle, enablePWM and disablePWM are methods that allow to write on the proper device file.
4.3.1.5 ADC
The ADC is used to read the voltage value from the TMP36. To read the ADC, it was implemented a class (figure4.25) that in the constructor gets the path to the device file of the ADC and in the method getValue returns the voltage value in the pin.
Figure 4.25: ADC class
This class allows to obtain the value read by the ADC and convert it to a voltage value by doing:
V = ADCvalue ∗ 1.8
4095 (4.1)
The value 1.8 is the maximum voltage allowed in the ADC pins and 4095 is the resolution of the ADC.
This voltage value is then converted to the temperature value using:
Temperature=V− 0.5
0.01 (4.2)
4.3.1.6 ESC firmware
The used ESC comes preloaded with the SimonK firmware [49]. However, the default parameters used in this firmware does not allow to drive the thrusters in normal and reverse mode.
Therefore, it was flashed the firmware available at [50]. This firmware provided by the thruster manufacturer is a modified version of the above that allows normal and reverse mode and it is configured with the motor parameters.
4.3.1.7 Data sharing between processes
The data is made available to all the processes using shared memory. This was used since it is the fastest inter process communication (IPC) method [51].
38 Implementation
Shared memory allows to access the same memory by different processes and making changes in memory transparent to all processes that are attached to it. Since it is available to different processes, it is necessary to implement a synchronization mechanism between processes to prevent race conditions. The synchronization method used is described in section4.3.1.8.
It is used two blocks of shared memory: data and timestamps (table 4.2). In the memory allocated for data, it is available the data read from the different sensors present in the system while in timestamp is available the time at which the data was acquired.
Table 4.2: Shared memory
Position Data Timestamp
0 External Temperature Timestamp Temperature
1 Pressure Timestamp Pressure
2 Depth Timestamp Depth
3 Yaw Timestamp Yaw
4 Pitch Timestamp Pitch
5 Roll Timestamp Roll
6 Internal Temperature Timestamp Internal
Temperature
7 Batteries Average Charge
Percentage
Timestamp Batteries Percentage
8 Minutes to Empty Batteries Timestamp Minutes to
Empty
9 Latitude Timestamp Latitude
10 Longitude Timestamp Longitude
4.3.1.8 Synchronization between processes
Taking into account that it was used shared memory and that the kernel does not synchronize access to shared memory [51], it is necessary to use a synchronization mechanism.
To synchronize accesses to this resource by different processes it was used Inter Process (IPC) semaphores. Semaphores are a synchronization mechanism that are used to control access to a resource. Every time that a process needs to access the shared memory, it has to lock the semaphore or wait until the resource is available. After accessing the shared memory the process must free the resource.
4.3.2 Mission Plan
To read the mission plan it was developed two classes (Mission and Actions), available in the Mission library (figure4.26).
The Actions class defines the parameters of each command read from the file and the time of start and time of finish.
4.3 Software Implementation 39
The Mission class has a method to read the config.ini file that inserts each command in a vector of Actions. This vector will store the commands read from the file that will be executed by the vehicle.
Figure 4.26: Mission and Actions classes
To plan a mission on the vehicle, the user must create a mission file with the name config.ini (as shown in figure4.27). This file must be started with [mission] and the following commands are available:
• gotoz=<depth> <pitch> <roll> S <descent_rate> T <timeout> — command that allows to profile to a certain depth (in meters) controlling the pitch, roll (in degrees) and descent rate (m/s).
• surface=<depth> S <ascent_rate> T <timeout> — command to make the profiler surface with a defined ascent rate (m/s).
• wait=<seconds> — command to wait for a determined period of seconds. Allows to set intervals between different maneuvers. Since the vehicle has a positive buoyancy, the vehicle waits at surface.
• hover= <depth> D <duration> T <timeout> — command to hover at fixed depth during the number of seconds defined in duration.
For each command (except the wait command that stops the profiler), a timeout must be set to, in case the profiler does not complete the maneuver, this is interrupted and the next command is executed.
![Table 2.1: Comparative table of different profilers AVP [7, 11] HUP[14] Airdroppedprofiler [12] ASIP[4] APEXArgo[22] APEX Deep Float[9] Length 1.17m 2.1m 0.70m 2m 1.27m 0.432m Diameter 0.184m 0.23m N.P 0.19m 0.165m 0.432m Weight on Air ∼13Kg N.P 7Kg 80Kg 2](https://thumb-eu.123doks.com/thumbv2/123dok_br/15714184.1069613/31.892.155.823.222.1065/comparative-different-profilers-airdroppedprofiler-apexargo-length-diameter-weight.webp)