REM WORKING PAPER SERIES
Transport-Induced Agglomeration Effects: Evidence for US Metropolitan
Areas
Patricia C. Melo and Daniel J. Graham
REM Working Paper 006-2017
October 2017
REM – Research in Economics and Mathematics
Rua Miguel Lúpi 20,1249-078 Lisboa, Portugal
ISSN 2184-108X
Any opinions expressed are those of the authors and not those of REM. Short, up to two paragraphs can be cited provided that full credit is given to the authors.
Transport-Induced Agglomeration Effects: Evidence for US Metropolitan Areas
Patricia C. Meloa†, Daniel J. Grahamb
a ISEG – School of Economics and Management, Universidade de Lisboa and REM – Research in
Economics and Mathematics, UECE – Research Unit on Complexity and Economics
b Centre for Transport Studies, Department of Civil and Environmental Engineering, Imperial College London, London SW7 2AZ, United Kingdom
Abstract
While the interaction between transport and agglomeration economies is widely accepted, there is
insufficient research attempting at a direct empirical quantification. Using a balanced panel dataset
for US metropolitan areas, we estimate a system of simultaneous equations to measure the indirect
effect of urban agglomeration economies which arises through transport provision. Our findings
suggest that public transit reinforces the effect of urban agglomeration, whereas road lane miles
appear to weaken it. The results highlight the importance of public transit in supporting positive
urban agglomeration externalities.
JEL Classification: R11, R12, R41
Keywords: Transport-induced agglomeration effects, productivity, system of simultaneous equations, metropolitan areas
1. Introduction
The relationship between transport and agglomeration economies has been formally described by
Venables (2007), who showed that there are productivity gains from urban transport improvements
that arise through city size. By facilitating the connectivity between people and economic activities,
transport networks can reinforce the productivity effects arising due to agglomeration externalities,
namely, those relating to knowledge spillovers, labour market pooling, and input-output sharing
(e.g. Henderson, 2003, Rosenthal and Strange, 2004). Surprisingly, and in spite of the abundant
research on the relationship between productivity and agglomeration economies (see Rosenthal and
Strange, 2004, Melo et al., 2009 for recent reviews of the literature), there is limited research on the
nature of transport-induced agglomeration effects on productivity.
Accessibility type measures of agglomeration economies such as market potential and
effective density have increasingly been used in the literature to establish a clearer link between
transport and agglomeration economies. This improves on previously used measures of
agglomeration economies (i.e. total population, employment density, etc.) by providing a better
representation of proximity to economic activities. However, the majority of these studies measure
accessibility in terms of physical distance (e.g. Mion and Naticchioni, 2005, Graham, 2007a,
Graham and Kim, 2008, Combes et al., 2008, Rosenthal and Strange, 2008, Di Addario and
Patacchini, 2008, Fally et al., 2010, Hering and Poncet, 2010, Fallah et al., 2011).
Only a few studies have used transport-based measures of agglomeration economies. Lall et
al. (2004), Rice et al. (2006), Graham (2007b), Holl (2012) and Le Néchet et al. (2012) used
accessibility type measures based on travel times derived from the road network to measure
agglomeration economies. While these studies allow for a direct role of (road) transport in the
measurement of agglomeration, they cannot inform about the extent to which agglomeration effects
are reinforced or weakened through transport systems. Existing literature on transport and
urbanisation suggests that the provision of road transport has led to the decentralisation of
transit is associated with spatial concentration and increased urban densities. There is extensive
research on the relation between urban form (and more generally the built environment) and travel
demand, much of which supports a positive link between higher densities and public transit (Leck,
2006, Ewing and Cervero, 2010). The prevailing view is that urban spatial structures based on
private road transport tend to encourage sprawling and dispersal of activities, reducing the scope
and reach of agglomeration economies (e.g. Burchfield et al., 2006, Baum-Snow, 2007a). In
contrast, public transit networks tend to be more compatible with higher densities and hence
possibly also stronger agglomeration effects.
To the best of our knowledge the only study on the indirect productivity effects of transport
is Chatman and Noland (2014), who find significant indirect productivity effects of public transit
provision for US metropolitan areas. They also find that higher rates of road transport infrastructure
reduce central city employment density, but do not derive its indirect effect on productivity (that is,
whether it is positive or negative). In this paper we develop a system of simultaneous equations
based on panel data for Metropolitan Statistical Areas (MSA) in the United States to investigate the
component of urban agglomeration effects on productivity which arises through transport
investment (i.e. transport-induced urban agglomeration effects), and distinguish between road
transport and public transit effects.
The most interesting finding of this research is that public transit reinforces urban
agglomeration economies, while road lane miles appear to weaken it. This suggests that
transport-induced urban agglomeration effects are positive for public transit but negative for road transport,
and highlights the importance of transit services in supporting productivity gains from urban
agglomeration. The direct effect of doubling employment density (i.e. urban agglomeration) on
labour productivity is 3%, while the overall net effect is approximately 2%. These values fall within
the range of values (2%-5%) identified by Glaeser and Mare (2001) for the US for the wage
elasticity of employment density, and are also broadly consistent with the values reported in
The structure of the paper is as follows. Section 2 describes the research approach,
estimation strategy, data and model specification. Section 3 presents and discusses the results, and
Section 4 summarises the main conclusions.
2. Empirical methodology and data 2.1. Research approach
The empirical methodology follows the approach developed by Charlot and Duranton (2004) to
measure the role of communication externalities on agglomeration effects in French cities. The
authors estimated separate wage and communication models to quantify how much of the effect of
agglomeration economies arises through communication externalities. Our approach combines the
estimation of labour productivity models to measure urban agglomeration economies with the
estimation of transport models to measure the link between urban agglomeration, transport, and
productivity. The models are estimated in a system of simultaneous equations to allow for joint
causality and dependence, according to equations (1) to (3) respectively.
Productivity-urban agglomeration effects
Wage equations can be used to model labour productivity under the assumption that input factors
are paid the value of their marginal products (i.e. wage rates should reflect, even if partially, labour
productivity). The literature offers several explanations for the presence spatial disparities in labour
productivity, including both exogenous and endogenous factors. These include differences in
human capital (e.g. Rauch, 1993, Glaeser and Mare, 2001, Moretti, 2004), in the cost of living
(mainly housing) and the quality of local amenities (e.g. Roback, 1982, Glaeser and Gottlieb, 2009),
and agglomeration externalities (Fujita and Thisse, 2002).
We define a wage model where labour productivity, measured by average metropolitan area
wage, is as a function of urbanisation economies represented by employment density (DENS),
for the industrial and occupational distribution of local employment in industry k (Ek/E) and
occupation o (Eo/E), the availability of transport - both road lane miles (RLM) and transit vehicle
miles (TVM), and the local cost of living measured by a housing price index (HPI). Equation (1)
provides a general description of the wage model, from which it is possible to estimate the direct
effects of urban agglomeration and transport investment (by type of transport system) on labour
productivity. ) , , , , , , ( 1 RLM TVM HPI E E E E EDU DENS f W k o (1) Transport-agglomeration effects
Transport investment is simultaneously determined with urban agglomeration: it is a function of
urban size (i.e. larger urban areas require more transport) but at the same time facilitates additional
interactions (i.e. movements) and hence increased urban size. To separate between the effects of
road transport and public transit on urban agglomeration (as discussed in the introduction), we
estimate two transport models defined in equations 2 and 3 respectively. The specification of the
models follows the literature on induced travel demand and transport investment (e.g. Noland and
Cowart, 2000, Noland and Lem, 2002, Cervero and Hansen, 2002, Cervero, 2002). The provision of
road lane miles (RLM) is a function of traffic demand measured by road vehicle miles travelled
(VMT), previous congestion levels measured in terms of total hours of delay (HDELAY), the size of
the metropolitan area measured both in terms of total population (POP) and employment density
(DENS), and economic output measured by GDP per capita (GDPpc). Similarly, the provision of
transit vehicle miles (TVM) is defined as a function of transit passenger miles travelled (PMT), the
size of the metropolitan area measured both in terms of total population (POP) and employment
density (DENS), and economic output (GDPpc).
) , , , , (
2 VMT POP DENS GDPpc HDELAY f
) , , , ( 3 PMT POP DENS GDPpc f TVM (3)
Transport-induced agglomeration effects on productivity
The wage model in equation (1) allows us to estimate the direct effect of urban agglomeration and
transport infrastructure on labour productivity. The two transport models in equations (2) and (3)
allow us to identify the relation between transport provision and urban agglomeration. By
combining the coefficients obtained from the wage and transport models we can determine how
much of the productivity effects from urban agglomeration arise through the provision of roads and
public transit respectively (see detailed explanation in section 2.3. below).
2.2. Data
The data used in our analysis consist of a balanced panel of 84 Metropolitan Statistical Areas for the
period 2001-2008. We collated data from different sources for socio-economic and transport related
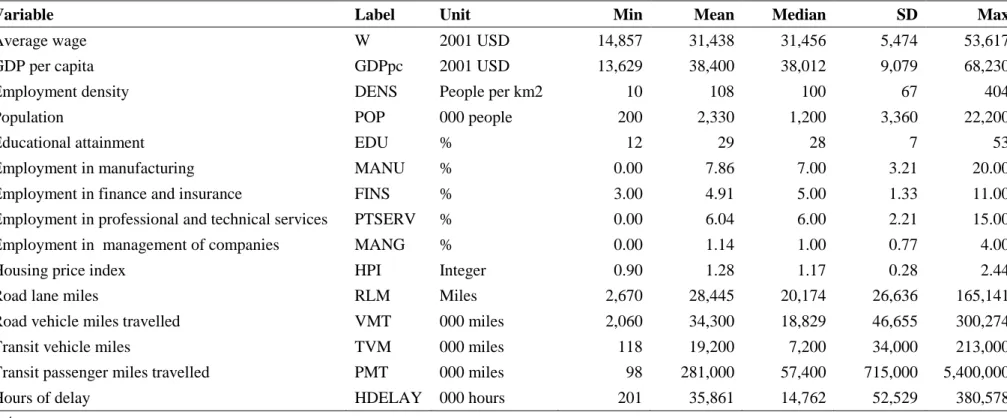
variables, as defined in equations (1) to (3) above. Table 1 provides basic descriptive statistics for
these variables, which are summarised below, while Table 2 provides pairwise correlation
coefficients for the explanatory variables included in the wage and transport models.
Socio-economic data contain the variables used to measure metropolitan area labour
productivity and economic output, educational attainment, urban agglomeration, industrial and
occupational composition, and local cost of living:
Labour productivity is represented by average real wages (W), available from the Regional Economic Information System (REIS) of the Bureau of Economic Analysis (BEA). To calculate
real average earnings we use the GDP deflator with base year for 2001.
Data for economic output measured by GDP per capita (GDPpc) in 2001 USD were also obtained from the Bureau of Economic Analysis.
To account for differences in the industrial and occupational structure across the metropolitan areas, we use a set of covariates for the proportion of local employment in manufacturing
(MANU), finance and insurance (FINS), professional and technical services (PTSERV) and the
management of companies and enterprises (MANG). These data were obtained from the BEA’s
REIS database.
Urban agglomeration economies are measured by employment density (DENS), where employment data were obtained from the BEA’s REIS database.
Data for MSA population were obtained from US Census Bureau, Population Division.
Human capital is measured by the level of educational attainment and consists of the percentage of people aged 25 years and over holding a bachelor’s or higher degree (EDU). Data for
educational attainment were obtained from the American Community Survey.
Data for the local housing price index (HPI) were obtained from the Federal Housing Finance Agency (FHFA).
Transport-related data contain the variables used to measure road transport supply, public transit
supply, traffic demand, transit demand, and road congestion.
Road transport supply is measured in terms of lane miles (RLM) for both freeways and arterial streets, and road travel demand is measured by vehicle-miles travelled (VMT). Data for road
transport and road travel are obtained from the Texas Transportation Institute Urban Mobility
Reports.
Public transit supply is measured by the number of revenue vehicle miles (TVM) for rail modes (commuter rail, light rail and heavy rail) and buses. Public transit demand is measured by
passenger miles travelled (PMT) by rail modes and bus. Data for public transit supply and
demand are obtained from the National Transit Database (NTD) for the urbanized areas
contained in the metropolitan areas considered in our study.
We also account for road congestion in the main urbanized areas of each metropolitan area, measured in terms of annual hours of total delay (HDELAY). Data for road congestion are
Table 1: Descriptive statistics
Variable Label Unit Min Mean Median SD Max
Average wage W 2001 USD 14,857 31,438 31,456 5,474 53,617
GDP per capita GDPpc 2001 USD 13,629 38,400 38,012 9,079 68,230
Employment density DENS People per km2 10 108 100 67 404
Population POP 000 people 200 2,330 1,200 3,360 22,200
Educational attainment EDU % 12 29 28 7 53
Employment in manufacturing MANU % 0.00 7.86 7.00 3.21 20.00
Employment in finance and insurance FINS % 3.00 4.91 5.00 1.33 11.00
Employment in professional and technical services PTSERV % 0.00 6.04 6.00 2.21 15.00
Employment in management of companies MANG % 0.00 1.14 1.00 0.77 4.00
Housing price index HPI Integer 0.90 1.28 1.17 0.28 2.44
Road lane miles RLM Miles 2,670 28,445 20,174 26,636 165,141
Road vehicle miles travelled VMT 000 miles 2,060 34,300 18,829 46,655 300,274
Transit vehicle miles TVM 000 miles 118 19,200 7,200 34,000 213,000
Transit passenger miles travelled PMT 000 miles 98 281,000 57,400 715,000 5,400,000
Hours of delay HDELAY 000 hours 201 35,861 14,762 52,529 380,578
Notes:
Min=minimum, SD=standard deviation, Max=maximum.
Table 2: Pairwise correlation coefficients
Variables W GDPpc DENS POP EDU MANU FINS PTSERV MANG HPI RLM VMT TVM PMT HDELAY
W 1.00 GDPpc 0.78 1.00 DENS 0.35 0.28 1.00 POP 0.47 0.35 0.22 1.00 EDU 0.69 0.61 0.15 0.21 1.00 MANU 0.14 0.21 0.08 0.06 0.04 1.00 FINS 0.47 0.49 0.39 0.21 0.34 0.00 1.00 PTSERV 0.65 0.54 0.19 0.37 0.65 -0.09 0.29 1.00 MANG 0.41 0.34 0.17 0.22 0.28 0.28 0.30 0.23 1.00 HPI 0.17 -0.16 0.13 0.15 -0.01 -0.37 -0.01 0.07 0.00 1.00 RLM 0.55 0.45 0.22 0.95 0.31 0.09 0.28 0.45 0.30 0.09 1.00 VMT 0.48 0.38 0.18 0.97 0.24 0.06 0.19 0.37 0.19 0.16 0.93 1.00 TVM 0.50 0.39 0.42 0.83 0.28 -0.01 0.23 0.44 0.18 0.13 0.80 0.73 1.00 PMT 0.45 0.32 0.33 0.83 0.24 -0.01 0.19 0.37 0.16 0.12 0.78 0.71 0.98 1.00 HDELAY 0.48 0.43 0.52 0.71 0.27 -0.01 0.22 0.43 0.10 0.14 0.74 0.72 0.85 0.75 1.00
10 2.3. Detailed model specification
The fully specified models estimated simultaneously are described in equations (4) to (6).
it r t it it it it it it it it it it HPI TVM RLM MANG PTSERV FINS MANU EDU DENS W 1 9 8 7 6 5 4 3 2 1 0 ln ln ln ln ln (4) it r t it it it it it
it VMT POP DENS GDPpc HDELAY
RLM 01ln 12ln 3ln 4ln 15ln 1 ln (5) it r t it it it it it PMT POP DENS GDPpc TVM 01ln 12ln 3ln 4ln 1 ln (6)
where the subscripts i and t identify the MSA and year respectively, and the variables are as defined
in section 2.2 above. Besides the main explanatory variables, we also include a set of temporal (λt,
ωt, ψt) and regional (γr, ηr, σr) control variables in each equation to capture potential unobserved heterogeneity.1 ℰit, υit and νit are the residual error terms and are assumed to be normally distributed while allowing for heteroskedasticity and clustering on metropolitan areas. The indirect effect of
urban agglomeration economies that arises through the provision of road lane miles and public
transit vehicle miles is (β7*α3) and (β8*δ3) respectively, which can be compared with the direct (β1)
and overall net effect (β1+ β7*α3+ β8*δ3) of urban agglomeration on labour productivity.
2.4. Estimation strategy
The disturbance terms in equations (4) to (6) are likely to be contemporaneously correlated because
some unobserved factors that influence the error term in one equation may also influence the error
term in the other equation. Not accounting for this correlation and estimating the equations
separately would lead to inefficient estimates of the model parameters. Therefore, we adopt the
estimation procedure known as seemingly unrelated regression (SUR) (Roback, 1982).
The main estimation issues that need to be taken into consideration to ensure that we obtain
consistent and unbiased parameter estimates relate to unobserved heterogeneity, omitted variable
1 Regional controls based on appropriate combination of Census regions and divisions (East North Central, East South
11 bias, and reverse causality. All three are potential sources of endogeneity bias and inconsistent
parameter estimates. In the context of panel data, unobserved heterogeneity and omitted variable
bias can be addressed through the use of subject-specific effects, which can be assumed to be fixed
or random. The choice of estimator depends on whether there is correlation between the model
covariates and subject unobserved heterogeneity. To address the issues relating to reverse causality,
instrumental variable (IV) techniques can be combined with SUR, resulting in a simultaneously
estimation of the system of equations generally called three-stage-least squares (3SLS) (Zellner and
Theil, 1962).
We suspect of reverse causality between labour productivity, educational attainment, and
urban agglomeration. Metropolitan areas with higher worker productivity (and wages) are likely to
attract workers with higher educational levels (i.e. sorting of higher skills), and generally more
workers and firms; this in turn increases the level of human capital and urban agglomeration. We
construct a set of instruments using a method similar to that used by Fingleton (2003, 2006), who
instrumented agglomeration economies using a three-group rank method. Variations of this method
can be used to get a better differentiation (i.e. more groups) of values for the instrumental variable.
We use a five-group method which ranks the endogenous variable into one of five quintiles
according to its size and then defines the instrumental variable as the rank order (Kennedy, 2003,
p.162-163). Instruments are constructed in this fashion for employment density (DENS) and
educational attainment (EDU). The pairwise correlation between the instruments and the
endogenous variables is 0.88 for employment density and 0.89 for human capital, suggesting strong
relevance in both cases.
There may also be issues of reverse causality between transport provision, travel demand,
traffic congestion, and economic output in equations (5) and (6). To avoid simultaneity bias in the
transport models, we use the first lag of road traffic and transit demand (VMTt-1, PMTt-1), road
traffic congestion (HDELAYt-1), and economic output (GDPpct-1). The underlying idea is that
12 traffic congestion and past levels of economic output. Similarly, we use a time lag for the local
housing price index (HPIt-1) in the wage model in equation (4) to avoid potential simultaneity bias.
4. Results and discussion
The main findings obtained from the system of simultaneous equations are reported in Table 3.
Overall, the explanatory power of the models is high. The value of the coefficient of determination
(R2) is 0.74 for the wage model and 0.95 for the road and transit supply models. Moreover, the sign
of the coefficients is generally what we would expect from theory and previous studies.
We first discuss the results for the relationship between productivity, urban agglomeration,
and transport provision. The results show that the direct effect of urban agglomeration on average
metropolitan area labour productivity is 0.032, while the overall net effect is 0.019. This indicates
that the net effect (i.e. after we account for transport provision) of urban agglomeration economies
is 60% of its direct effect. The difference between the net effect and the direct effect results from
the interaction between urban agglomeration and transport, which differs according to the type of
transport system. The relationship is positive for public transit and negative for road transport. That
is, the provision of public transit services appears to strengthen the effect of urban agglomeration
economies, while the provision of road lane miles appears to weaken the effect of urban
agglomeration economies. The provision of public transit increases the direct effect of urban
agglomeration by 7%, while the provision of road lane miles reduces the direct effect of urban
agglomeration by nearly 48%. We discuss these results in greater detail in the following paragraphs.
Higher employment densities are associated with lower provision of road transport (-0.294),
while larger population bases are positively associated with the provision of road transport
(+0.170). An increase of 10% in the level of metropolitan area employment density and total
population is associated with a reduction of 2.9% and an increase of 1.7% in road lane miles
respectively. The key point here is that overall population size is positively associated with road
13 latter might be the positive relation between higher employment densities and scarcity of land, and
the fact that road transport is space intensive. On the other hand, both employment density and
overall population are positively associated with the provision of public transit. An increase of 10%
in metropolitan area employment density and population is associated with an increase of 2.1% and
2.7% in transit vehicle miles respectively. The main finding for the relation between urban
agglomeration and transport provision is that higher employment densities support the provision of
public transit services, but are negatively associated with the provision of roads.
From the wage model, it is also possible to estimate the direct effect of transport on
productivity, which is positive for both road (+0.052) and public transit (+0.011) provision.
However, the coefficient for transit services is not statistically significant. Turning to the other
covariates in the wage model, the results are in line with expectations and previous studies and
indicate positive returns to education, partial compensation of higher local housing cost, and higher
wage rates for finance and insurance compared to other employment sectors.
As for the remaining covariates in the transport models, we find that in both cases previous
levels of travel demand determine future levels of road lane miles and public transit services. The
elasticity value is 0.44 for road traffic and 0.54 for public transit demand. Similarly, road traffic
congestion helps predict future levels of road transport infrastructure: on average, a 10% increase in
the total hours of delay is associated with an increase of 1.4% in road lane miles on the following
year. Finally, the results also indicate that increased economic activity, measured by GDP per
capita, also determines future levels of transport provision, with an elasticity value equal to 0.31 for
14 Table 3: Results from the wage and transport provision models
Variables Wage equation Road supply equation Transit supply equation
Log of employment density (DENSit) 0.032*** -0.294*** 0.214***
Log of educational attainment (EDUit) 0.010***
Employment in manufacturing (MANUit) 0.010***
Employment in finance and insurance (FINSit) 0.017***
Employment in professional and technical services (PTSERVit) 0.010***
Employment in management of companies (MANGit) 0.013**
Log of road lane miles (RVMit) 0.052***
Log of transit vehicle miles (TVMit) 0.011
Lag of Housing Price Index (HPIit-1) 0.124***
Lag of log of road vehicle miles travelled (VMTit-1) 0.436***
Lag of log of transit vehicle miles travelled (PMTit-1) 0.538***
Log of population (POPit) 0.170* 0.270***
Lag of log of GDP per capita (GDPpcit-1) 0.307*** 0.409***
Lag of log of number of hours of delay (HDELAYit-1) 0.140***
Year controls yes yes yes
Regional controls yes yes yes
Joint significance of regional dummies
Joint significance of time dummies
R2 0.74 0.95 0.95
Observations 581 581 581
Notes:
***, **, * indicate significance at 1%, 5%, and 10%, respectively.
Endogenous regressors: Wage model: educational attainment, employment density, road lane miles, transit
vehicle miles; Road supply model: population, employment density; Transit supply model: population, employment density.
Instruments: five-group method instrumental variables for employment density, educational attainment, and
population.
Due to inclusion of lagged values of some variables, and also missing data for public transit variables, reduces the total number of observations from 672 (8 years and 84 regions) to 581.
15 5. Conclusions
It has been shown by Venables (2007) that there are productivity gains from urban transport
improvements which arise through agglomeration economies. Despite this interaction between
transport and agglomeration economies is widely accepted by the community of researchers
interested in the productivity-agglomeration relationship, there is insufficient research attempting to
empirically quantify this interaction.
This paper contributes to the literature by measuring the indirect effects of urban
agglomeration economies which arise through the provision of road transport and public transit. The
most important finding of our analysis is that although road transport has a direct positive impact on
labour productivity, it appears to reduce the scope for productivity gains derived from urban
agglomeration. These findings are in line with existing evidence that private road transport tends to
encourage sprawling and dispersal of activities, reducing the scope and reach of agglomeration
economies (e.g. Burchfield et al., 2006, Baum-Snow, 2007a). On the other hand, public transit
services are found to support the productivity gains from urban agglomeration economies. This
indicates that transport-induced urban agglomeration effects can be reinforced by public transit but
weakened by road transport.
In drawing conclusions for policy implications, one needs to distinguish between the
different spatial scales at which agglomeration externalities may operate. Our study focused on
intra-metropolitan area interactions but there may be scope for inter-metropolitan area effects which
may rely more on road networks than public transit. As a result, we posit that our findings of a more
efficient effect of public transit services in maximising the opportunity for interactions (and hence
urban agglomeration externalities) in urban environments is a plausible result.
References
BAUM-SNOW, N. 2007a. Did Highways Cause Suburbanization? Quarterly Journal of
Economics, 122, 775–805.
BAUM-SNOW, N. 2007b. Suburbanization and Transportation in the Monocentric Model. Journal
16 BURCHFIELD, M., OVERMAN, H. G., PUGA, D. & TURNER, M. A. 2006. Causes of Sprawl: A
Portrait from Space. Quarterly Journal of Economics, 121, 587-633.
CERVERO, R. 2002. Induced travel demand: Research design, empirical evidence, and normative policies. Journal of Planning Literature, 17, 2-20.
CERVERO, R. & HANSEN, M. 2002. Induced Travel Demand and Induced Road Investment: A Simultaneous Equation Analysis. Journal of Transport Economics and Policy, 36, 469-490 CHARLOT, S. & DURANTON, G. 2004. Communication Externalities in Cities. Journal of Urban
Economics, 56, 581-613.
CHATMAN, D. G. & NOLAND, R. B. 2014. Transit Service, Physical Agglomeration and Productivity in US Metropolitan Areas. Urban Studies, 51, 917-937.
COMBES, P.-P., DURANTON, G. & GOBILLON, L. 2008. Spatial Wage Disparities: Sorting Matters! Journal of Urban Economics, 63, 723-742.
DI ADDARIO, S. & PATACCHINI, E. 2008. Wages and the City. Evidence from Italy. Labour
Economics, 15, 1040-1061.
EWING, R. & CERVERO, R. 2010. Travel and the Built Environment: A Meta-Analysis. Journal
of the American Planning Association, 76, 265-294.
FALLAH, B. N., PARTRIDGE, M. D. & OLFERT, M. R. 2011. New Economic Geography and US Metropolitan Wage Inequality. Journal of Economic Geography, 11, 865-895.
FALLY, T., PAILLACAR, R. & TERRA, C. 2010. Economic Geography and Wages in Brazil: Evidence from Micro-Data. Journal of Development Economics, 91, 155-168.
FINGLETON, B. 2003. Increasing Returns: Evidence from Local Wage Rates in Great Britain.
Oxford Economic Papers, 55, 716-739.
FINGLETON, B. 2006. The New Economic Geography versus Urban Economics: An Evaluation Using Local Wage Rates in Great Britain. Oxford Econonomic Papers, 58, 501-530.
FUJITA, M. M. & THISSE, J.-F. 2002. Economics of Agglomeration-Cities, Industrial Location
and Regional Growth, Cambridge, Cambridge University.
GLAESER, E. L. & GOTTLIEB, J. D. 2009. The Wealth of Cities: Agglomeration Economies and Spatial Equilibrium in the United States. Journal of Economic Literature, 47, 983-1028.
GLAESER, E. L. & MARE, D. C. 2001. Cities and Skills. Journal of Labor Economics, 19, 316-342.
GRAHAM, D. J. 2007a. Agglomeration, Productivity and Transport Investment. Journal of
Transport Economics and Policy, 41 (3), 317-343.
GRAHAM, D. J. 2007b. Variable Returns to Urbanization and the Effect of Road Traffic Congestion. Journal of Urban Economics, 62, 103-120.
17 GRAHAM, D. J. & KIM, H. Y. 2008. An Empirical Analytical Framework for Agglomeration
Economies. Annals of Regional Science, 42, 267-289.
HENDERSON, J. V. 2003. Marshall's Scale Economies. Journal of Urban Economics, 53, 1-28. HERING, L. & PONCET, S. 2010. Market Access Impact on Individual Wages: Evidence from
China. Review of Economics and Statistics, 92, 145-159.
HOLL, A. 2012. Market Potential and Firm-Level Productivity in Spain. Journal of Economic
Geography, 12, 1191-1215.
KENNEDY, P. 2003. A Guide to Econometrics, Blackwell Publishing.
LALL, S. V., SHALIZI, Z. & DEICHMANN, U. 2004. Agglomeration Economies and Productivity in Indian Industry. Journal of Development Economics, 73, 643-673.
LE NÉCHET, F., MELO, P. C. & GRAHAM, D. J. 2012. The Role of Transport Induced Agglomeration Effects on Firm Productivity in Mega-City Regions: Evidence for Bassin Parisien. Transportation Research Record: Journal of the Transportation Research Board, 2307, 21-30.
LECK, E. 2006. The Impact of Urban Form on Travel Behavior: A Meta-Analysis. Berkeley
Planning Journal, 19, 37-58.
MELO, P. C., GRAHAM, D. J. & NOLAND, R. B. 2009. A Meta-Analysis of Estimates of Urban Agglomeration Economies. Regional Science and Urban Economics, 39, 332-342.
MION, G. & NATICCHIONI, P. 2005. Urbanization Externalities, Market Potential and Spatial Sorting of Skills and Firms. CEPR Discussion Papers 5172. Centre for Economic
Performance, London School of Economics and Political Science.
MORETTI, E. 2004. Human Capital Externalities in Cities. In: HENDERSON, J. V. & THISSE, J. F. (eds.) Handbook of Regional and Urban Economics. Amsterdam: North-Holland.
NOLAND, R. B. & COWART, W. A. 2000. Analysis of Metropolitan Highway Capacity and the Growth in Vehicle Miles of Travel. Transportation, 27, 363-390.
NOLAND, R. B. & LEM, L. L. 2002. A Review of the Evidence for Induced Travel and Changes in Transportation and Environmental Policy in the US and the UK. Transportation Research D
(Transport and Environment), 7(1), 1-26.
RAUCH, J. E. 1993. Productivity Gains from Geographic Concentration of Human Capital: Evidence from the Cities. Journal of Urban Economics, 34, 380-400.
RICE, P., VENABLES, A. J. & PATACCHINI, E. 2006. Spatial Determinants of Productivity: Analysis for the Regions of Great Britain. Regional Science and Urban Economics, 36, 727-752.
ROBACK, J. 1982. Wages, Rents, and the Quality of Life. Journal of Political Economy, 90, 1257-1278.
18 ROSENTHAL, S. S. & STRANGE, W. C. 2004. Evidence on the Nature and Sources of Agglomeration Economies. In: HENDERSON, J. V. & THISSE, J. F. (eds.) Handbook of
Urban and Regional Economics, Vol.4. Amsterdam: Elsevier.
ROSENTHAL, S. S. & STRANGE, W. C. 2008. The Attenuation of Human Capital Spillovers.
Journal of Urban Economics, 64, 373-389.
VENABLES, T. 2007. Evaluating Urban Transport Improvements: Cost Benefit Analysis in the Presence of Agglomeration and Income Taxation. Journal of Transport Economics and Policy, 41, 173-188.
ZELLNER, A. & THEIL, H. 1962. Three-Stage Least Squares: Simultaneous Estimation of Simultaneous Equations. Econometrica, 30, 54-78.