Chickens
Luiz Fernando Teixeira Albino Depart ament o de Zoot ecnia Universidade Federal de Viçosa 36.570-000. Vicosa, M G, Brazil Phone: 55 (31) 3899 3310 Fax: 55 (31) 3899 2275
E-mail: [email protected]
Mail Address
Keywords
Bro iler ch ick en s, io n , m in eral, p o t assiu m , requirement, w eight gain.
Oliveira JE1
Albino LFT1
Rostagno HS1
Páez LE2
Carvalho DCO2
1 Fu ll Pr o f esso r , Dep ar t m en t o f A n im al
Science, Universidade Federal de Viçosa, Viçosa, M inas Gerais, Brazil.
2 Gr ad u at e st u d en t in A n im al Scien ce,
Department of animal Science, Universidade Federal de Viçosa. Viçosa, M inas Gerais, Brazil.
Author(s)
Arrived: october / 2004 Approved: january / 2005
ABSTRACT
Three experiment s w ere conduct ed t o det ermine t he nut rit ional requirements of potassium (K) for male Ross broiler chickens, from 8 to 21, 22 to 42 and 43 to 53 days of age. The follow ing parameters w ere evaluated: body w eight gain (BWG), feed intake (FI) and feed conversion ratio (FCR). In each experiment, a completely randomized experimental design w as used, w ith six treatments (K levels), and six, eight and eight numbers of replicates, and eight, five and four birds per pen, respectively. The experimental diets w ere basal diets deficient in K but supplemented w ith K carbonate to result in levels of 0.30, 0.44, 0.58, 0.72, 0.86 and 1.00% K. Estimated requirements for BWG w ere 0.628, 0.714 and 0.798% K, for the periods 8-21, 22-42 and 43-53 d, respectively.
INTRODUCTION
Potassium is the third more abundant element of the animal body (M cDow ell, 1992) and the main intracellular cation. It participates on the processes that are essential to the body homeostasis, such as the acid-base equilibrium, osmot ic pressure regulat ion, development of membrane potentials of cells (nerve transmission, muscle activity, cardiac function), activation of numerous intracellular enzymes, and glucose and amino acid absorption and transport (Rinehart et al., 1968; Reece, 1996; Leeson & Summers, 2001). Nevertheless Potassium does not w ork alone and the correct balance betw een Na, K and Cl is necessary for best animal performance, bone development, eggshell quality and amino acid use (NRC, 1994).
M ogin (1980; 1981) studied the basic role of cation-anion balance for chickens and pigs and concluded that the electrolyte equilibrium could be described by a formula including the main electrolytes. The abbreviated formula resulted in the so-called electrolytic balance (EB), w hich is the result of the sum of the positive ions (Na and K) minus the sum of the negative ions (Cl).
According to M urakami (2000), an EB betw een 150 and 350 mEq/kg is recommended in commercial diets for maximum bird performance. Leeson & Summers (2001) considered 250 mEq/kg as an appropriate level for adequate poultry development.
Hooge & Cummings (1995) stated that the NRC (1994) K dietary requirements for grow ing poultry w ere considerably low er than the levels typically present in commercial diets. No increases in K requirements w ere indicated w hen environmental temperature, w ater intake, or stress conditions are increased and neither because. The authors also noted that, due to the lack of published research in refereed journals, many of the K requirements w ere estimated and presented in italics.
w hich indicat es approxim at ely a 1:1 Na:K rat io as optimal and w ith EB around 242 mEq/kg (Hurw itz et al., 1973 cited by Hooge & Cummings, 1995). Thus, this information suggested that the K requirement for maximum BWG could be higher than the 0.30% level recommended by NRC (1994). Rostagno et al. (2000) suggest ed t hat 0.501, 0.471 and 0.454% K w ere adequate for EB in the periods from 1 to 21, 22 to 42 and 43 to 49 d, respectively.
It is still unclear how K supplementation improves BW, but it has been show n that diets w ith high levels o f lysin e HCL an d ar g in in e HCL m ig h t n eed K supplementation as acetate or carbonate to minimize the antagonism betw een these ions on metabolism (O’Dell & Savage, 1957, O’Dell et al., 1962; Nesheim et al., 1964; Savage, 1972). K salts w ere also show n t o inf luence lysine cat abolism , result ing on low er lysine:arginine ratio (Scott & Austic, 1978). The protein synthesis and BWG reduced tissue lysine concentration. A possible explanation could be a reduced arginase activity in the kidneys and low er urease activity in the intestines (microbial source). The arginine catabolism w ould be then reduced and this amino acid w ould become more available for protein synthesis (Stutz et al., 1972).
Young (1995), in personal communication to Hooge & Cum m ings (1995), st at ed t hat K levels in som e ingredients w ere found to be considerably low er than expected compared w ith standard table values, w hich w ould alt er K levels and diet ary EB calculat ed by formulas.
Therefore, it is necessary to evaluate the effects of K levels on broiler chickens performance in order to est ab lish t h e r eq u ir em en t s t o d et er m in e a recommendation for maximum BWG and to evaluate the need of diet supplementation.
MATERIALS AND METHODS
Three experiments w ere conducted in a metabolism room, each one corresponding to the periods from 8 to 21, 22 to 42 and 43 to 53 days of age. In the first experiment, 288 Ross male chicks w ith initial average w eight of 0.148 kg w ere reared from 8 to 21 days of ag e in a co m p let ed ran d o m ized d esig n w it h six treatments (K levels) and six replicates, w ith eight birds p er exp erim en t al u n it . In t h e seco n d an d t h ird experiments, 240 and 192 Ross male broiler chickens w ith initial average w eight of 0.768 kg and 2.295 kg, respectively, w ere reared from 22 to 42 and 43 to 53 days of age in a completed randomized design w ith
six treatments (K levels) and eight replicates of five and four birds per experimental unit, respectively. In the three experiments, K levels of 0.30, 0.44, 0.58, 0.72, 0.86 and 1.00% K w ere used.
The birds w ere housed in metabolism cages, grouped in batteries that corresponded to the experimental units. The diets for each replicate w ere kept in individual buckets and feed and w ater intakes w ere recorded. Birds w ere reared under conventional conditions until the initial day of each experiment. Diets w ere formulated according to the age and the nutritional requirements reported by Rostagno et al. (2000).
In all experiments, treatments consisted of a basal diet formulated to fulfil nutritional requirements for all nutrients except for potassium, according to age, based on levels recommended by Rostagno et al. (2000). It w as necessary to replace the w ashed soybean meal for other ingredients w ith smaller K content in order to formulate the basal diet deficient in K. The composition of the basal diets used in each experiment are show n in Table 1. W ashed soybean meal, used as prot ein so u rce, w as o b t ain ed af t er t h ree w ash es o f t h e soybean meal w ith acid solution adjusted to pH 4.6 w ith hydrochloric acid (HCl), follow ed by tw o w ashes w ith distilled w ater, drying in stove at 55oC for 24 hours and grinding. The final product contained 90% DM , 5 6 % CP an d 0 .7 0 % K. Th is p ro ced u re w as an adaptation of the technique used in the 50’s and 60’s to produce isolated soybean protein and it results in partial loss of K during the w ashing steps (Supple & Combs, 1959; Leach et al., 1959). Then, increasing levels of K w ere obtained by replacing w ashed sand f o r p o t assiu m carb o n at e (K2CO3) (5 6 .5 % o f K). Laboratory analyses w ere performed to determine K levels in the experimental diets, w hich w ere compared w ith calculated values.
The diet from each experimental unit w as w eighed at the beginning and the end of each experiment, and dat a w ere correct ed f or m ort alit y. The birds w ere individually w eighed at the beginning and the end of each experiment. These data w ere used to obtain feed in t ak e (FI), b o d y w eig h t g ain (BW G) an d f eed conversion rat e (FCR) The maximum and minimum temperatures w ere daily recorded and the means are show n in Table 2.
The observed requirement levels w ere 57% and 109% higher than the K levels of 0.40 and 0.30% recommended by NRC (1984 and 1994, respectively). One of the possible reasons for such difference is that t h e levels r eco m m en d ed b y NRC (1 9 9 4 ) w er e det erm ined using birds Vant ress x W hit e Plym out h Rock (Leach et al., 1959), w hich have smaller grow t h pot ent ial t han t he st rain used in t he present st udy, m ainly in m uscle m ass. Anot her reason could be
RESULTS AND DISCUSSION
The results obtained for the performance parameters in each experiment are given in Table 3. A quadratic effect on BWG and on FI w as observed in the period f rom 8 t o 21 d. The est imat ed requirement s w ere 0.628% of K for BWG and 0.640% of K for FI (Table 4). There w as no significant effect of K level on FCR.
Table 1 - Composition of basal diets according to age.
Ingredient 8 to 21 d 22 to 42 d 43 to 53 d
Corn, meal % 58.500 63.000 66.730
WSM1, % 13.500 14.083 11.734
Gluten meal (60% CP), % 10.950 9.972 8.054
St arch, % 3.974 2.792 4.000
M eat meal, % 5.660 1.790 2.000
Limest one, % 0.188 0.016 0.652
Dicalcium phosphate, % 0.050 2.190 0.824
Soybean oil, % 1.000 1.000 1.653
DL-M et , % 0.171 0.145 0.123
L-Lys HCl, % 0.632 0.567 0.527
L-Arg, % 0.217 0.300 0.226
L-Thr, % 0.070 0.060 0.012
L-Trp, % 0.066 0.042 0.048
Choline Chlorine 60% , % 0.100 0.100 0.100
Salt , % 0.394 0.300 0.381
Vit amin/mineral and
additive mix* , % 0.238 0.238 0.238
Washed sand, % 4.290 3.405 2.698
Total 100.000 100.000 100.000
Calculated nutrient composition
M E (kcal M E/kg) 3.096 3.102 3.200
CP (% ) 21.605 20.000 18.000
Lys (% ) 1.263 1.156 1.050
M et (% ) 0.542 0.494 0.437
M et + cys 0.897 0.825 0.742
Trp (% ) 0.230 0.202 0.190
Thr (% ) 0.798 0.747 0.634
Arg (% ) 1.290 1.265 1.101
Gly+ser, % 2.093 1.804 1.642
Calcium, % 0.960 0.874 0.800
Total P( % ) 0.632 0.797 0.544
Available P (% ) 0.450 0.609 0.365
Potassium (% ) 0.305 0.306 0.300
Analyzed potassium, % 0.334 0.315 0.320
Sodium (% ) 0.222 0.192 0.192
Chlorine (% ) 0.305 0.277 0.278
EB (mEq/kg)2 88.53 83.64 81.82
* Vitamin, mineral and additive levels provided per ton of feed: vit A 10,000,000 IU, vit D3 2,000,000 IU, vit E 30,000 IU, vit K3 3,000 mg, vit B1 2,000 mg, vit B2 6,000 mg, vit B6 4,000 mg, vit B12 15,000 mcg,
nicot inic acid 50,000 mg, pant ot henic acid 12,000 mg, biot in 100 mg, folic acid 1,000 mg, selenium 250 mg, manganese 160,000 mg, Iron 100,000 mg, zinc 100,000 mg, copper 20,000 mg, cobalt 2,000 mg, iodine 2,000 mg, vehicle for 1,000 g.1 - Washed soybean meal: 90% DM , 56% CP and 0.70% K.2 - Electrolytic balance: [Na]+[K] – [Cl].
Table 2 - Maximum and minimum mean temperatures (oC) in
each trial.
Age (days) Maximum Minimum Mean
8 to 21 25.00 17.31 21.16
22 to 42 27.11 21.32 24.21
43 to 53 27.22 19.11 23.17
Table 3 - Effect of potassium levels on bird performance at 8-21, 22-42 and 43-53 d.
Potassium Feed Body weight Feed conversion
levels (%) intake (g) gain (g) ratio
8 to 21 d
0.30 883 616 1.432
0.44 926 639 1.451
0.58 933 646 1.445
0.72 932 650 1.435
0.86 917 634 1.448
1.00 879 604 1.457
M ean 911 631 1.445
Regression Q Q NS
CV (% ) 3.42 4.02 3.36
22 to 42 d
0.30 2,622 1,467 1.791
0.44 2,751 1,575 1.749
0.58 2,843 1,625 1.749
0.72 2,861 1,626 1.802
0.86 2,962 1,646 1.800
1.00 2,791 1,553 1.799
M ean 2,805 1,582 1.782
Regression Q Q NS
CV (% ) 3.46 4.08 3.94
43 to 53 d
0.30 1,293 539 2.421
0.44 1,316 615 2.153
0.58 1,402 599 2.364
0.72 1,457 652 2.257
0.86 1,385 616 2.251
1.00 1,439 627 2.302
M ean 1,383 608 2.293
Regression Q Q NS
CV (% ) 8.16 12.46 8.36
L - linear effect. Q - quadratic effect. NS – not significant.
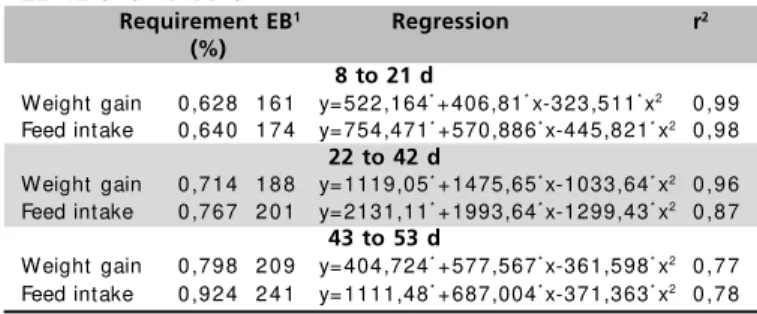
Table 4 - Estimates of potassium requirements and regressions for weight gain and feed intake for broiler chickens from 8-21, 22-42 and 43-53 d.
Requirement EB1 Regression r2
(%)
8 to 21 d
Weight gain 0 ,6 2 8 1 6 1 y= 522,164*+ 406,81*x-323,511*x2 0 ,9 9 Feed intake 0 ,6 4 0 1 7 4 y= 754,471*+ 570,886*x-445,821*x2 0 ,9 8
22 to 42 d
Weight gain 0 ,7 1 4 1 8 8 y= 1119,05*+ 1475,65*x-1033,64*x2 0 ,9 6 Feed intake 0 ,7 6 7 2 0 1 y= 2131,11*+ 1993,64*x-1299,43*x2 0 ,8 7
43 to 53 d
Weight gain 0 ,7 9 8 2 0 9 y= 404,724*+ 577,567*x-361,598*x2 0 ,7 7 Feed intake 0 ,9 2 4 2 4 1 y= 1111,48*+ 687,004*x-371,363*x2 0 ,7 8
at t ribut ed t o t he prot ein level of t he diet s. In t he st udy of Leach et al. (1959), prot ein levels of 25.8 t o 37.9% CP w ere used, w hereas in t he current st udy t he level used in t he init ial phase w as 21.4% of CP, as recom m ended by Rost agno et al. (2000). Nevert heless, t his ef f ect w as not expect ed, since t heoret ically, K requirem ent s w ould increase w it h t he excess of nit rogen (Leach et al., 1959; Sullivan, 1963; Chavez et al., 1979; Aust ic, 1983; Hooge & Cummings, 1995). The levels of 0.628% and 0.640% of K det erm ined in t he present st udy are sim ilar t o t he level of 0.501% recom m ended by Rost agno et al. (2000), alt hough t his level has been suggest ed f or an appropriat e EB. In t he period f rom 22 t o 42 d, a quadrat ic ef f ect w as also observed f or BW G and f or FI (Table 3) and est im at ed levels w ere 0.714% and 0.767% of K, respect ively (Table 4). These values ar e h i g h er t h an t h o se o b t ai n ed i n t h e f i r st experim ent . Such requirem ent increase indicat es t hat m uscle developm ent w as st ill occurring, and m o r e K w as n ecessar y b ecau se o f t h e r elat io n bet w een K and prot ein synt heses. The observed levels w ere 104% and 138% higher t han t hose recom m ended by NRC f or t his phase, i.e., 0.35 and 0.30% of K (NRC, 1984 and 1994, respect ively). Environm ent al t em perat ure w as very close t o t he t hreshold of t herm al com f ort (Table 2), w hich could increase K requirem ent s due t o poorer int est inal blood irrigat ion (Bot t je & Harrison, 1986; W olf enson et al., 1987). As observed in t he f irst experiment , t here w as no signif icant dif f erence f or FCR.
In t he last period, f rom 43 t o 53 d, quadrat ic ef f ect s w ere also o b served f o r BW G an d f o r FI (Table 3). The est im at ed levels w ere 0.798% and 0.924% of K f or BW G and f or FI respect ively (Table 4). These result s conf irm ed t he t endency of increase in t he requirem ent s, t hough less m arkedly, probably due t o t he decrease in t he grow t h rat e. As in t he previous experim ent s, t he requirem ent w as higher (166% ) t han t he recom m endat ion of 0.30 f or t his period (NRC, 1984; 1994). There w as no signif icant dif f erence f or FCR in t he period.
The requirem ent of K f or m axim um BW G w as p r ef er en t i al l y u sed t o d et er m i n e n u t r i t i o n al requirem ent s. The behavior of t he est im at ed values f or t his param et er in t his st udy w as in agreem ent w it h t he curves of body com posit ion f or K observed by Kravis & Kare (1960). They report ed t hat new ly hat ched chicks had low K levels and high Na levels, w hich oscillat ed unt il 12 d of age. Af t erw ards, K levels w er e h ig h an d Na levels w er e lo w , an d
show ed lit t le variat ion. The behavior w as com m on t o alm ost all t issues, but occurred m ainly in m uscles, w here t he cont ent of K at hat ching w as 30 m Eq/ kg, reaching a peak of 110 m Eq/kg at 12 d of age, and w as const ant at about 90 m Eq/kg af t erw ards. These f indings support s t he hypot hesis of decreasing requirem ent s w it h age increase. Conversely, t his w as n o t o b ser ved in t h e p r esen t exp er im en t s; possibly due t o t he EB of t he diet s, t he reduced lif espan of t he m odern broiler or even because t he renal regulat ion syst em w as st ill in developm ent . In any case, t he higher K requirem ent s f or broilers n o w ad ays co u l d b e exp l ai n ed b y t h e l ar g est p o t en t i al o f m u scl e m ass accu m u l at i o n i n com parison t o t he birds used in t he previous st udies. The est im at ed K requirem ent s f or largest BW G w ere used t o calculat e EB values in t he t hree phases (8 t o 21, 22 t o 42 and 43 t o 53 d). The calculat ed EB values w ere 161, 188 and 209 m Eq/kg, respect ively, and are above t he m inim um value (150 m Eq/kg) recom m ended by m ost st udies (M urakam i, 2000). Th i s f i n d i n g evi d en ces a n eed f o r b et t er u n d er st an d in g t h e in vo lved p r o cesses an d t h e individual ef f ect of each elect rolyt e. As t he levels of Na and Cl in t hese experim ent s w ere const ant and in agreem ent w it h t he recom m endat ions f or each phase (Rost agno et al., 2000), it should be considered t hat t he dif f erences observed in t his st udy probably result ed f rom t he int eract ions am ong Na, Cl and K.
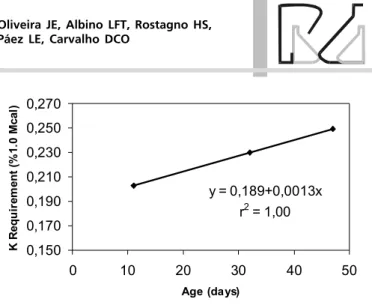
Based on t he requirem ent s est im at ed f or each p h ase, it w as p o ssib le t o est ab lish a p red ict io n equat ion f or K requirem ent s as a f unct ion of age, f or each M cal of M E. The curve and t he equat ion are show n in Figure 1. The equat ion conf irm ed t he increasing t endency of K requirement levels w it h age unt il birds w ere 53 days old. The level of 0.72% K show ed t he best BW G in t he t hree periods. Furt her st udies are needed t o conf irm if t he requirem ent s can b e m ain t ain ed o r even d ecreased af t er t h e period of int ense m uscle developm ent .
y = 0,189+0,0013x r2 = 1,00
0,150 0,170 0,190 0,210 0,230 0,250 0,270
0 10 20 30 40 50
Age (days)
K
R
e
q
u
ir
em
en
t
(%
1.
0 M
cal
)
Figure 1 - Estimated potassium requirements for male Ross broilers as a function of age (% for Mcal ME).
REFERENCES
Austic RE. Variation in the potassium needs of chickens selected genetically for variation in blood uric acid concentrations. Poultry Science 1983; 62:365-370.
Bottje WG, Harrison PC. The effect of high ambient temperature and hypercapnia on postprandial intestinal hyperemia in domestic cockerels. Poultry Science 1986; 65:1606-1614.
Chavez E, Kratzer FH. Potassium deficiency in the adult male chicken. Poultry Science 1979; 58(3):652-658.
Hooge DM , Cummings KR. Dietary potassium requirements for poultry explored. Feedstuffs 1995; 67:12-16.
Kravis EM , Kare M R. Changes w ith age in tissue levels of sodium and potassium in the fow l. Poultry Science 1960; 39:13-15.
Leach Jr RM , Dam R, Zeigler RTR, Norris LC. The effect of protein and energy on the potassium requirement of the chick. Journal Nutrition 1959; 68:89-100.
Leeson S, Summers JD. M inerals. In: ______. Nutrition of the chicken. Ghelph, Ca: University Books; 2001. p. 363-377.
M cDow ell LR. Potassium. In: _______. M inerals in animal and human nutrition. San Diego, Ca: Ed. Academic Press; 1992. p. 98-113.
M ogin P. Role of sodium, potassium and chloride in eggshell quality. In: Proceedings of t he Nut rit ion Conf erence of Florida; 1980; Gainesville, FL. p.213-223
M ogin P. Recent advances in diet ary anion-cat ion balance: ap p licat io n s in p o u lt r y. In : Po u lt r y Pr o ceed in g s Nu t r it io n Society;1981; 40:285-294.
M urakam i A E. Balanço elet rolít ico e sua inf luência sobre o desenvolvimento dos ossos de frangos. In: Conferência Apinco de Ciência e Tecnologia Avícolas; 2000; Campinas, SP. Brasil. p. 33-61
Nesheim M C, Leach Jr. RM , Zeigler TR, Serafin JA. Interrelationships betw een dietary levels of sodium, chlorine and potassium. Journal Nutrition 1964; 84:361-366.
NRC - National Research Council. Nutrient requirements of poultry. 8th ed. Washington, DC: National Academic Press; 1984.
NRC - National Research Council. Nutrient requirements of poultry. 9th ed. Washington, DC: National Academic Press; 1994.
O’Dell BL, Savage JE. Potassium, zinc and distillers dried solubles as supplements to a purified diet. Poultry Science 1957; 36:459-460.
O’Dell BL, Limbaugh CL, Savage JE. Arginine-lysine antagonism and deficiencies of casein for the chick. Federation Proceedings 1962; 21:8.
Reece WO. The kidneys. In: Dukes, physiology of domestic animals. 11st ed. M . J. SWENSON and W. O. REECE, ed. Guanabara Koogan,
Rio de Janeiro, Brazil; 1996. p. 521-548
Rinehart KE, Featherston WR, Rogler JC. 1968. Effects of a dietary pot assium def iciency on prot ein synt hesis in t he young chick. Journal Nutrition 1968; 95:627-632.
Rostagno HS, Albino LFT, Donzele JL, Gomes PC, Ferreira AS, Oliveira DC. Lopes. Abelas brasileiras para aves e suínos. Composição de alimentos e exigências nutricionais. Viçosa: Ed. UFV,2000.
Savage JE. Amino acids and mineral int errelat ionships. Poult ry Science 1972; 51:35-43.
Scot t RL, Aust ic RE. Inf luence of diet ary pot assium on lysine metabolism in the chick. Journal Nutrition 1978; 108:137-144.
Stutz M W, Savage JE, O’Dell BL. Cation-anion balance in relation to arginine metabolism in the chick. Journal Nutrition 1972; 102:449-458.
Sullivan TW. Studies on the potassium requirement of turkeys to 4 w eeks of age. Poultry Science 1963; 42:1072-1075.
Supple WC, Combs GF. Studies of the potassium requirement of turkey poults fed purified diets. Poultry Science 1959; 38:833-835.
Universidade Federal de Viçosa. M anual de utilização do programa SAEG (Sistema para Análises Estatísticas e Genéticas). Viçosa (M G): Ed. UFV; 1999.