Definition of Autonomous Teams in plastic injection
industry
Carlos Rafael Teixeira Guilherme
Master thesis
Tutor at FEUP: Prof. Maria Teresa Galvão Dias
“There is no comfort in the growth zone, but there is no growth in the comfort zone” Joakim Kembro, Professor at the University of Lund
Definição de Equipas Autónomas numa indústria de injeção plástica
Resumo
A Eugster/Frismag Portugal, uma empresa fabricante de eletrodomésticos, apresentava variados problemas no seu departamento de injeção plástica. Havia profunda falta de comunicação e alinhamento entre as várias equipas, o tempo médio de mudança de molde era excessivo e a ausência de equipas de suporte em alguns turnos levava a constantes avarias e a uma fraca flexibilidade de produção. Além disso, o bordo de linha e layout desadequados deterioravam a produtividade dos operadores.
Foi criada uma equipa piloto baseada no conceito de equipa autónoma. Esta equipa quebra o paradigma de equipas funcionais ao concentrar na mesma equipa as tarefas que permitem a sua autonomia: manutenção de moldes, mudança e afinação de moldes, controlo de qualidade e embalamento de peças. Ao mesmo tempo, diminui o raio de ação do líder de equipa que fica encarregue de uma equipa mais pequena, conseguindo assim melhorar a sua supervisão e apoio. Com esta equipa, foi feito um workshop de SMED com vista a criar standards na mudança de moldes e a torná-los mais rápidos. Conseguiu-se com este workshop diminuir o tempo de mudança de molde em 25%. Além disso, foram criados standards para as tarefas mais fundamentais da equipa piloto, para normalizar o trabalho e reduzir a sua variabilidade.
Transversalmente a todo o departamento, foram criadas reuniões diárias – Kaizen Diário – nas equipas naturais e entre as mesmas, para melhorar a comunicação e, diariamente, analisar indicadores, planear o trabalho e solucionar problemas de forma focada e organizada. Foi também criado um mizusumashi, responsável por todas as tarefas de logística interna, centralizando num único operador todas as tarefas de transporte de materiais.
Por último, dada a situação de crescimento do departamento, com progressivamente mais máquinas de injeção, uma reorganização do layout foi necessária. Esta reorganização permitiu também concentrar máquinas que produziam peças delicadas num só local. Paralelamente, o bordo de linha foi melhorado e 5s implementados no departamento.
Com o aumento de mudanças de molde por dia, a quantidade por lote de produção diminui, para a equipa piloto, em mais de 30% e flexibilizou-se a produção. Além, o OEE aumentou de 83% para 86%.
Definition of Autonomous Teams in plastic injection industry
Abstract
Eugster/Frismag Portugal, a home-appliances manufacturer, presented several problems at its
plastic injection department. There was a profound lack of communication and alignment between and within teams, setups took a long time and the absence of support teams during some shifts led to constant machine stoppages and poor production flexibility. Additionally, the border of line and the layout were not adequate to the team and worsen the operators’ productivity.
A pilot team was created, based on the concept of autonomous team. This team breaks the functional teams’ paradigm by concentrating in a single team all the tasks that allow its autonomy: mold maintenance, mold changing and fine tuning, quality control and plastic parts packing. At the same time, the span of control of the team leader was reduced, allowing for a closer management, supervision and support of his team.
A SMED workshop was carried with the pilot team, in order to create setup standards and make the mold changing faster. With the workshop, the setup time was reduced by 25%. Besides, standards were also created for all the other fundamental tasks the pilot team must perform, to normalize work and reduce its variability.
Transversally to all the department, regular meetings were created – Daily Kaizen – with the natural teams. This is meant to improve communication and alignment and, at a daily basis, analyze indicators, plan the work and solve problems in a focused, organized manner. It was also created a mizusumashi, intending to concentrate all internal logistics tasks in a single operator.
Lastly, given the continuous growth of the department due to the arrival of more injection machines, a layout reorganization was necessary. This reorganization also allowed the concentration of machines that produced a very delicate part at a single location. Parallelly, the border of line was improved and 5s implemented throughout the department.
With the increase of mold changes per day, the pilot team average production batch quantity decreased in over 30%, increasing production flexibility. Moreover, the OEE increased from 83% to 86%.
Acknowledgments
I would like to thank Kaizen Institute for the opportunity given, particularly to André Pinho Oliveira, Diogo Gomes and Francisco Vasconcelos, for all the support and the guidance given. I thank my tutor at FEUP, Professor Maria Teresa Galvão Dias for the good advice and help. I also thank Eugster/Frismag for the openness to change in the quest for continuous improvement.
Special thanks to all my friends with whom I have shared the best moments of my life during the past five years. The best is yet to come.
Index
1 Introduction ... 1 1.1 Kaizen Institute ... 1 1.2 Eugster/Frismag AG ... 1 1.3 Project Context ... 2 1.4 Project Objectives ... 3 1.5 Methodology ... 3 1.6 Thesis Structure ... 4 2 Theoretical Analysis ... 52.1 Plastic Injection Molding ... 5
2.1.1 The market ... 5
2.1.2 Injection Molding Process ... 5
2.1.3 Plastic Injection Facility – Benchmarking EFP Plastic Injection Department ... 6
2.2 Organizational Structure... 8
2.2.1 Organizational Design... 8
2.2.2 Span of Control ... 9
2.2.3 Typical Organizational Structures ... 11
2.3 Ensuring Team Alignment in Continuous Improvement – Daily Kaizen ... 12
2.4 The 7 Muda ... 14
2.5 Standardization ... 15
2.5.1 Workplace organization – Border of Line and 5S ... 15
2.5.2 Visual Norms and OPLs (One Point Lesson) ... 15
2.6 SMED – Single Minute Exchange of Die ... 16
2.7 Mizusumashi ... 17
3 Initial Situation: Problems and Opportunities ... 18
3.1 Organizational Structure and alignment difficulties ... 18
3.1.1 Injection Team – A wide span of control and inefficient operators ... 19
3.1.2 Mold Maintenance ... 20
3.1.3 Injection Processes – The importance of production flexibility and mold changing 21 3.1.4 The Setup process – Cumbersome and without clear standards ... 21
3.2 Machine Layout and Workplace Organization ... 23
3.3 Indicators ... 25
4 Solutions ... 27
4.1 The new organizational scheme ... 27
4.1.1 Functional teams – Assuring 24/7 mold changing and support ... 28
4.1.2 The Pilot team – proof of concept ... 30
4.2 Workspace Organization – More ergonomic, efficient and organized ... 32
4.3 Daily Kaizen – Aligning teams and improving communication ... 33
4.4 SMED workshop – Decreasing setup time ... 34
4.4.1 The workshop – methodology and opportunities found ... 35
4.4.2 Results ... 36
4.5 Mizusumashi – Concentrating transportation waste ... 37
4.6 Visual norms ... 38
4.7 Layout Redesign – more space, better organization ... 39
4.7.1 Tanks dedicated area ... 39
4.7.2 Future layout ... 40
4.8 Results – Discussion and opportunities to unfold ... 41
4.9 Future steps ... 44
5 Conclusion ... 45
Appendix A: EFP Organizational Structure ... 48
APPENDIX B: DP Organizational Structure ... 49
APPENDIX C: EFP Plant ... 50
APPENDIX D: New DP Organizational Structure ... 51
APPENDIX E: Comparison between plastic injection molding facilities... 52
APPENDIX F: Plastic Injection Department – Initial Situation ... 53
APPENDIX G: Machine Numbering and Type ... 54
APPENDIX H: Machine Layout – Initial Situation ... 55
APPENDIX I: Machine Layout – Current Situation... 56
APPENDIX J: Daily Kaizen – Team Boards ... 57
APPENDIX K: Border of Line – Initial Situation ... 60
Appendix L: Border of line – New Design ... 61
Appendix M: Visual Norm – Mold positioning before and after setup ... 62
APPENDIX N: Visual Norm – Carton Car ... 63
Appendix O: Visual Management – Mizusumashi urgencies update ... 64
Appendix P: Work Instruction for machine 32 ... 65
Appendix Q: Work Instruction for cleaning the hopper... 66
Appendix R: Setup time evolution ... 67
Appendix S: SMED – Initial Situation (with TL in charge of mold changing, before the SMED workshop) ... 68
Appendix T: SMED – Standard Work ... 69
Appendix U: OEE Indicator Evolution ... 71
Appendix V: Batch Size per Production Run Evolution ... 72
Appendix X: Mold changes per Machine Type Evolution ... 73
Appendix Y: Mold Maintenance Operator Standard Work ... 74
Appendix W: Team Leader Standard Work ... 75
Appendix Z – Small Machines Operator Standard Work ... 76
Appendix AA - Mizusumashi Workload Analysis ... 77
APPENDIX AB – Mizusumashi Shadowing Template ... 78
APPENDIX AC – Team Leader Shadowing Template ... 79
Acronyms
DP – Plastic Injection Department EF – Eugster/Frismag
EFP – Eugster/Frismag Portugal KI – Kaizen Institute
Mizu – Mizusumashi
MMO – Mold Maintenance Operator OPL – One-Point Lesson
RMM – Raw Materials Mills Responsible TL – Team Leader
Index of Figures
Figure 1 – Jura Coffee Machine ... 2
Figure 2 Laurastar GO ... 2
Figure 3 Plastic Injection Machine ... 6
Figure 4 Mechanistic approach (left) and Organic approach (right) ... 9
Figure 5 Relationships between a manager and his subordinates ... 10
Figure 6 A correct border of line: 5s applied and materials are in small, easy to reach packages ... 16
Figure 7 SMED methodology ... 17
Figure 8 Typical team leader day: firefighting takes most of his time ... 19
Figure 9 2017 Machine stoppages per reason ... 20
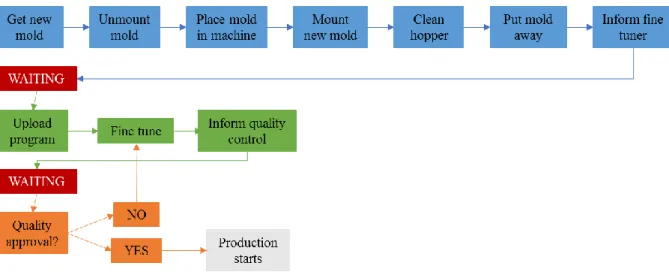
Figure 10 Typical setup process: in blue, the tasks done by the mold mounter, in green by the fine tuner and in orange by the quality controller ... 22
Figure 11 One of the SAN water tanks produced at DP ... 24
Figure 12 Average number of small molds cleaned per week ... 31
Figure 13 Daily Kaizen - Pilot Team (small machines) ... 34
Figure 14 Comparison between fastest and slowest TL in setups ... 35
Figure 15 Setup time evolution per machine type ... 37
Figure 16 Number of mold changes per shift - Small machines ... 41
Figure 17 Number of mold changes per week - Small machines ... 42
Figure 18 Average batch size per mold change per machine type ... 43
Figure 19 OEE evolution per machine time per month ... 43
Figure 20 EFP Organizational Structure ... 48
Figure 21 DP Initial Organizational Structure ... 49
Figure 22 EFP Plant - Basement... 50
Figure 23 EFP Plant - 1st Floor ... 50
Figure 24 New DP Structure: Multidisciplinary Injection Teams ... 51
Figure 25 Injection Department ... 53
Figure 26 Initial machine layout with 46 machines ... 55
Figure 27 Current machine layout with 51 machines ... 56
Figure 28 Daily Kaizen – Raw Materials Warehousing and Mills Team ... 57
Figure 29 Daily Kaizen - Mold Maintenance Team ... 57
Figure 30 Daily Kaizen - Plastic Injection Processes Team ... 57
Figure 31 Daily Kaizen - Planning Team ... 58
Figure 33 Daily Kaizen - Engraving Team ... 58
Figure 34 Daily Kaizen - Tanks Team ... 59
Figure 35 Daily Kaizen – Injection Shift Meeting ... 59
Figure 36 Daily Kaizen – DP daily meeting... 59
Figure 37 Initial Situation - Disorganized workplace, no standardized border of line, quality control far from operator ... 60
Figure 38 New Border of line - All materials close to the operator, more ergonomic workplace, quality control stand in front of operator. ... 61
Figure 39 Visual Norm: mold placement before and after change ... 62
Figure 40 Visual Norm: correct positioning of carton materials near operators ... 63
Figure 41 Visual help: Mizusumashi urgencies update ... 64
Figure 42 Work Instruction: Machine 32 ... 65
Figure 43 Work Instruction: cleaning hopper... 66
Figure 44 Time Writing – The tool used to find the mizu’s difficulties and create a better working standard ... 78
Figure 45 Time Writing - Following TLs is key to understand what they do during their working day ... 79
Index of Tables
Table 1 Tasks per function at the DP ... 19
Table 2 Pros and Cons of team division per machine type ... 27
Table 3 Pros and Cons of team division per ship ... 27
Table 4 Operators' saturation evaluation ... 31
Table 5 Time spent in mold changing activities per shift at small machines ... 42
Table 6 OEE Losses per reason - 2016 vs 04/2017 ... 44
Table 8 Expected future Situation at the DP ... 46
Table 7 Initial Situation at the DP ... 46
Table 9 Number of machines per tonnage in each injection plastic facility analyzed ... 52
Table 10 Characteristics of each plastic injection facility ... 52
Table 11 Comparison between performance indicators of plastic injection facilities ... 52
Table 12 Machine numbering and types at DP. In green, it is represented the new machines (not present at the beginning of the project) ... 54
Table 13 Setup time evolution: The setup time decreased right after week 9 when the SMED workshop occurred ... 67
Table 14 Mold Changing - Situation before SMED workshop ... 68
Table 15 SMED - Standard Work for TL ... 69
Table 16 - Standard work for mold changing with TL and operator ... 70
Table 17 OEE monthly evolution per machine type ... 71
Table 18 Average batch size monthly evolution per machine type ... 72
Table 19 Average mold changes per day per machine tonnage ... 73
Table 20 Work Instruction: Standard Work for the small machines mold maintenance operator ... 74
Table 21 Work Instruction: Standard Work for the small machines Team Leader ... 75
Table 22 Work Instruction: Standard Work for small machines operators ... 76
Table 23 Mizusumashi: time spent per task using a hand pallet truck (min) ... 77
1 Introduction
The paper presented is the result of a project carried out throughout the fifth year of the Integrated Master in Engineering and Industrial Management of the University of Porto. It aims to present the project developed with Kaizen Institute Consulting Group at the company
Eugster/Frismag Portugal (EFP). Although the project reached all departments of EFP, this
paper will focus on the project developed at the plastic injection department, which had the main purpose of improving the efficiency of the department. This was meant to be accomplished by reorganizing the natural teams, standardizing their work and establishing a continuous improvement culture.
1.1 Kaizen Institute
The Kaizen Institute Consulting Group (KI) was established in 1985 in Switzerland by Masaaki Imai and it is an international consulting firm present in over sixty countries. In Portugal, KI was born in 1999 and has offices in Porto and Lisbon and over one hundred employees. Kaizen Institute applies the Kaizen Thinking to help companies achieve “operational excellence through quality improvement in products and services, increase productivity and motivate employees” (Kaizen Institute s.d.).
1.2 Eugster/Frismag AG
Eugster/Frismag (EF) is a Suisse company established in 1978 that manufactures house
appliances. EF mainly produces high-end coffee machines, around five million per year, making it one of the top players in the market. Currently, EF owns three plants in Switzerland, one in Portugal and has a joint venture in China.
EF operates solely as an OEM, that is, as an Original Equipment Manufacturer. That means EF does not sell products under its own brand. EF sells its products to brands such as Nestlé or Koenig which then sell the products to retailers and to final customers under their own brand. EFP employs around nine hundred people. In Portugal, it is produced high-end coffee machines and ironing systems. Figures 1 and 2 present the coffee machine Jura and one of the Laurastar ironing system models, both produced in Portugal.
EFP has two distinct departments, each with an organization of its own, operating at the same plant: an assembly department and a plastic injection department. The plastic injection department (DP) is a direct supplier of parts for the assembly lines, as over 70% of any coffee machine EF manufactures is made of plastic. At the beginning of the project, there were 128 employees at the DP.
The plastic department is physically (see Appendix B and C) and organizationally separated from the assembly department. As it can be seen in Appendix A, EFP follows a functional
structure, where people are grouped according to the tasks they perform and their
responsibilities.
1.3 Project Context
This project was integrated into a comprehensive project that involves all departments of EFP. The main goal is to increase overall productivity as the Portuguese plant is increasing its production and does not have the capacity to grow.
As for the DP, the main problems noted at the beginning of the project were the following: • Unclear work standards. There was a “blame” culture where the different teams blamed
each other for the problems that occurred. There was also a faulty balancing of operations, creating great disparities between the workload of operators;
• Lack of responsibility and commitment to the job. The teams were unmotivated and only did what was “strictly necessary” to keep things running. Employees showed a slow working rhythm and deadlines were not met. This problem was accentuated due to a large span of control (the team leader of the injection team is responsible for 17 people);
• The deficit of communication and cooperation between teams and within teams. The functional organizational structure resulted in each team working in its “own island” and there was barely alignment between teams;
• The absence of a support team during the night shift and on weekends, causing lower productivity during these times;
• High setup times. The lack of standard work in changing and tuning molds led to above average setup times and low production flexibility, increasing the need to subcontract plastic materials that DP was not able to supply to the production lines;
• Indicators not tracked. It was not visible the losses due to rejection machine availability. This meant a lack of accountability for low productivity and a major difficulty in tracking down problems with its root cause;
• Inefficient layout and disorganized workplace. Operators did not have the equipment and materials needed at hand and need to walk constantly around the shop floor to get them;
• High coverage stocks. Since setups times were long, each production batch was quite large and covered too many production days.
Figure 1 – Jura Coffee Machine Figure 2 Laurastar GO
1.4 Project Objectives
The main objectives of the project were the following:
• Increase the OEE (Overall Equipment Efficiency) from 82% to 90% by reducing losses with rejection and machine stoppages;
• Increase production flexibility, by increasing the number of mold changes from 14 to 33 per day;
• Improve workplace organization, the border of line and establish clear work standards to reduce the number of operators needed;
• Redesign layout to accommodate new machines.
At the beginning of the project, it was common to subcontract plastic components because there was not internal capacity to produce them. It is expected that, when the project is over, with the added flexibility and productivity, the need to turn to subcontracting will be lower.
1.5 Methodology
The first weeks of the project were spent analyzing the situation of the DP. With a process-oriented focus, the team spent most of time close to operators, watching how they work and identifying the major issues and losses in productivity. The indicators available were analyzed to get a sense on what were the major concerns to be addressed.
Analyzing the as-is situation, it was noticed that most problems happened due to an inappropriate organizational structure. Thus, the emphasis of the project was to restructure the functional organizational scheme into one that would enhance communication between and within teams, facilitate leadership and increased the department productivity.
Several principles were established, considered vital to attaining the desired goals:
• The teams should be multidisciplinary and capable of solving autonomously their problems;
• Team Leaders should have a smaller span of control;
• Mold problems must be solved 24/7 to avoid large machines stoppage time; • More setups must be performed per day.
After presenting to the administration the several options designed, a new structure, presented in Appendix D, was chosen. The functional division was replaced by a machine type division, where each team is responsible for a smaller number of machines, all similar between themselves (small, medium or large machines). It was also proposed a dedicated team for the 4 injection machines that produce the coffee machine’s tanks: tanks are delicate and require a clean environment. By reorganizing the layout, it was created a space dedicated for these machines, as well as a team that does the tank pre-assemble right off the machine, making it ready for the assembly on the final product.
To implement this new structure, it was first created a pilot team: the “small-machines team”, responsible for the 16 smaller plastic injection machines. This team would then be the model for the other 3 teams to be created once the success of it was proven and the team is working in “smooth sailing”.
The pilot team is multidisciplinary and autonomous, as mold changing and fine tuning were internalized in this team by concentrating these tasks in the team leader of the team. Moreover, this allows for molds to be changed 24/7. Also, a new figure was created: the mold maintenance
operator, integrated into the pilot team, assures mold problems resolution and preventive maintenance 24/7.
In order to establish this team, it was necessary to train employees in this new way of working. The following steps were taken:
• Training program for team leaders, to coach them in change and fine-tune molds and solve issues related to the machines;
• Training problem for mold maintenance operators, in mold preventive maintenance; • Definition of clear standard work, with the creation of visual norms. It was necessary to
follow closely each employee and progressively train them in the new way of thinking; • Improve setups by developing with the team a workshop about SMED and training them
into standardizing the way molds are changed;
• Reorganization of the workspace around the small machines, to improve work conditions and productivity.
In parallel with the creation of this team, other initiatives were taken:
• Following the Kaizen thinking, team meetings – called Daily Kaizen – were created for each natural team (even for those that will cease to exist with the new organizational scheme). With these short meetings, each team working on the shop floor gets aligned, discussing and solving problems, being able to indicators and plan the work;
• Creation of a mizusumashi – a logistic train – to concentrate all internal logistics activities (transport of carton boxes to warehouse, replenishment of materials near operators) and to improve the focus of operators on the tasks that add value;
• Redesign layout to group machines by type (small, medium, large and tanks) to allow each team to be concentrated in a smaller space;
The integration of the tanks’ pre-assembly right off the machine will not be addressed in this thesis, as the main focus is to analyze the creation of the “pilot team”, its pros and cons and the way the creation of small, autonomous teams can impact a plastic injection industry.
1.6 Thesis Structure
The remainder of this document is as follows. In the next chapter, a literature review is performed, presenting the theoretical perspective of the problem and the state of the art in team definition and Kaizen Thinking. It is also presented the distinctive characteristics that shape a plastic injection facility. In Chapter 3, the problem and the initial situation of the company are thoroughly described. Chapter 4 encompasses the description of the solution found and the step by step of its implementation. In the end of this chapter, the results obtained are presented. Finally, Chapter 5 summarizes the key findings of this thesis, suggests further work and discusses the approach to the problem.
2 Theoretical Analysis
2.1 Plastic Injection Molding 2.1.1 The market
Injection molding is the most used manufacturing process to fabricate plastic parts. According to recent reports published by Grand View Research (Grand View Research 2015) and Allied Market Research (Allied Market Research 2016), in 2014 the molded plastic market size held a value of almost 200 billion USD and had a demand of almost 1 million tons. The top used plastic materials are polypropylene (41%), ABS, HDPE and Polyesterine. As for the molded plastic application segment, the top one is packaging (33%), followed by electronics, automotive, construction and medical.
Even though 3D printing – also known as additive manufacturing – has been gaining attention over the last few years, it is still expected for the plastic injection molding market to grow. According to Grand View Research, the market will grow by 4.5% from 2015 to 2022 and, according to Allied Market Research, it will grow by 4.9% between 2015 and 2020.
3D printing brings flexibility, customization and the ability to create highly complex parts. However, with the current technology, it is only cost effective for small batches (Matthew Franchetti 2017). Research on the subject shows that 3D printing is of great advantage for manufacturing rapid prototypes and single units but, from a mass production perspective, injection molding allows to produce more quantity, in a shorter time and with lower costs.
2.1.2 Injection Molding Process
Injection molding machines are hydraulic, mechanic or electric machines which vary in size and complexity. In a broad sense, an injection machine has two main parts: a clamping unit and an injection unit (see figure 3).
Usually, injection molding machines are rated according to the maximum amount of clamping force they can produce: smaller machines might produce clamping forces of only a few tons while larger ones can have clamping forces of over 1000 tons. The required clamping force depends upon (IcoMold s.d.):
• the material used and its viscosity. The greater the viscosity, the more difficult it is to flow and greater injection pressures are needed;
• The projected area of the part. A greater area means a greater need for clamping force; • The depth of the part. With more depth, more force is needed.
The injection process is very short, usually, bellow 2 minutes, and it is as follows (Custompart.net s.d.):
• Before the injection takes place, the two halves of the mold are closed by the clamping unit. One-half of the mold is fixed to the machine while the other can slide. The clamping unit must exert enough force to keep the mold closed while the material is injected and cools down;
• When the mold is securely closed, the raw plastic material, in the form of pellets, is melted by the injection unit with heat and pressure. When it is melted, it is rapidly injected into the mold, building a lot of pressure (hence the need for the clamping unit to have enough force to keep the mold together);
• As soon as the molten plastic is in contact with the interior mold surfaces, it begins to cool down. The mold can only be open once the cooling time has passed;
• At the end of the cycle, the mold opens and an ejection mechanism ejects the part. This is usually not, however, the end of the process. It is normal to have rework done on the parts once they are ejected. When cooled, some plastic solidifies in the channels of the mold – the sprues – and must be separated from the part, either mechanically or manually by an operator. Also, it is normal to find flash along the part produced, which has to be trimmed, usually manually using cutters.
2.1.3 Plastic Injection Facility – Benchmarking EFP Plastic Injection Department
In discrete production assembly lines, each operator performs a specific task at a specific place along a production line, adding something to the final product. As for plastic injection molding, a “traditional” facility like the one analyzed throughout this project has as main character the plastic injection machine. At these facilities, operators are usually responsible for quality control of the plastic parts, for any rework needed (cutting the flash, separating the sprues from the parts) and for packing the plastic parts into carton boxes or alike. Operators usually perform these tasks at several injection machines at once, since the operator cycle time is quite shorter than the machine cycle time. There can also be small assembly lines right in front of the machines, assembling the pieces right away at their final product. Moreover, molds must be changed quite often – depending on the flexibility production needs – which makes mold changing and fine-tuning a key activity.
Then, there are several support activities: machine maintenance, mold maintenance, production planning, raw materials warehousing.
Since this is a very specific kind of production facility, there is not much research done on the subject, but there are industry best practices that one can learn from. Kaizen Institute has done several projects at plastic injection molding facilities, and a comparison between these facilities was made under certain criteria1:
• The number of injection machines per tonnage. The tonnage is used to evaluate the complexity of setups since larger machines require bigger, more complex molds that are more difficult to handle and to mount and to fine-tune;
• Types of raw materials used. This criterion is only addressed if a company produces plastic parts in sensitive materials, which tend to increase rejection and lower efficiency; • Number of operators;
• The number of teams and team leaders. To capture the size of each team, the span of control and how many machines each team is responsible for;
The following indicators were then evaluated for 8 different production sites: • Average setup times per machine tonnage;
• OEE per machine tonnage, calculated as:
OEE = (GP/TTP) * 100 (2.2) Where:
OEE is overall equipment efficiency GP is the number of good parts produced
TTP is the total amount of parts that could be produced
So, a comparison between EFP and 5 different production sites was performed: • Company A and B both produce large plastic auto parts ;
• Company C produces toilet plastic parts (cisterns, tubing); • Company D produces auto parts and electrical safety devices;
• Company E produces audio parts and auto parts (dashboards and displays).
The table 7, in Appendix E, presents the number of injection machines per tonnage in each facility. This gives a sense of the size of the site and variety of part sizes produced. For company D this data was not found.
The table 8, also in Appendix E, presents a comparison between the characteristics of each company. EFP is the company with the highest number of operators. Oddly, it is also the one with the fewest team leaders: Only 1 for 18 people, a span of control of over 3 times any other company, which means the team leader has to divide his time training and supervising more people. Also, during this analysis, it was found that the number of machines per operator and per team is highly variable. While in company C one operator can be responsible for 15 machines, in company E there are machines that have operators dedicated to only 1 machine. This is due to the variation of the operator saturation. Therefore, the number of machines one operator can work simultaneously at any given time depends on:
• The machine cycle time – what is the rate that the machine delivers a new piece; • The operator cycle time – how much time does the operator spend per piece, doing
whatever operations he needs to do (quality control, rework, assembly, packing).
Usually, the operator cycle time is lower than the machine cycle time, allowing him to work on multiple machines. However, in cases where, for example, parts are assembled at the machine, it may be needed to have dedicated operators to machines. This is what happens in company E. Moreover, there are other factors to be accounted for:
• The fragility of the parts produced – it is easily scratched, for example, the operator must use gloves, sometimes has to clean the part and it takes longer to do quality control and to pack;
• The layout – if machines are to spread apart, the operator must walk a lot between machines. This means more wasted time walking around the plant and not adding value; • Automation – In factory C, there are small devices at the exit of the injection machines that separates pieces from sprues. This eliminates one important task of the operator, reducing the operator cycle time and allowing him to work on more machines.
Finally, in the table 9 in the Appendix E, the setup time and OEE between the 5 facilities is compared. As for setup time, there is immense variability: factory C, A and B have clearly optimized the mold changing process and do it very efficiently. In factory C, for example, operators are able to do several tasks in the setup, helping the mold changer. Also, small improvements in the machines and molds, to allow faster setups, were made. In companies D and E, the material also impacts the changing time: with more frail materials, that require strict quality parameters, fine tuning takes longer. As for EFP, this process is slower and only 3 machines produce parts with delicate materials, which comes to show that there is a huge opportunity for improvement.
As for OEE, companies A and B take the lead. For company C performance losses are not available and for company D this was not measured. Company E has the lowest OEE, mainly because of the lenses that are produced there: again, with stricter quality parameters, such as transparent displays for cars, the rejection is higher, machines stop more often and setups take longer. EFP also shows room for improvement.
2.2 Organizational Structure
There is not one ideal organizational structure, as it depends on the organization, the culture and the goals ambitioned. Whereas the right organizational design contributes greatly to the effectiveness of the organization, a poor design will lead to poor performance and unmotivated employees. To understand the pros and cons of the different components of an organizational structure and how to relate them with EFP, it is necessary to review some fundamental concepts.
2.2.1 Organizational Design
Organizational design is defined as “the process by which managers select and manage aspects of structure and culture so that an organization can control the activities necessary to achieve its goals” (Jones 2010). In designing an organizational structure, two problems are addressed: the division of a big task into small tasks and the coordination of these small tasks so they effectively work together towards the bigger goal (Jones 2010).
There are two major design approaches, opposed to each other:
• Mechanistic structure – Usually preferred for predictable, stable environments due to its lack of flexibility and formalization. There is a formalized hierarchy, with centralized decision making. The structure is tall with well-defined rules and standardized tasks (Azevedo 2016).
• Organic structure – Suits best volatile environments, where flexibility is needed to adapt to ever-changing conditions. Decision making is decentralized and the structure is flatter. There is less specialization, standardization and formalization (Azevedo 2016).
The hierarchization of an organization starts when there is a need for control and coordination. One of the first steps in creating a structured hierarchy is the differentiation. This is “the process by which an organization allocates people and resources to organizational tasks” (Jones 2010). There are two types of differentiation (Azevedo 2016):
• Vertical differentiation – The way a hierarchy of authority is created, setting the different levels of the organization and the chain of command;
• Horizontal differentiation – The way the organization groups tasks into roles and subunits. This kind of differentiation is based on the specialization given to employees and their tasks.
The creation of a hierarchy will need a balance between principles of a mechanistic and organic structure type, leading to the challenges of balancing:
• Differentiation and integration;
• Decision centralization and decentralization; • Standardization and mutual adjustment.
Furthermore, other questions are raised regarding the right organizational structure for the company at hand:
• What is the correct span of control?
• How formalized does communication need to be? • How should employees be grouped?
2.2.2 Span of Control
The span of control is defined by the number of employees that are managed by a manager. This has been and still is an issue when designing organizations since there are two opposing forces coming to play:
• The more employees a manager has to managed, the more difficult it will be to lead and control his employees;
• The more managers a company has, the more expensive it will be for the company and the harder it is to keep all aligned and productivy. Also, there is a risk of employees being overloaded with supervision (managers become “micro-managers”).
One of the first articles wrote on the subject was published in 1956 in the Harvard Business Review, by Lyndall F. Urwick. (Urwick 1956). Lyndall analyzes group relationships: he argues that when increasing the number of employees a manager handles, not only the direct
relationship between employee and manager must be accounted for, but also the relationships between employees. This means there is an exponential complexity added by the addition of each new subordinate (see figure 5).
Even though most of these parallel relations will hardly ever need attention, having 4 subordinates, for example, means having 44 relations to handle, whereas having 5 subordinates brings this number up to 100 – this is a burden that Lyndall thinks cannot be denied. So, Lydall states that “no superior can supervise directly the work of more than five or six
subordinates whose works interlocks” (Urwick 1956). The cost of having a span of control
too large would be a lack of leadership, poor communication and indecisiveness, leading to unmotivated and unproductive employees.
He did, however, recognized that this is not an immutable rule and that “the smaller the responsibility of the group member the larger may be the group” (Urwick 1956), that is, if subordinates have very standard, repeatable and small tasks, the span of control may be larger. Lydall also exposes, in a surprisingly up-to-date way, why span of control is so many times ignored:
• It is a symbol of status to report directly to higher levels instead to middle managers; • There is a cost-conscious attitude towards having more managers for the same number
of employees;
• It is common to find higher level managers proud of their “efficient executive” and refuse to delegate power.
In 1981, Robert D. Dewar studied several companies to find the impact of 3 different variables – size, routines and number of different specialties – for the definition of the ideal span of control for each hierarchical level of the company (Dewar 1981). Dewar considers that the span of control should be variable along the hierarchy and cannot be generalized since skills and tasks are different for different levels.
The paper shows that the number of different specialties has a significant effect on all levels: at executive level leads to larger spans but spans are lower at middle levels. The interpretation is that specialized employees at lower levels need to be supervised by superiors of “their own kind”.
As for size, it only impacts the middle levels, making the span of control larger, but not the first line managers. The degree of routineness showed no effect on the span of control. This study did not, however, considered factors such as tradition, union agreements and other factors that may influence the results.
Another study, also done in 1981, analyzed the impact of the company size and technology (small batch/large batch/continuous process) on 50 Japanese companies. It was found that size had a greater impact on structural differentiation and formalization but technology had the largest impact on the span of control (Robert M. Marsh 1981).
It was found that size increases the span of control since larger companies have more subordinates grouped together, decreasing the need for supervisors. Moreover, as size increases, it is possible to routinize tasks and increase formalization, which also contributes for a larger span of control (Robert M. Marsh 1981). As for technology, the more complex the work and the technology employed, the lower the span of control, since supervision is more time to consume (Robert M. Marsh 1981).
There is not, however, a definite answer on what the right span of control. Early studies showed it should be around 5-8 people, but arguably this may vary depending on cultural factors, industry, the size of the company, technological advances and the skills of the employees.
Span of Control as a Queuing Problem
Supervision can be looked at as a queuing problem, where the supervisor gives a service to all employees under his supervision. In a study by Yuval Cohen, it is presented how to evaluate the right assembly line segmentation. One of the factors to determine this is the span of control since it limits the number of stations or sections one foreman can supervise (Cohen 2013). Accordingly, when increasing the number of subordinates, a manager must spread his time between more employees, having less time for each. On the other hand, more employees will mean more requests to handle – assuming the number of requests per subordinate will have the same distribution whatever a number of employees there is. Thus, in order to evaluate the span of control needed, it would be necessary to evaluate the average event duration (how much time the supervisor spends solving each problem, on average) and the overall demand for managerial attention.
2.2.3 Typical Organizational Structures
There are a few typical organizational structures. It is not possible to tell which one is better: each is adequate to a certain type of organization and its strategic objectives.
A functional structure “is a design that groups people based on their common skills, expertise or resources they use” (Jones 2010). This kind of people grouping presents several advantages: • People become more specialized and productive, learning within the team and creating
their own norms and culture;
• Supervision is facilitated (supervisors are specialists in same areas as subordinates); However, the functional structure usually presents several handicaps, especially for more complex companies: large companies that operate in multiple markets or have very distinct products or business process. In such situations, a functional structure might become a struggle. With functional teams, each with their own hierarchy and paradigms, they tend to distance between one another as a company becomes larger. This creates a communication and alignment issue hard to solve (Azevedo 2016).
One common example of this is the difficulty of maintaining two separate departments – sales and marketing – working together efficiently. The most intuitive way of solving this drawback is promoting the integration of functions, combining both departments in one (Jones 2010). Hence, for more complex structures, companies usually move to divisional structures. In this structure, people and tasks are grouped to form smaller subunits, turning each subunit into a
“profit center”. These subunits may be product-based, geographic-based or process-based, depending on the problem to be solved.
For example, a product-based structure has the advantage of keeping managers focused on their product and customers and leads to greater division effectiveness. Nevertheless, it may account for a loss of focus on the company overall goals and strategy, making it hard to coordinate all divisions (that can even start competing for resources). Moreover, functions are duplicated along the structure: there are various sales teams and production teams, each for each product (Azevedo 2016).
It is also worth mentioning the matrix structure. In a matrix structure, people are organized simultaneously by function and product. Thus, each employee reports directly to two superiors: a product team manager and a functional manager. This structure has the advantage of creating cross-functional teams, reducing functional barriers and subunit orientation (problems with functional and divisional structures, respectively). It also promotes flexibility in using skilled professionals, moving them from product to product as needed. However, the lack of a well-defined hierarchy can result in conflicts between teams over the use of resources and in defective leadership and structural stability (Azevedo 2016).
2.3 Ensuring Team Alignment in Continuous Improvement – Daily Kaizen
Teamwork may become a problem in organizations if communication is faulty within the team. It is fundamental to keep everyone – from the director to the operators – on the same page and aware of what are the objectives to accomplish.
On the other hand, although many continuous improvement projects based on employees are started, the failure rate is high. This is due mainly to the “lack of understanding of the behavioral dimension” (John Bessant 2001). Consequently, continuous improvement is an evolution that has as key the institution of behavioral routines within the firm (John Bessant 2001)
Kaizen Institute champions that natural teams – that is, the teams that work together every day at the same area and performing tasks for the same goal – should hold regular, short, focused meetings. These are called Daily Kaizen. The Daily Kaizen has the objective of giving autonomy to natural teams to solve their own problems and plan their daily work. Moreover, it constitutes the cornerstone of a culture of continuous improvement, not only because it promotes the continual improvement of working standards, but also contributes for the team to disruptively think of new ways of doing things.
At a Daily Kaizen meeting, the natural team gathers around a board for a short period – 5 to 15 minutes – and follows a standardized agenda, specifically made for that team, that should cover the following topics:
Presence checklist
At the beginning of the meeting, the Team Leader should check if every team member is present.
Indicators update and analysis
There is a well-known saying: “you cannot improve what you do not control and you cannot control what you do not measure”. The team should then keep regular track of the most relevant indicators (4 or 5 at most, to keep meetings focused) and understand its impact on the organization. Kaizen Institute has done projects in several companies that did not do this. In one metal wire company, is was not measured the service level. Once the company started measuring the number of on-time deliveries, it found that almost 40% of all deliveries were
either late or failed. In two weeks, this percentage was reduced to under 20%, just because the team now understood what the problem was and could draw solutions for it.
Only by having SMART objectives (Specific, Measurable, Achievable, Relevant and Time-bounded) and indicators that correctly represents them, the team can work its way up to achieve operational excellence. Therefore, if an indicator reveals that a target is not being met, the situation must be analyzed to find the causes of it and a corrective action must be drawn. Also, indicators must be volatile from meeting to meeting (it is pointless using a yearly indicator in a daily meeting, for example).
Visual work planning
The work for the next shift/day/week should be organized with the team at the meeting. Everyone must know what they are in charge for during the next hours and days. A visual work plan, with tasks assigned to people, should be present at the board. This has the advantage of making work imbalances visible: is there workers with too much to handle? Can the team fulfill everything it has to do, or should it ask for help? What are the main tasks and the less important and urgent ones to do? What issues may the team expect to happen?
Deming cycle - PDCA
When analyzing indicators and planning the work, opportunities for improvement will appear. The Deming cycle, also called PDCA (Plan-Do-Check-Act), is an iterative four-step method to support the implementation of improvements. At the meeting – or even outside of it – actions to improve the team performance should be placed by the team members on the board, to be on display for everyone and not get forgotten. An action should be filled into a card which has:
• A short description of the problem;
• A short description of the action to correct it;
• The date when the problem appeared and the dates planned for the action start and end. These actions must be short, well defined and should not have a planned duration of over 1 month. Otherwise, it will get neglected and will not be completed;
• The name of the responsible for the action. The responsible can be from outside of the team if the team is not able to perform the task by itself.
Once an action is established, it will follow these steps, according to with the PDCA method: • Once the action is validated by the team, it is placed on the “Plan” column;
• When the action starts getting done, it is moved to the “Do” column;
• After the end of it, the results from the action must be checked, to evaluate the benefit of it on the performance of the team. Thus, it is placed in the “Check” column;
• After it gets checked, the action is placed at the “Act” column. If the action was successful, it ends. Otherwise, the team should come up with a new action, based on the experience learned with the last one, to try and succeed this second time.
Other elements
When in need, the Daily Kaizen board can have further elements, supporting team meetings. Some examples may be:
• Competences matrix – To detect needed skills of team members in certain topics and support a training program;
• Training program – With a plan of what training will be received by each team member and when;
• Free communication area – To place norms, shift reports, photos of good practices.
2.4 The 7 Muda
Muda is the Japanese word for wastefulness and the 7 Muda model was created by Taiichi Ohno and Shigeo Shingo to explain the different causes of the waste found in organizations (Imai 2012). Everything that does not add value to the final customers is considered waste, as it does not increase the value of the product, only its cost. The 7 Muda are the following:
Overproduction
This is the worst Muda since it creates all the other ones: producing too much too early will lead to excessive inventory, higher lead times and unnecessary use of resources.
Transportation
Moving the product from one place to another does not transform the product, so no value is added. However, transportation adds up costs in an organization: resources employed, investments needed, area used for corridors and higher lead time to deliver goods.
Inventory
Inventory, be it raw materials, work-in-process or finished goods, comprises invested capital that is yet to produce any income. This means space is being occupied and resources employed to produce something that is not needed yet. Also, with a lot of stock to absorb variability, problems and inefficiencies in the supply chain are hidden.
Motion
Operators should have everything they need to perform their job close to them. Every movement a person does that does not transform the product, does not add value and thus deteriorates productivity. There must be a right layout design, sequence of tasks and placement of tools and materials to ensure productivity and ergonomics.
Waiting
If an operator is waiting for a machine to complete its cycle, for material to arrive to him or for another operator to finish his task, he is not adding value. This is a common problem in production lines that are not well balanced.
Over-processing
If a product is more complex, has more features and tighter tolerances than what the customer wants, it over processed. An example of over processing is having processes that are not standardized in which operators spend too much time focusing on small details that the customer does not care about instead of adding real value.
Rework
Whenever a product has a defect, rework must be done. This comes with great costs for an organization: scrap material, need for resources and time to produce new parts, having people correcting defects. Every rework is a waste so conditions to get it right at first try should be met.
2.5 Standardization
Standardizing work consists of establishing a set of norms and tools by which employees are directed to performing a task in a specific, well-defined way. It can be applied in any area of an organization and has the following objectives (Imai 2012):
• Clarifies best practices and share them among employees; • Create alignment within the organization and labor discipline; • Creates a way to simplify, measure and improve working methods;
• Reduce variability (one way of working) and waste (the best way known of working). Standardization is nowadays often viewed as an impediment to innovation. However, it has been shown that even in the most innovative businesses, well-defined standards support employees’ daily activities. Management consultants, for instance, are perceived as “change agents” who defy existing norms and lead organization innovation. Surprisingly, consulting firms have embraced standard agendas and methods (Christopher Wright 2011). These standards support knowledge sharing, the processes followed when engaging with clients and communication between consultants.
2.5.1 Workplace organization – Border of Line and 5S
The workplace can also be the object of a standardization process. 5s is a workplace organization tool with the following 5 steps (each begins with the letter “s” in Japanese, hence the name):
• Seiri (Sort) – The first step is to eliminate what is not necessary from the workplace. This reduces the time spent looking for objects;
• Seiton (Set in Order) – “Each thing in its place, each place for its thing”. Every material must be placed in a well-defined and identified location;
• Seiso (Shine) – Cleaning and tidying the working area on a daily basis makes problems visible and prevents equipment deterioration;
• Seiketsu (Standardize) – A standard with best practices on how a workplace should be kept must be created, in order to maintain it;
• Shitsuke (Sustain) – Everyone in the organization must have the discipline to keep the workplace clean and organized without the need of supervision.
Usually, the first object of 5s is the border of the line, since this is where the value is added. The border of the line should be designed in a way that minimizes the motion Muda and facilitates the usage of the materials needed to do the operation. Also, when it is possible, materials should be provided inside small containers, place at the operator’s reach in from of him (see figure 6).
2.5.2 Visual Norms and OPLs (One Point Lesson)
To establish a standard procedure, people must be trained in doing a task in a certain way. To ensure a standard is well established after the training is complete, a norm should be kept and easily available for the worker. The norm must be brief, simple, and visual. There are two types of norms (Vanessa Prajová 2016):
• Management standards – for example, administrative regulations; • Operational standards – which standardize the way employees work.
A common way of presenting an operational norm is the OPL: One Point Lesson. An OPL presents a specific task in short bullet points along with explanatory images of the process. It should be only 1 page long and be kept at the workplace, to be rapidly consulted by the worker whenever needed.
2.6 SMED – Single Minute Exchange of Die
Changing production series, be it in a machine or a production line, encompasses a period of production stoppage. On top of that, it is common to have productivity losses before the machine stops and after it starts again – be it speed loss or rejection due to quality issues. The setup time can be defined as the time passed between the last good unit produced from batch A and the first good part produced from batch B, at the required efficiency.
SMED is an analysis and improvement methodology to reduce time lost in production series changes (Imai 2012). The reduction of unproductive time presents two large benefits for companies:
• Production flexibility by allowing cheaper, shorter series. This leads to stock reduction and smaller lead times;
• Higher machine real capacity. With shorter setup times, production throughputs can be larger, reducing the need to invest in more machines and reducing production costs. A SMED approach comprehends a 5 steps method, as presented by Masaaki Imai (Imai 2012). In figure 7 these steps are further explained:
1. Work study at the Gemba (shop floor);
2. Separate internal from external work. Internal work includes tasks that can only occur with the machine stopped while external work can be done with a running machine; 3. Convert internal into external work;
4. Reduce internal work; 5. Reduce external work.
Figure 6 A correct border of line: 5s applied and materials are in small, easy to reach packages
2.7 Mizusumashi
Mizusumashi – a logistics train or a mizu for short – is the operator responsible for all internal
logistics operations:
• Replenishment of all components and materials at the point-of-use;
• Pickup of finished goods, empty carton boxes and other materials from the border of line;
• Transportation of all information needed and production orders.
A mizu intends to standardize the internal logistics processes. The common paradigm is to use a forklift that works like a “taxi” (it is called when it is needed) or even having operators getting the materials they need (which presents a huge productivity waste because operators have to leave their working station). On the contrary, a mizu has a standardized route and cycle time, working like a train. A transportation system that is not standardized will lead to higher working variability and lack of productivity. This translates into unnecessary costs with operators and equipment and operational difficulties in supplying what is needed when it is needed (Imai 2012).
Therefore, a mizu concentrates all transportation Muda in it, removing non-value-added activities from operators and increasing their productivity.
3 Initial Situation: Problems and Opportunities
The first weeks at the DP were spent on the shop floor, close to operators and understanding how each team functioned, the relations between teams and the daily struggles. Following the Kaizen methodology, a consultant should, with the team, find the Muda at the Gemba (shop floor). In order to do that, the team had been previously formed on Kaizen Thinking and the principles that Kaizen Institute follows.
There were several areas found to be in ineffective and had a chance to be improved. These are presented in the chapters to follow.
3.1 Organizational Structure and alignment difficulties
When the project started, the DP followed a functional organizational structure, where people were grouped according to the similarity of their functions, as presented in Appendix B. The teams were the following:
• Injection team – works 24/7 with 3 shifts. Each shift has a single team leader for 18 operators;
• Injection processes team – works 2 shifts per day, 5 days per week. Each shift has 3 fine tuners (one of which is the Team Leader) and 3 mold mounters;
• Machine maintenance team – works 2 shifts per day, 5 days per week. Each shift has 2 operators. There are 2 operators working a regular shift (from 8 am to 5 pm);
• Mold maintenance team – works 2 shifts per day, 5 days per week. Each shift has 4 operators;
There is also a planning team, a raw materials team and an engraving team. These were not considered in the reorganization of teams at this first stage of the project. The tasks of each operator in each team are presented in Table 1.
This organizational scheme, with support teams only working 2 shifts 5 days per week and the injection team working 3 shifts 7 days per week, had several problems that were noted after just a few days. One issue was the lack of support teams during night shifts and weekends. Therefore, whenever a machine or mold had a problem during the night or weekends, the machine had to be stopped until the morning or until Monday, accordingly. Moreover, because the injection processes team was also not around, a broken mold, for example, could not be replaced during these periods. Because of this, Mondays were particularly hard days, as a lot of problems had piled up during the weekend and had now to be solved by these support teams. Another big issue was communication between teams and shifts. If for example, a machine has a certain problem that operators should be aware, the machine maintenance team has difficulty in passing on this information, as there is no efficient channel of communication. Each team works almost alone and little information is passed between the injection team and the support teams. Because of this, there are recurring issues that could be avoided with better communication. One example witnessed was a mold guide that broke. The problem had been identified by the process injection team, but information was not passed on – just a talk over coffee with a maintenance operator. A few weeks later, the mold broke and nobody in the maintenance team recalled the issue.
Also – and this is transversal to all teams – there are few standard procedures, best practices or even standard ways of communication. This leads to alignment difficulties between and within teams and to great performance variability: in the DP, it is heard a lot that “each day is different”.
Table 1 Tasks per function at the DP
Function Tasks
Team Leader
Manage team’s vacations and days off Assign tasks to operators
Solve machine problems Prepare machines for setup
Operator
Packing
Trim flashes and separate pieces from sprues Replace other operators when needed
Logistical operations
Mounter
Move molds from the preparation area to the machine Mount molds
Unmount molds
Fine Tuner Fine tune molds
Retune during production
Mold Maintenance Operator
Clean molds
Repair molds in and outside machines Improve molds
Machine Maintenance Operator Preventive and corrective electrical and mechanical
maintenance of machines
3.1.1 Injection Team – A wide span of control and inefficient operators
The injection team leader had an abnormal span of control: he was responsible for 18 operators over an area of around 2000 m2. His day was spent running around the factory solving machine stoppages and helping operators that were in need. Because of the wide span of control and covered area, he faced a hard time meeting all requests for help, so it was normal to find machines stopped for several minutes.
Moreover, due to this firefighter type of job, not much time was left to train operators, audit their work and workplace and improve whatever problems occurred in the facility. This meant that operators felt a lack of leadership: not because the team leader was not good, but because he was not capable of supporting everyone. In Appendix AC, it is found a typical day of a team leader. Throughout the project, the whole day of team leaders was followed several times. Most of the day was spent in fire-fighting activities (see figure 8): correcting mistakes, solving machines stoppages and quality problems, re-planning work. Only 22% of the day is spent training team members, auditing their work and giving feedback and only 5% is spent in teamwork planning. So, only a few of his time was spent in activities that contribute to the improvement of the company on the long run.
22% 9% 55% 13% 0% 2% 0% 10% 20% 30% 40% 50% 60% Team Development Teamwork Planning Fire-fighting Personal Organization
Meetings Other tasks
Typical team leader day
To make matters worse, there was not a team meeting where problems could be discussed and the work planned. The team leader, based on the information passed on by the team leader of the previous shift, would go around the factory and talked individually with each employee about the problems that may occur on each machine and what recurring defects of the parts he should keep an eye on. So, the team was not aware of the problems happening in their workspace, but just the ones happening at that specific moment in some machines.
Moreover, the DP had too many employees, because absenteeism is high and operators have a low working rhythm. So, throughout the shift, it was common to see operators talking with each other and on their phones, waiting for the machines.
Additionally, there was not a person assigned to replace materials when in short. Usually, the ship responsible (an operator assigned by the team leader to help him in each ship) would go to the warehouse to pick pallets of material. These pallets were placed in each ship, at each end of it. Operators were then responsible for replenishing each machine they were working at with the packing material needed. This meant that they would need to walk around, picking materials and bringing them to where they needed it. To ensure less walking around, they would bring excessive quantities of material to each machine and mount lots of carton boxes, so it would last several hours or even the full shift. It was also the ship responsible the one responsible for transferring the pallets with plastic parts to the warehouse and scan each box, although it was common to see other operators perform this task.
3.1.2 Mold Maintenance
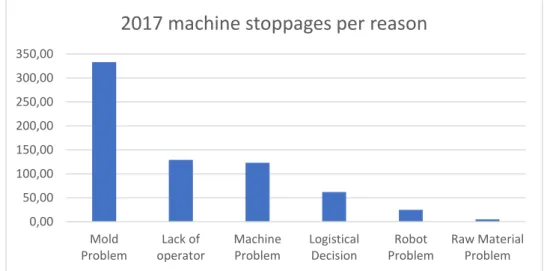
DP has a particularity: for its 46 machines, there are over 1300 molds. That means that, on average, a mold is used once every 3 months. This has serious implications in the mold conditions, as it degrades over time. So, to keep the mold functional, careful inspection and maintenance are needed after it exits the machine and right before it enters it. Although data was not kept over the last few years on the impact mold problems had in the DP, an indicator with the causes for machine stoppages started being followed in 2017, as seen in figure 9. Almost 50% of all stoppages are due to mold issues.
Moreover, one can also note that the other main issues are machine problems and lack of operators. The lack of operators usually leads to stoppages during the break periods. In order for the DP never to stop, operators’ breaks are taken alternately: only a few at a time, while the others keep up the work. Since absenteeism is high, sometimes during this period there are not enough operators to perform the job, so one or two machines must be stopped.
0,00 50,00 100,00 150,00 200,00 250,00 300,00 350,00 Mold Problem Lack of operator Machine Problem Logistical Decision Robot Problem Raw Material Problem