Repositório ISCTE-IUL
Deposited in Repositório ISCTE-IUL: 2018-10-11
Deposited version: Post-print
Peer-review status of attached file: Peer-reviewed
Citation for published item:
Marques, S., Swift, H. J., Vauclair, C.-M., Lima, M. L., Bratt, C. & Abrams, D. (2015). ‘Being old and ill’ across different countries: social status, age identification and older people’s subjective health. Psychology and Health. 30 (6), 699-714
Further information on publisher's website: 10.1080/08870446.2014.938742
Publisher's copyright statement:
This is the peer reviewed version of the following article: Marques, S., Swift, H. J., Vauclair, C.-M., Lima, M. L., Bratt, C. & Abrams, D. (2015). ‘Being old and ill’ across different countries: social status, age identification and older people’s subjective health. Psychology and Health. 30 (6), 699-714, which has been published in final form at https://dx.doi.org/10.1080/08870446.2014.938742. This article may be used for non-commercial purposes in accordance with the Publisher's Terms and Conditions for self-archiving.
Use policy
Creative Commons CC BY 4.0
The full-text may be used and/or reproduced, and given to third parties in any format or medium, without prior permission or charge, for personal research or study, educational, or not-for-profit purposes provided that:
• a full bibliographic reference is made to the original source • a link is made to the metadata record in the Repository • the full-text is not changed in any way
The full-text must not be sold in any format or medium without the formal permission of the copyright holders. Serviços de Informação e Documentação, Instituto Universitário de Lisboa (ISCTE-IUL)
Av. das Forças Armadas, Edifício II, 1649-026 Lisboa Portugal Phone: +(351) 217 903 024 | e-mail: [email protected]
NOTICE: this is the author’s version of a work that was accepted for publication in the Psychology & Health. Changes resulting from the publishing process, such as peer review, editing, corrections, structural formatting, and other quality control mechanisms may not be reflected in this document. Changes may have been made to this work since it was submitted for publication. A definitive version was subsequently published as: Marques, S., Swift, H. J., Vauclair, C. M., Lima, M. L., Bratt, C., & Abrams, D. (2015). ‘Being old and ill’across different countries: Social status, age identification and older people’s subjective health. Psychology &
‘Being Old and Ill’ Across Different Countries: Social Status, Age Identification and Older People’s Subjective Health
Sibila Marques1, Hannah J Swift2,Christin-Melanie Vauclair1, Maria Luísa
Lima1, Christopher Bratt23, & Dominic Abrams2
1 Centre for Psychological Research and Social Intervention (CIS-IUL), Lisbon
University Institute ISCTE-IUL, Av das Forcas Armadas, 1649-026 Lisboa.
2 Centre for the Study of Group Processes; School of Psychology, University of Kent,
Canterbury CT2 7NP, UK.
3 International Research Institute of Stavanger, Professor Olav Hanssens vei 15, 4021,
Norway
All authors are members of the EUR-AGE research group.
Correspondence should be addressed to Sibila Marques at the Centre for
Psychological Research and Social Intervention, Lisbon University Institute ISCTE-IUL, Av das Forcas Armadas, 1649-026 Lisboa. Tel: 00351968621220, Email: [email protected]
This work was supported by the Economic and Social Research Council, (grant number: ES/I036613/1 to the last author); and by the Commission of the European Communities (Marie Curie Fellowship, grant number: FP7-PEOPLE-2010-RG to the third author).
Abstract
Objective: It has been suggested that the extent to which older adults identify with
‘old-age’ is associated with greater subjective ill-health (Stephan, Demulier & Terraciano, 2012). Based on Social Identity Theory (Tajfel & Turner, 1979) we hypothesize that the societal social status of older people should moderate this relationship, such that the effect of age-identification on subjective health should be stronger in countries in which older people have lower social status.
Design and main outcome measures: Subjective health, age identification and the
perceived status of people over 70 were assessed in the 2008/09 European Social Survey. Multilevel modelling on a subsample of respondents over 70 years of age (N = 6,185), was used to explore whether the perceived status of older people moderates the effect of age-identification on subjective ill-health.
Results: 21.31% of the total variance in older people´s subjective ill-health was due
to country differences. The hypothesized cross-level interaction was significant. The negative association between old age identification and subjective health is stronger in countries where the social status of older people is perceived to be lower.
Conclusion: The results are discussed in relation to maintaining health, well-being
and the protective aspects of being ascribed a higher social status. Keywords: status, age identification, health, ageing, older people
‘Being Old and Ill’ Across Different Countries: Social Status, Age Identification and Older People’s Subjective Health
Old age is often associated with negative representations of illness, disability and low status (Brewer, Dull, & Lui, 1981; Schmidt & Boland, 1986). These representations have important consequences for people as they grow older (Levy, 2003), especially in relation to their self-rated health. This paper investigates the extent to which different societal evaluations of older people’s social status moderates the relationship between age identification and self-rated health.
According to social identity theory (SIT) (Hogg & Abrams, 1988; Oakes, Haslam, & Turner, 1994; Tajfel & Turner, 1986) people's identities are partly rooted in their memberships of social groups and categories. This part of identity – social identity – can be a central piece to the self-concept and can have important consequences for self-esteem, well-being, and health (e.g., Falomir, Toscani, & Huyghues Despointes, 2009; S. A. Haslam, Jetten, Postmes, & C. Haslam, 2009; Jones, Jetten, Haslam, & Williams, 2011). When an important social identity is associated with the membership of a group that is low status, stigmatized or socially devalued by others, there are significant negative implications for self-esteem and life satisfaction (McCoy & Major, 2003), levels of depression and anxiety and sense of coping, self-efficacy and support (Kellessi, Reicher, & Cassidy, 2009).
The question for the present research is how the relationship between older people’s identification with their age group and their subjective health changes
according to differences in the level of status afforded to older people across different countries. As far as we are aware there is no prior research that has investigated this question in the literature on ageing and health, and also none that has used country level differences to investigate the wider theoretical question of the relationship between group status, social identity and subjective health.
Age Identification and Health
Defining oneself as ‘old’ may have negatively implications for older adults’ health and cognitive and physical functioning, making them more susceptible to stereotype threat and priming effects. For instance, Claire and He (2009) showed that people aged 50 and over who highly identified with their age group also perceived their need for a hearing aid to be greater, regardless of their hearing ability.
Studies of stereotype threat among people aged 59 and over have shown that highlighting people’s ‘old’ age by comparison with younger people significantly reduced their performance on tests of cognitive ability, memory or physical strength and persistence (Abrams, et al., 2008; Abrams, Eller, & Bryant, 2006; Marques, Lima, Abrams, & Swift, in press; Swift, Lamont, & Abrams, 2012; Swift, Abrams, & Marques, 2013). The negative stereotypes associated with old age, which denote older people as less competent than younger people (Cuddy & Fiske, 2002; Cuddy, Norton, & Fiske, 2005), are triggered by the age categorisation and provide an expectancy of underperformance. This creates anxiety, which interferes with cognitive functioning (Abrams et al., 2006, Swift et al., 2013). Moreover, O’Brien and Hummert (2006) found that individuals who strongly identified with their age group were more threatened by negative age stereotypes, and performed worse on tests of memory.
Prior evidence suggests that old age identification could be either positively or negatively associated with subjective health. Early studies investigating effects of age
identification and categorisation also suggest that identifying as an older person is related to worse self-perceived (subjective) health (Engle & Graney, 1985). For example, Stephan, Demulier, and Terracciano, (2012) found that older individuals who perceived themselves as “old” rated their health as poorer than older individuals who perceived themselves as younger.
Self-rated health refers to the individual’s global assessment of their health and is a well-established measure in research on health related factors in later life (George, 2001). It has a moderate to high association with objective medical assessments of health (Pinquart, 2001) and is an important predictor of mortality even after controlling for the effects of physical health, chronic illness and functional status (Idler, 1993). Therefore, it is important to understand the extent to which social psychological factors, such as age identification relate to evaluations of self-rated health in order to enable active and healthy ageing.
Drawing on social identity theory, we propose that the relationship between old age identification and health and well-being in old age should be linked to the perceived social status of the old age group in society (Hogg & Abrams, 1988; Oakes, et al., 1994; Tajfel & Turner, 1986). Belonging to a social group that is negatively valued by others can have negative consequences for members of that group. However, several studies show that social identification with a group can lead to better health and well-being outcomes. For instance, in a number of contexts, research has shown that group identification can serve as a buffer to counteract the negative effects of discrimination on health and well-being (Branscombe, Schmitt, & Harvey, 1999; Garstka et al., 2004; Ramos, Cassidy, Reicher, & S.A. Haslam, 2012). Jones and colleagues (Jones, S.A. Haslam, et al., 2011) demonstrated how individuals with acquired brain injury could protect themselves from some the adverse effects
associated with their injury by identifying themselves as a group of survivors. Research revealed that older people in care homes show an increase in well-being after acquiring a common group identity (C. Haslam, et al., 2010).
Several factors may help to explain this positive effect of social identification on health and well-being. Increasing social identification with a social group can increase and strengthen the provision of social support, social ties and social capital (Levine, Prosser, Evans, & Reicher, 2005; Iyer, Jetten, Tsivrikos, Postmes, & S.A. Haslam, 2009). It can also provide continuity to the self-concept during traumatic life transitions (C. Haslam, et al., 2008; Jetten, S.A. Haslam, Pugliese, Tonks, & C. Haslam, 2010). In sum, there is evidence that social identity is related to health and well-being. However, we contend that this may be dependent on the value attached to people’s ingroups (Tajfel & Turner, 1986; Verkuyten, 2009).
The Moderating Role of Perceived Societal Status
According to social identity theory, the impact of social identification on individual’s self-esteem is dependent on the perception of the social status associated with the group (Abrams, 2013; Ellemers, 1993; Hogg & Abrams, 1988; Tajfel & Turner, 1979). By the term status we refer to social status, in relation to prestige, social standing or position ascribed to individuals that mark their position in a given social system. According to SIT higher status groups generally seek to sustain their position and protect what they regard as the legitimate status quo. To the extent that members of lower status societal groups accept and internalize these demarcations between social groups and their own group membership they acquire certain social identities, which may lead to positive or negative self-perceptions. Belonging to a subordinate category potentially confers a negative social identity, which may have negative consequences for self-esteem and well-being. On the other hand, belonging
to a high-status category creates feelings of pride and positive outcomes for one’s self-esteem. Hence, the effects of social identities on self-esteem are very much dependent on the social standing or position of that group in society. Finally, it is important to emphasize that from a SIT perspective, what matters is the perception of status, that is, SIT is especially interested in “the subjective perceived outcomes of intergroup comparison” (Hogg & Abrams, 1988, p. 54). Theoretically, these perceptions of the status relationships between groups should affect individuals’ self-concept and, we contend, their self-perceptions of health.
The Present Study
This study explores the moderating role of perceived social status on the relationship between old age identification and self-rated health of older people. Although this question could be addressed as a purely individual-level issue (how does a person's perception of age status relate to their self-perceived health?), we are interested in the macro-social aspect of predictions based on SIT, namely that different societal representations of a group's status should account for differences in the relationship between group identification and subjective health. As far as we are aware, the core macro social level tenets in social identity theory have rarely, if ever, been tested by sampling across a large number of societal contexts. Because old age is a ubiquitous social category it is an ideal focus for addressing this important theoretical issue.
Based on SIT, we hypothesize that old age identification is more strongly associated with poorer health in countries where the social status of older people is perceived to be lower (relative to others). We expect these results to hold even when we control for the effect of other factors that have been found to be related to subjective health, specifically country differences in wealth (measured by GDP) and
inequality (measured by GINI) (Bloom & Canning, 2000; Cutler, Lleras-Muney & Vogl, 2008; Ploubidis, Dale, & Grundy, 2012; Lynch et al., 2004).
These hypotheses are tested across representative samples from countries within the European region. Europe is one of the global regions with the highest proportion of older people, and is expected to have a continuous rise in life expectancy over future decades (European Commission, 2006). Given that the European region is culturally and socioeconomically diverse it provides an informative context in which to examine the moderating role of perceived status of older people on the relationship between old age identification and subjective ill-health (Peace, Dittmann-Kohli, Westerhof, & Bond, 2007).
Method
We used data from the European Social Survey (ESS; European Social Survey Round 4 Data, 2008). The data were collected through computer-based personal interviews in 31 countries from the European region, however, the data for two countries (Austria and Lithuania) were unavailable at time of analysis. The data are based on random probability samples, which are representative of the eligible residential populations in each country (aged 15 years and over). We used a subsample of older adults aged 70 years and over, and who self-categorised themselves as belonging to the ‘old’ age group (N = 6,185, Mage = 77.32, SDage =
5.51). This age is well above retirement age across all 29 ESS countries, and the age after which the majority of ESS respondents consider people to be ‘old’ (Abrams et al., 2011).
The dependent variable was the perception of individuals’ subjective ill-health. This was measured using the question ‘How is your health in general?’ Response scale ranged from 1 = ‘very good’ to 5 = ‘very bad’. Health was defined as
subsuming mental and physical health. The ESS does not contain any measures on objective or functional health, yet self-rated health is often used as a proxy for more objective and difficult to measure health outcomes.
Age identification, an individual-level variable, was measured by asking ‘Do you have a strong or weak sense of belonging to age group?’ Response scale ranged from 0 = ‘very weak sense of belonging’ to 10 = ‘very strong sense of belonging’. To ensure age identification correctly reflected identification to the old-age group we excluded respondents who self-categorized themselves as young or middle-aged. In the ESS respondents were asked to best describe the age group they belong to by selecting one of 9 boxes. If they saw themselves as very young, they were instructed to select the first box, and if they saw themselves very old they were instructed to select the last box, with boxes in between reflected more nuanced age categorizations. These choices were recoded in order to reflect young age categorization (boxes 1 to 3), middle-aged categorization (boxes 4 to 6) and old age categorization (boxes 7 to 9). Only those aged 70 and over that categorized themselves as belonging to the old-age group were included in this study.
The perceived societal status of people over 70 was computed by aggregating the mean individual-level indicator for each country, creating a country-level variable. Respondents were asked the following question: ‘I’m interested in how you think most people in [country] view the status of people over 70. Using this card please tell me where most people would place the status of people over 70? The response scale ranged from 0 = ‘extremely low status’ to 10 = ‘extremely high status’. Status was defined for the respondents as ‘referring to prestige, social standing or position in society’.
Since we are dealing with nested data (individuals nested within countries), we used multilevel modelling (with HLM 7 Raudenbush & Bryk, 2002) for our analyses, with full maximum likelihood estimation. All predictors were grand mean centered. First a null-model was computed (i.e. only country specified as the grouping level-two variable with no predictors), to determine the intraclass correlation coefficient (ICC), which is the amount of variance associated with differences between countries. Subjective ill-health had an ICC of .20, showing that 20% of variance was associated with differences between countries. Thus there is sufficient variation between countries to employ a multilevel approach.
The hypotheses were tested in three steps. The first analysis tested a model in which respondent’s age identification, perceived status of people over 70 and the hypothesized age identification by perceived status interaction were predictors of subjective ill-health (Model 1). The second step tested a model (Model 2) in which we included a set of individual-level variables to control for compositional effects on subjective ill-health (Eikemo, Bambra, Judge, & Ringdal, 2008), these include: gender (1 = male, 2 = female), education (ranging from 1 = ‘less than lower secondary education completed’ to 5 = ‘tertiary education completed’), subjective poverty was included as a measure of socio-economic status (‘how do you feel about your household’s income nowadays?’ 1 = ‘living comfortably on present income’ to 4 = ‘finding it very difficult on present income’), being an ethnic minority (‘belong to an ethic minority in country?’ 1 = ‘yes’, 2 = ‘no’), marital status (recoded into 1 = ‘married or in civil partnership’, 0 = ‘all other responses including not married, separated, divorced), and social connectedness (asking how often the person has social meetings with friends, relatives or colleagues; 1 = ‘never’ to 7 = ‘every day’). The aim was to see whether controlling for relevant differences in individuals’
circumstances influenced the relationship between age identification, perceived status and subjective ill-health. Means and standard deviations for individual-level variables are shown in Table 1.
Further analyses consider whether age identification is associated with subjective health independently from any effect of age. Here we explore whether there is an age x perceived status cross-level interaction, and whether the
hypothesized cross-level interaction between age identification and perceived societal status remains after accounting for an interaction between age and perceived societal status. In order to rule out that the relationship between perceived social status and subjective ill-health is confounded with the socioeconomic context we also explore the explanatory power of country-level differences in economic development, measured by Gross Domestic Product Index (GDP) or inequality, measured by the GINI index. The GDP index ranges from 0 to 1 with higher numbers indicating a higher gross domestic product. The data are available for 29 ESS countries and cover the 2007/2008 period (United Nations Development Programme, 2007). The GINI index is a measure of the inequality of the income distribution expressed as a
proportion, with a value of 0 per cent expressing total equality and a value of 100 per cent maximal inequality. Data were obtained from Eurostat for the year 2008 as published on Eurostat’s Data Explorer webpage for 25 countries (Eurostat, 2014). The GINI coefficient for Turkey was only available for the year 2006. Missing data was complemented with data from the World Income Inequality Database (UNU-WIDER, 2008) for Israel (from 2001), Russia (from 2006) and Ukraine (from 2006). Country-level indicators are displayed in Table 2.
Results
Model 1 revealed age identification was significantly positively related to subjective ill-health and perceived societal status was negatively related to subjective ill-health. However, these relationships were qualified by the significant hypothesized cross-level interaction, i.e. the relationship between age identification and subjective ill-health varied depending on the perceived societal status of people over 70, (see Table 3, and description following Model 2).
Model 2 re-tested the effects of age identification, perceived societal status and the age identification x societal status interaction while controlling for
compositional effects (e.g. effects due to differences in the composition of samples within each country). Respondents’ age, gender, education level, subjective poverty, ethnic minority status, being married and social connectedness were entered as covariates at level-one, the individual-level. Respondent’s age, gender and subjective poverty were positively related to subjective ill-health, whereas education and social connectedness were negatively related to subjective ill-health. There was no effect of being married or in a civil partnership or being an ethnic minority on subjective ill-health.
Despite inclusion of these individual-level variables in the model, the
relationship between age identification and subjective ill-health remained positive and the perceived societal status of people over 70 was negatively related to subjective ill-health. The age identification x perceived societal status cross-level interaction also remained significant (see Table 3).
The interaction revealed that the positive relationship between age
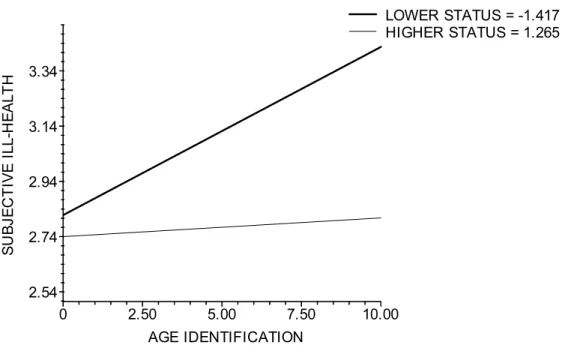
identification and subjective ill-health is only present in countries that perceived older people to hold lower status in society (B = 0.059 SE = 0.01, p < .001) such as,
hypothesis that age identification is negatively related to older people’s subjective health in countries that perceive the societal status of people over 70 to be lower. In countries that perceive the societal status of people over 70 to be higher, such as Switzerland, Nordic countries, Great Britain, Belgium and Germany, older people’s age identification was not related to subjective ill-health (B = 0.01, SE = 0.008, p = .189) see Figure 1. This is the same interaction pattern held in Model 1.
Age vs. Age Identification
Previous research has shown the relationship between age and age identification to be curvilinear, with age identification being strongest amongst younger and older adults and weakest around middle-age (Abrams, Eilola, & Swift, 2009). In line with this we find a positive relationship between age and age
identification r (5699) = .106, p < .001, with age identification increasing with age. In addition we find that ratings of subjective ill-health increase with age, r (6179) = .032, p = .011. Therefore in this next analysis we evaluate the possibility that the effect of age identification on subjective ill-health is just a proxy effect of age. This is done by substituting the age identification x social status interaction in Model 2 with a cross-level interaction between age and perceived societal status. As expected, age and the perceived societal status of people over 70 were significantly related to subjective ill-health as in Models 1 and 2. However, importantly the age x societal status interaction was not significant (B = -0.002, p = .351). In a separate model the age identification x societal status cross-level interaction was re-entered. In this analysis the age identification x perceived societal status interaction remained
significant (B = -0.02, p < .001) but the age x perceived societal status interaction was not (p = .713), ruling out the possibility that the age identification effects were
Additional Country-level Differences
Further analysis re-tested the effects of age identification, perceived social status and the age identification x societal status interaction while controlling for additional socio-economic differences between countries, as measured by GDP and GINI. In addition to Model 2, GDP and GINI were entered as level-two predictors of subjective ill-health. The analysis revealed no effect of GDP or GINI. The main effect of societal status was also not significant, but importantly the age identification x social status interaction remained significant (B = -0.02, p < .001), revealing a similar pattern to that presented in Figure 1. These analyses demonstrate the age
identification x social status interaction effect remain even after controlling for country-level differences in economic development or inequality.
Discussion
In line with our hypotheses we showed, for the first time, that the effect of age identification on the self-rated health of older people is moderated by the societal differences in perceptions of the social status of older people. The evidence shows that, in countries where older people are perceived as having lower social status, strongly identifying with the old age group is related to higher levels of subjective ill-health. On the other hand, there is no relationship between the degree of age
identification and self-rated health in countries where the status of older people is perceived as higher. These findings are robust given that the analyses were run on representative samples across 29 countries in the European region. They also remain after controlling for a number of demographic and compositional effects and country-level differences in economic development and inequality.
This evidence appears to confirm the external validity of studies that suggest that belonging to a devalued category has negative effects on health (Kellessi,
Reicher, & Cassidy, 2009; McCoy & Major, 2003). However, the present study extends and strongly qualifies these previous findings by demonstrating that the negative relationship between age identification and health is likely to prevail only in
societal contexts in which the old age category is perceived to hold lower social
status. In fact, the findings represent a rare but highly meaningful and robust test of SIT’s core predictions about the way societal status and identification relate to different social groups (c.f. Abrams, 2013). Specifically, the findings support the macro social prediction that identifying with a negatively valued social group or category is likely to be an unpleasant state that has negative implications for the self-concept. Here we show that the implications extend to the health of individual members of the group. Interestingly, these results hold even when we control for the effects of GDP and GINI, indicating that the interaction between age identification and social status is not an artefact of economic factors such as wealth or inequality within the country. Status differences between groups reflect the dominant ideology and widely cultural shared beliefs associated with group members (Abrams, 2013; Hogg & Abrams, 1988). Hence, distinct from the effects that more objective forms of material deprivation may have on an individual’s health, just being a member of a devalued category with which one identifies has negative implications for subjective health.
It is important to consider why the association between age identification and health should be particularly strong when we consider the old age category.
According to Garstka and colleagues (Garstka, et al., 2004) the specific and unique features of the old age-group as a social category mean that older people are unable to escape the negative representations that surround it. First, these perceptions are associated with a context of stable and closed boundaries between age groups. For
older adults it is impossible to regain the membership in the high-status middle-age category once they have left it and this perception of impermeable boundaries forces them to adopt a new categorization with its associated negative representations. Because, in the majority of countries, there is limited resistance or challenge to negative images and stereotypes of old age, older people may find it hard to escape this new negative membership with all its associated costs for their self-esteem and well-being.
It is important to note that, although other types of group identification can offer health benefits, we did not find the potentially positive association between age identification and health in countries in which the status of older people was
perceived as relatively higher. At face value this implies that acknowledging oneself as old does not bring the benefits usually associated with group identity. Perhaps it does not bring the sense of we-ness and social support expected from belonging to a social group. However, even in countries where the status of older people is higher, older people are still perceived to have lower status than the middle-aged (Abrams, Russell, Vauclair, & Swift, 2011). This is likely to explain why old age identification is not associated with subjective ill-health in countries where the status differences are perceived to be relatively smaller. Thus our findings show that the negative
association between age identification and health emerge as the status differential grows. However, in this study, we could not test whether the identification-subjective health relationship would become positive if old age were to be accorded higher status than other ages. Also, we note that the lack of a significant relationship between old age identification and subjective health in countries that accord higher status to older people seems to contradict previous studies conducted within countries that ascribe higher status to older people (e.g. Engle & Graney, 1985; Stephan, et al., 2012).
However, these studies used a measure of subjective age rather than age identification and only used individual level data from within a restricted number of countries. Our findings extend these by providing a robust analyses on representative samples from 29 countries.
The present findings have considerable practical, political and policy implications. In countries where old age is perceived as signifying low status, identifying strongly with old age is related to higher subjective ill-health. This suggests that in these countries just acknowledging that one is old is likely to present real risks to one’s health, a possibility that is rarely considered in health policy but should be considered by public policy addressing health issues (WHO, 2002).
Limitations and future studies
The sample from the ESS is representative of European countries. We believe that the countries in the present analyses represent considerable diversity in the sense that they include countries usually considered to be from different “cultural zones” (Inglehart & Baker, 2000): these include Catholic Europe (e.g., Portugal, Spain, Poland), Protestant Europe (e.g., Sweden, Denmark, Germany), English speaking areas (e.g., Great Britain) and Ex-Communist countries (e.g., Russia, Estonia). They also differ substantially economically (Peace et al., 2007) and in the status ascribed to older people (Abrams, et al., 2011). However, fuller exploration of the moderating effect of perceived status of older people would require a wider sample of countries from other continents.
In the ESS, only one item measured identification with older people. Some authors argue that this is not necessarily a limitation in the sense that this single-item social identification measure (SISI) has shown good levels of overall validity and reliability across its use with different groups (Postmes et al., 2012). Nevertheless,
Postmes and colleagues (2012) also point out that this type of measure does not allow differentiation between different dimensions of the concept and so in order to obtain a more nuanced understanding it could be useful to conduct additional studies
employing a more comprehensive measure of social identification (e.g., Cameron, 2004).
Although our models test theoretically plausible relationships, we are cautious about making strong causal arguments because the ESS data are cross-sectional. If future rounds of the ESS measure age identification and the perceived status of people over 70 it may be possible to conduct a more robust test of causal hypotheses.
However, ideally longitudinal cross-national data would be required to establish greater certainty over likely causality.
Conclusions
In sum, the present study clarifies previous mixed evidence regarding the effect of age identification on self-rated health. It provides important insights into the importance of tackling negative attitudes to age, demonstrating that the perceived social status of older people is negatively related to health (or positively related to subjective ill-health). However, in accordance with the social identity theory
hypothesis the findings demonstrate that the perceived social status of people over 70 is associated with the extent to which age identification has negative implications for older people’s subjective health. The perceived social status of older people qualifies the relationship between age identification and self-rated health, demonstrating that age identification is only negatively related to health in countries where older people are devalued in terms of their perceived status.
The research provides important insights into how and when being ascribed a higher social status is likely to have protective functions for older people. It shows
that the elevation of the perceived social status of older people is likely to go hand in hand with a weaker association between age identification and subjective ill-health. A useful avenue for future research is to explore factors that elevate societal perceptions of older people’s status because these may help to attenuate a negative relationship between older adults’ age identification and subjective health.
References
Abrams, D. (2013). Social identity and groups. In J. M. Levine (Ed.), Group
processes (pp. 267-296). New York: Psychology Press.
Abrams, D., Crisp, R. J., Marques, S., Fagg, E., Bedford, L., & Provias, D. (2008). Threat inoculation: Experienced and imagined intergerational contact prevent stereotype threat effects on older people’s math performance. Psychology
and Aging, 23, 934-939. doi: 10.1037/a0014293
Abrams, D., Eller, A., & Bryant, J. (2006). An age apart: The effects of
intergerational contact and stereotype threat on performance and intergroup bias. Psychology and Aging, 23, 691-702. doi: 10.1037/0882-7974.21.4.691 Abrams, D., Russell, P. S., Vauclair, M., & Swift, H. J. (2011). Ageism in Europe:
Findings from the European Social Survey. London: Age UK.
Bloom, D.E. & Cannin, D. (2000). The health and wealth of nations. Science, 18, 1207-1209. doi: 10.1126/science.287.5456.1207
Branscombe, N. R., Schmitt, M. T., & Harvey, R. D. (1999). Perceiving pervasive discrimination among African-Americans: Implications for group
identification and well-being. Journal of Personality and Social Psychology,
Brewer , M. B., Dull, V., & Lui, L. (1981). Perceptions of the elderly: Stereotypes as prototypes. Journal of Personality and Social Psychology, 41, 656-670. doi: 10.1037//0022-3514.41.4.656
Cameron, J. E. (2004). A three-factor model of social identity. Self and identity, 3, 239-262. doi: 10.1080/13576500444000047
Claire, L. S., & He, Y. x. (2009). How do I know if I need a hearing aid? Further support for the self-categorisation approach to symptom perception. Applied
Psychology: An International Review, 58, 24-41. doi:
10.1111/j.1464-0597.2008.00380.
Cuddy, A. J. C., & Fiske, S. T. (2002). Doddering but dear: process, content, and fucntion in stereotyping of older persons In T. D. Nelson (Ed.), Ageism:
Stereotyping and prejudice against older persons (pp. 3-26). Cambridge,
MA: MIT Press.
Cuddy, A. J. C., Norton, M. I., & Fiske, S. T. (2005). This old stereotype: the pervasiveness and persistence of the elderly stereotype. Journal of Social
Issues, 61, 267-285. doi: 10.1111/j.1540-4560.2005.00405.x
Cutler, D.M., Lleras-Muney, A. & Vogl, T. (2008). Socioeconomic status and health: Dimensions and mechanisms. NBER Working Papers 14333, National Bureau of Economic Research, Inc. Retrieved from
http://ideas.repec.org/p/nbr/nberwo/14333.html
Eikemo, T. A., Bambra, C., Judge, K., & Ringdal, K. (2008). Welfare state regimes and differences in self-perceived health in Europe: A multilevel analysis.
Social Science & Medicine, 66, 2281-2295. doi:
Ellemers, N. (1993). The influence of socio-structural variables on identity management strategies. In W. Stroebe & M. Hewstone (Eds.), European
review of social psychology (Vol. 4, pp. 27-58). New York: Wiley.
Engle, V. F., & Graney, M. J. (1985). Self-assessed and functional health of older women. International Journal of Aging and Human Development, 22, 301-348.
European Commission (2006). The demographic future of Europe: From challenge to opportunity Retrieved from
http://europa.eu/legislation_summaries/employment_and_social_policy/situati on_in_europe/c10160_en.htm
Eurostat, (2014). Gini coefficient of equivalised disposable income, Retrieved from http://appsso.eurostat.ec.europa.eu/nui/show.do?dataset=ilc_di12&lang=en Falomir, J. M., Toscani, L., & Huyghues Despointes, S. (2009). Determinants of flu
vaccination among nurses: The role of identification with nurse’s group.
Applied Psychology: An International Review, 58, 42-58. doi:
10.1111/j.1464-0597.2008.00381.x
Garstka, T. A., Schmitt, M. T., Branscombe, N. R., & Hummert, M. L. (2004). How young and older adults differ in their responses to perceived age
discrimination. Psychology and Aging, 19, 326-335. doi: 10.1037/0882-7974.19.2.326
George, L. K. (2001). The social psychology of health. In R. H. Binstock & G. L.K. (Eds.), Handbook of Aging and the Social Sciences (5th ed.). San Diego: Academic Press.
Haslam, C., Haslam, S. A., Jetten, J., Bevins, A., Ravenscroft, S., & Tonks, J. (2010). The social treatment: Benefits of group reminiscence and group activity for
the cognitive performance and well-being of older adults in residential care.
Psychology and Aging, 25, 157-167. doi: 10.1037/a0018256
Haslam, C., Holme, A., Haslam, S. A., Iyer, A., Jetten, J., & W.H., W. (2008). Maintaining group membership: Identity continuity and well-being after stroke. Neuropsychological Rehabilitation, 18, 671-691. doi:
10.1080/09602010701643449
Haslam, S. A., Jetten, J., Postmes, T., & Haslam, C. (2009). Social identity, health and well-being: An emerging agenda for applied psychology. Applied
Psychology: An International Review, 58, 1-23. doi:
10.1111/j.1464-0597.2008.00379.x
Hogg, M. A., & Abrams, D. (1988). Social identifications: A social psychology of
intergroup relations and group processes. London: Routledge.
Idler, E. (1993). Age differences in self- assessments of health: Age changes, cohort differences, or survivorship? Journal of Gerontology: Social Sciences, 48, 289-300. doi: 10.1093/geronj/48.6.S289
Iyer, A., Jetten, J., Tsivrikos, D., Postmes, T., & Haslam, S. A. (2009). The more (and the more compatible) the merrier: Multiple group memberships and identity compatibility as predictors of adjustment after life transitions. British
Journal of Social Psychology, 48, 707-733. doi:
10.1348/014466608X397628
Jetten, J., Haslam, C., Pugliese, C., Tonks, J., & Haslam, S. A. (2010). Declining autobiographical memory and the loss of identity: Effects on well-being.
Journal of Clinical and Experimental Neuropsychology, 32, 408-416. doi:
Jones, J. M., Haslam, S. A., Jetten, J., Williams, W. H., Morris, R., & Saroyan, S. (2011). That which doesn’t kill us can make us stronger (and more satisfied with life): The contribution of personal and social changes to well-being after acquired brain injury. Psychology & Health, 26, 353-366. doi:
10.1080/08870440903440699
Jones, J. M., Jetten, J., Haslam, S. A., & Williams, W. H. (2011). Deciding to
disclose: The importance of social relationships for well-being after acquired brain injury. In J. Jetten, C. Haslam & S. A. Haslam (Eds.), The Social Cure:
Identity, health, and well-being (pp. 255-271). London: Psychology Press.
Kellessi, B., Reicher, S., & Cassidy, C. (2009). Surviving the Kosovo conflict: A study of social identity, appraisal of extreme events, and mental well-being.
Applied Psychology: An International Review, 58, 59-83.
doi: 10.1111/j.1464-0597.2008.00382.x
Levine, R. M., Prosser, A., Evans, D., & Reicher, S. D. (2005). Identity and
emergency intervention: How social group membership and inclusiveness of group boundaries shapes helping behavior. Personality and Social
Psychology Bulletin, 31, 443-453. doi: 10.1177/0146167204271651
Levy, B. (2003). Mind matters: cognitive and physical effects of aging
self-stereotypes. Journal of Gerontology: Psychological Sciences, 58B(4), 203-211. doi: 10.1093/geronb/58.4.P203
Lynch, J., Smith, G. D., Harper, S., Hillemeier, M., Ross, N., Kaplan, G. A., & Wolfson, M. (2004). Is income inequality a determinant of population health? Part 1. A systematic review. The Milbank quarterly, 82, 5–99. doi:10.1111/j.0887-378X.2004.00312.x
Marques, S., Lima, M. L., Abrams, D., & Swift, H. J. (in press). Will-to-live in older people’s medical decisions: immediate and delayed effects of aging
stereotypes. Journal of Applied Social Psychology.
McCoy, S. K., & Major, B. (2003). Group identification moderates emotional responses to perceived prejudice. Personality and Social Psychology
Bulletin, 29, 1005-1017. doi: 10.1177/0146167203253466
O’Brien, L. T., & Hummert, M. L. (2006). Memory performance of late middle-aged adults: contrasting self-stereotyping and stereotype threath accounts of assimilation to age stereotypes. Social Cognition, 24, 338-358. doi: 10.1521/soco.2006.24.3.338
Oakes, P. C., Haslam, S. A., & Turner, J. C. (1994). Stereotyping and social reality. Oxford: Blackwell.
Peace, S., Dittmann-Kohli, F., Westerhof, G. J., & Bond, J. (2007). The ageing world. In J. Bond, S. Peace, F. Dittmann-Kohli & G. J. Westerhof (Eds.), Ageing in
society: European perspectives on gerontology (3rd ed., pp. 1-14). Thousand
Oaks, CA: Sage Publications Ltd.
Pinquart M. (2001). Correlates of subjective health in older adults: a meta-analysis.
Psychology and Aging, 16, 414-26. doi: 10.1037//0882-7974.16.3.414
Postmes, T., Haslam, S. A., & Jans, L. (2012). A single-item measure of social identification: Reliability, validity, and utility. British Journal of Social
Psychology. Epub ahead of print. doi: 10.1111/bjso.12006.
Ploubidis, G. B., Dale, C., & Grundy, E. (2012). Later life health in Europe: How important are country level influences? European Journal of Ageing, 9, 5– 13. doi:10.1007/s10433-011-0215-3
Ramos, M. R., Cassidy, C., Reicher, S., & Haslam, S. A. (2012). A longitudinal investigation of the rejection–identification hypothesis. British Journal of
Social Psychology, 51, 642-660. doi: 10.1111/j.2044-8309.2011.02029.x
Raudenbush, S. W., & Bryk, A. S. (2002). Hierarchical Linear Models. Thousand Oaks: Sage Publications.
Schmidt, D., & Boland, S. (1986). Structure of perceptions of older adults: Evidences for multiple stereotypes. Psychology and Aging, 1, 255-260. doi:
10.1037/0882-7974.1.3.255
Stephan, Y., Demulier, V., & Terracciano, A. (2012). Personality, self-rated health, and subjective age in a life-span sample: The moderating role of
chronological age. Psychology and Aging, 27, 875-880. doi: 10.1037/a0028301
Stephan, W. G., & Stephan, C. W. (2000). An integrated threat theory of prejudice. In S. Oskamp (Ed.), Reducing prejudice and discrimination. Mahwah, NJ.: Lawrence Erlbaum Associates.
Swift, H.J., Lamont, R., & Abrams, D. (2012). Are they half as strong as they used to be? An experiment testing whether age-related social comparisons impair older people’s hand grip strength and persistence. BMJ Open. doi:
10.1136/bmjopen-2012-001064.
Swift, H. J., Abrams, D., & Marques, S. (2013). Threat or boost? Social comparison affects older people’s performance differently depending on task domain.
Journal of Gerontology Series B Psychological Sciences and Social Sciences, 68, 23-30. doi: 10.1093/geronb/gbs044
Tajfel, H., & Turner, J. C. (1979). An integrative theory of intergroup conflict. In W. G. Austin & S. Worchel (Eds.), The social psychology of intergroup
relations (pp. 33-47). Monterey, CA: Brooks/Cole.
Tajfel, H., & Turner, J. C. (1986). The social identity theory of intergroup behavior. In S. Worchel & W. Austin (Eds.), Psychology of intergroup relations (pp. 33-48). Chicago: Nelson-Hall.
United Nations Development Program (2007). Human development report 2007/8 –
Fighting climate change: Human solidarity in a divided world, ISBN
978-0-230-54704-9, Retrieved from
http://hdr.undp.org/sites/default/files/reports/268/hdr_20072008_en_complet e.pdf
UNU-WIDER, (2008) UNU-WIDER World Income Inequality Database, Version 2.0c, May 2008. Retrieved from
http://www.wider.unu.edu/research/Database/en_GB/database/
Verkuyten, M. (2009). Assimilation ideology and situational well-being among ethnic minority members. Journal of Experimental Social Psychology, 46, 269-275. doi: 10.1016/j.jesp.2009.11.007
WHO (2002). Active ageing: A policy framework [electronic version]. Geneva: World Health Organization.
Zárate, M. A., Garcia, B., Garza, A. A., & Hitlan, R. T. (2004). Cultural threat and perceived realistic group conflict as dual predictors of prejudice. Journal of
Experimental Social Psychology, 40, 99-105. doi: 10.1016/S0022-1031(03)000
Figure 1: The relationship between respondents’ age identification and subjective
ill-health as a function of the perceived societal status of people over 70, after controlling for other individual differences (age, gender, marital status, ethnic minority status, education, subjective poverty, and social connectedness). Perceived societal status is averaged at lower and upper quartiles.
Table 1.
Means and Standard Deviations of Indiviual-level Indicators
Subjective ill-health Age identification Age Gender Subjective poverty Marital status Education Ethnic minority Social connectedness Belgium (n = 236) 2.41 (0.77) 6.40 (2.29) 77.38 (5.88) 1.57 (0.49) 1.98 (0.81) 0.56 (0.49) 2.44 (1.39) 1.99 (0.11) 4.99 (1.50) Bulgaria (n=390) 3.26 (0.89) 7.75 (2.07) 76.11 (4.94) 1.52 (0.50) 3.29 (0.78) 0.48 (0.50) 2.60 (1.31) 1.90 (0.30) 4.53 (1.83) Croatia (n = 214) 3.29 (1.08) 7.50 (2.08) 75.62 (4.58) 1.57 (0.50) 2.61 (1.02) 0.44 (0.50) 2.21 (1.23) 1.84 (0.37) 4.74 (1.77) Cyprus (n=130) 2.98 (0.95) 7.89 (2.42) 74.95 (4.46) 1.45 (0.50) 2.62 (0.91) 0.62 (0.49) 1.69 (1.24) 1.97 (0.18) 3.4 (1.87) Czech Republic (n = 203) 3.36 (0.87) 7.82 (2.21) 76.37 (5.22) 1.63 (0.49) 2.46 (0.84) 0.30 (0.46) 2.81 (0.87) 1.99 (0.12) 4.59 (1.65) Denmark (n = 215) 3.36 (0.94) 6.38 (2.66) 77.41 (6.21) 1.52 (0.50) 1.39 (0.52) 0.54 (0.50) 3.15 (1.34) 1.99 (0.10) 5.13(1.41) Estonia (n = 272) 3.28 (0.78) 7.27 (1.96) 76.84 (5.53) 1.69 (0.46) 2.34 (0.66) - 2.79 (1.40) 1.80 (0.40) 3.80 (1.61) Finland (n = 314) 2.73 (0.84) 7.29 (2.07) 77.33 (5.75) 1.62 (0.49) 1.96 (0.64) 0.48 (0.50) 1.93 (1.34) 2.00 (0.06) 4.92 (1.47) France (n =332) 2.68 (0.83) 6.26 (2.35) 77.97 (5.64) 1.60 (0.49) 1.83 (0.69) 0.50 (0.50) 2.07 (1.41) 1.98 (0.14) 5.02 (1.48) Germany (n = 374) 2.87 (0.88) 6.56 (2.36) 76.02 (4.94) 1.52 (0.50) 1.81 (0.67) 0.59 (0.49) 3.18(1.08) 1.98 (0.15) 4.17 (1.48) Greece (n = 186) 2.79 (0.94) 7.69 (2.12) 75.69 (5.01) 1.52 (0.50) 3.06 (0.87) 0.57 (0.50) 1.39 (1.00) 1.98 (0.13) 4.03 (1.83) Hungary (n = 242) 3.46 (0.88) 7.96 (1.91) 77.48 (5.60) 1.60 (0.49) 2.60 (0.77) 0.04 (0.49) 2.36 (1.32) 1.98 (0.16) 2.98 (1.89) Ireland (n = 175) 2.22 (0.81) 6.85 (1.28) 77.29 (4.97) 1.51 (0.50) 1.64 (0.70) 0.41 (0.50) 2.17 (1.41) 2.00 (0.00) 4.48 (1.74)
Israel (n = 323) 3.04 (1.02) 7.25 (2.24) 77.50 (5.63) 1.53 (0.50) 2.09 (0.89) 0.59 (0.49) 3.21 (1.45) 1.90 (0.30) 4.79 (1.65) Latvia (n = 307) 3.45 (0.71) 7.65 (2.04) 76.05 (4.87) 1.74 (0.44) 2.88 (0.81) 0.34 (0.48) 2.73 (1.20) 1.92 (0.27) 3.69 (1.59) Netherlands (n = 269) 2.46 (0.79) 6.47 (1.88) 77.36 (5.58) 1.58 (0.49) 1.59 (0.66) 0.47 (0.50) 2.44 (1.37) 1.99 (0.12) 5.16 (1.29) Norway (n =163) 2.45 (0.85) 6.80 (2.07) 77.49 (5.95) 1.52 (0.50) 1.35 (0.56) 0.55 (0.50) 3.20 (1.26) 1.99 (0.08) 4.79 (1.34) Poland (n = 204) 3.34 (0.97) 7.36 (2.30) 76.65 (4.76) 1.58 (0.49) 2.45 (0.64) 0.48 (0.50) 2.47 (1.05) 1.99 (0.12) 3.50 (1.68) Portugal (n = 609) 3.23 (0.84) 7.32 (2.13) 77.22 (5.27) 1.66 (.048) 2.80 (0.81) 0.48 (0.50) 1.31 (0.89) 1.98 (0.13) 4.90 (1.88) Romania (n = 256) 3.32 (1.03) 7.44 (2.33) 75.66 (4.48) 1.54 (0.50) 2.95 (0.94) 0.47 (0.50) 2.01 (1.07) 1.84 (0.36) 3.25 (1.84) Russian Federation (n = 388) 3.76 (0.75) 6.71 (2.52) 76.31 (5.20) 1.71 (0.45) 3.12 (0.80) 0.26 (0.44) 2.68 (1.71) 1.88 (0.33) 3.95 (1.93) Slovakia (n = 225) 3.21 (0.78) 7.69 (2.20) 76.06 (5.16) 1.80 (0.40) 2.56 (0.81) 0.31 (0.46) 2.70 (0.88) 1.95 (0.22) 4.34 (1.80) Slovenia (n = 187) 3.14 (0.82) 7.22 (1.82) 76.67 (5.38) 1.63 (0.48) 2.10 (0.85) 0.52 (0.50) 2.56 (1.18) 1.98 (0.15) 3.60 (1.78) Spain (n = 410) 3.06 (0.93) 6.21 (2.28) 77.71 (5.77) 1.56 (0.50) 2.14 (0.78) 0.56 (0.50) 1.30 (0.90) 1.99 (0.09) 5.04 (1.87) Sweden (n = 283) 2.36 (0.91) 7.25 (2.21) 77.60 (5.51) 1.57 (0.50) 1.54 (0.67) 0.51 (0.50) 2.08 (1.32) 1.99 (0.12) 4.88 (1.37) Switzerland (n= 292) 2.26 (0.75) 6.85 (2.17) 77.66 (5.59) 1.6 (0.49) 1.72 (0.74) 0.41 (0.49) 2.76 (1.18) 1.98 (0.15) 4.8 (1.41) Turkey (n = 143) 2.82 (0.93) 7.96 (2.06) 76.18 (5.74) 1.50 (0.50) 2.63 (0.79) 0.59 (0.49) 1.20 (0.68) 1.97 (0.17) 4.20 (1.81) Ukraine (n =301) 3.74 (0.75) 7.99 (2.13) 76.33 (5.27) 1.70 (0.46) 3.24 (0.74) 0.32 (0.47) 2.77 (1.69) 1.94 (0.24) 4.16 (1.86) United Kingdom (n = 380) 2.38 (0.94) 7.05 (2.48) 77.96 (5.76) 1.53 (0.50) 1.66 (0.68) 0.41 (0.49) 2.28 (1.73) 1.96 (0.21) 5.06 (1.57)
Table 2.
Country-level indicators
Societal status of people over 70 GDPI GINI (for 2008)a
Belgium 5.61 .96 27.5 Bulgaria 2.39 .75 35.9 Croatia 3.70 .81 28.0 Cyprus 7.09 .91 28.3 Czech Republic 3.74 .89 24.7 Denmark 4.75 .97 25.1 Estonia 4.41 .84 30.9 Finland 5.12 .96 26.3 France 5.14 .95 29.2 Germany 5.04 .95 30.2 Greece 5.65 .91 33.4 Hungary 3.86 .87 25.2 Israel 5.50 .93 37.2b Ireland 5.94 .99 29.9 Latvia 4.19 .82 37.7 Netherlands 5.90 .97 27.6 Norway 5.24 1.00 25.1 Poland 3.65 .82 32.0 Portugal 4.99 .89 35.8 Romania 4.19 .75 36.0 Russian Federation 3.19 .78 45.1c Slovakia 3.32 .85 23.4 Slovenia 5.43 .90 23.7
a Data source: Eurostat; Gini coefficient for Turkey is from the year 2006. b Data source: World Income Inequality Database for the year 2001. c Data source: World Income Inequality Database for the year 2006.
Spain 5.06 .94 31.1 Sweden 4.63 .97 24.0 Switzerland 5.60 .98 32.0 Turkey 4.45 .74 44.8a Ukraine 3.13 .71 41.0c United Kingdom 5.19 .97 33.9
Table 3.
Multilevel Regression Models Predicting Subjective Ill-Health
Model 1 Model 2 Intercept 2.99*** (0.06) 3.02*** (0.05) Individual-level effects Age identification 0.04*** (0.01) 0.03*** (0.01) Age 0.01*** (0.003) Gender (female) 0.09*** (0.03) Subjective poverty 0.23*** (0.02) Marital status -0.04 (0.03) Education -0.04*** (0.01) Ethnic minority -0.03 (0.07) Social connectedness -0.06***(0.01) Country-level effects Societal status -0.25*** (0.06) -0.18*** (0.05) Cross-level interaction
Age identification x societal status -0.02*** (0.01) -0.06*** (0.01) Per cent of variance explained
Within countries 2.60 9.71
Between countries 39.46 65.24
Degrees of freedom
Within countries 5663 5277
Between countries 27 26a
Note: All entries are unstandardized regression coefficients. Significance levels
indicated by *** = p < .001, ** = p < .01, * = p < .05. All predictors are grand-mean centred. Individual-level data are weighted by the ESS design weights. a Run-time deletion reduced the number of level-2 groups to 28