AR
TICLE
1 Universidade Estadual de Montes Claros. Av. Dr. Ruy Braga S/N, Vila Mauriceia. 39401089 Montes Claros MG Brasil.
Factors associated with negative self-rated health
among non-institutionalized elderly in Montes Claros, Brazil
Abstract This study aimed to obtain an un-derstanding of the self-rated health among com-munity-dwelling elderly people in the north of Minas Gerais, identifying factors associated with negative self-rated health. We conducted a popu-lation-based cross-sectional study with two-stage random sampling. Data collection was carried out in the home of elderly people by trained staff who used questionnaires that had already been vali-dated. To identify the variables associated with negative self-rated health, bivariate analyses were performed, followed by Poisson regression analysis. The study included 686 elderly people (average age = 70.9 years, DP = 8.08), 445 (64.9%) of whom were female. Most were mixed-race (57.1%) and had less than 4 years of schooling (76.3%). On the self-rated health, 291 elderly people (42.4%) had a positive perception of their own health (very good or good); 302 elderly people described their health as “regular” (44.0%) and 93 (13.5%) re-ferred to their own health as “poor” or “very poor”. The variables associated with a negative self-rated health were: difficulties in accessing health ser-vices, having a fall in the last year, hypertension, heart problems, asthma/bronchitis and any degree of fragility. The results reinforce the fact that mul-tiple factors are associated with negative self-rated health among the elderly, with an emphasis on those related to morbidity.
Key words Health of the elderly, Self-Assessment
(health), Cross-Sectional studies
Sarah Magalhães Medeiros 1
Lorena Santos Rocha Silva 1
Jair Almeida Carneiro 1
Gizele Carmen Fagundes Ramos 1
Ana Teresa Fernandes Barbosa 1
M
ed
eir
os SM
Introduction
Self-rated health is an indicator used in research into health that, despite being subjective, pro-vides a measure of effectiveness that is quick and can be done at low cost on the health of groups
in the population1. In the last few years, medical
journals have been increasing their production
in these area2,3 spotlighting associations with
morbidty2,4-6 and with an emphasis on the elderly
population2-4,7.
An investigation into self-rated health amongst older people has become very relevant for those in Brazil in the last few years. This is because Brazil has an accelerating aging popula-tion and this process has both important impacts
and challenges for the health service8. National
studies have already shown that the proportion of negative self-perception of health increases as
the person gets older9,10.
It is reasonable to suggest that common oc-currences amongst older people such as the high number of those with non-transmissible chron-ic illnesses and functional incapacity, influence their own negative perception of their health. However, it is important to investigate how much this perception suffers from being influenced by social conditions and the environment. As this is a subjective evaluation, self-perception of health has a multi-dimensional character which in-cludes life styles, as well as psychological,
demo-graphic and socioeconomic aspects1,2,6,10.
The particularities that are involved in self-rated health justify conducting local and regional studies that can help health managers in the development of strategies to improve the health conditions of the population especially the elderly population which has increased the most in the last few years. The identification of various aspects involved in the perception of health for older people can reveal more vulner-able groups permitting the development of more specific health measures which in turn will be more effective in improving the quality of life of these groups.
The north of Minas Gerais is an area in tran-sition between the south east and the north east of the country. It has some indicators that show a population that is poor and in need with a Gross Domestic Product per capita in the region that is below the state and Brazil as a whole. The house-hold income per capita is lower than what has been observed as the average for the state and it is the second lowest when compared to the rest of the regions in the state. Amongst the 89
munici-palities in the region, only three have a high
Mu-nicipal Human Development Index (IDHM)11. In
this region there are no registered inquiries that involve self-rated health amongst older people. The objective of this study was to obtain a better understanding of the self-rated health amongst older people in communities living in the princi-pal city in the north of Minas, identifying factors associated with negative self-rated health.
Methods
This was a transversal study that was carried out on non-institutionalized older people resident in the urban area of the municipality of Montes Claros located in the north of Minas Gerais. The process involved two-stage random sampling. In the first stage we used a unit sample from a cen-sus area where we randomly selected 42 cencen-sus areas amongst 362 urban sectors in the munici-pality. In the second stage we set the number of households to be used according to the
popula-tion density of individuals aged ≥ 60 years12. In
this stage the calculation of the number of house-holds to be in the random selection was done based on the expected average of elderly people per household (ratio people/household), in other words, the sectors with higher numbers of old-er people had more households allocated which created a more representative sample.
The total number of allocated older people for the study was considered as having a conser-vative prevalence of 50% for the studied event with an estimated population of 30,790 older
people12, with a margin of error of 5% and a
lev-el of confidence of 95%. Based on the fact that we used a cluster sample, the number that was identified was multiplied by a factor of correc-tion (deff) of 1.5 and was increased from 20% for eventual losses. The minimum number of people in the study was set using the calculated sample of 684 people.
The following inclusion criteria were used: individuals aged 60 or over and residents in the randomly selected census areas. Older people, whose carers/family members considered unable to fill in the questionnaire form in the study, were excluded. Older people who were not able to par-ticipate after three visits to their homes at dif-ferent days and times were considered as losses, even where appointments had been scheduled.
aúd
e C
ole
tiv
a,
21(11):3377-3386,
2016
had been previously trained and they went to census sectors based on points that had been pre-viously selected in each census sector in order to carry out the interviews. The tools used to collect the data were questions that had been validated in other population studies, having an emphasis on telephone research covering vigilance over risk factors and protection against chronic
dis-ease13. It was previously used in a pilot study in
a special and randomly selected census sector to check the understanding of the questions by the interviewees and the abilities of the interviewers. The pilot study showed that there was no need to change the tool for the collection of data and the data collected in this phase was not included in the final analysis.
The dependent variable was self-rated health, evaluated by the question “How would you clas-sify your state of health?”. The options to respond were: “Very good”, “Good”, “Regular”, “Bad” or “Very bad”. In order to analyze the collected data, the responses were dichotomized and there was an assumption of a positive perception of health for the responses “Very good” and “Good” and a negative perception of health in the sum of the responses being “Regular”, “Bad” and “Very bad” following similar studies on the theme that were
both national and international1,2,4,5.
The independent variables that were stud-ied were: gender, age, self-referred race, marital status, family arrangements (the ability to live alone or with other people), level of education, family income, religious practices, type of health services used, having private health insurance or not, having been admitted to hospital in the last 12 months, having registered a fall in the last 12 months, the presence of chronic morbidities that was self-referred (hypertension, heart problems, mellitus diabetes, arthritis/arthritis/rheumatism, osteoporosis, asthma/bronchitis asthma/allergy and urinary incontinence) polypharmacy (the regular use of five or more medications),
fragil-ity (assessed by the Edmonton Frail Scale) and
depression symptoms assessed by the Geriatric
Depression Scale of 15 items. The last two scales were validated for use in the country for use with
the necessary transcultural changes14,15.
The information collected was analyzed through the program Statistical Package for Social Sciences (SPSS) version 17.0 (SPSS for Windows, Chicago, USA). Bivariate analysis was undertaken and later multiple analysis was done through the use of Poisson’s regression, which had robust variance in its multiple analysis. In all of the analysis the Prevalence Ratio (RP)
was calculated with consideration being given to its respective intervals of confidence at 95% (IC95%). For multiple analysis only the variables that showed associations up to the 20% level (p < 0.20) were considered in the bivariate analysis. In the final model after the multiple analysis, only variables that showed associations up to the level of 5% (p < 0.05) was kept.
Analysis was done on the distribution of the frequency including association measures through the Chi-squared test and Poisson’s re-gression with a robust variance. For this step a group of variables were analyzed with bivariate analysis that showed an association up to the lev-el of 20% (p < 0.20). The final modlev-el was kept as variables whose Prevalence Ratio (RP) was sig-nificant up to the level of 5% (p < 0,05).
All of the participants were given guidance on the research and were given a consent form to be signed (some registered consent digitally) after having their doubts and queries allayed. The re-search project was approved by the Ethics Com-mittee on Research at the Universidade Estadual de Montes Claros.
Results
The number of elderly people used in the study was 686. Of these 445 (64,9%) were female. The ages in the group varied from 60 to 98 years old with the average age being 70.9 (DP ± ± 8,08). The majority of them declared themselves to be mixed race (57,1%) with up to 4 years of offi-cial education (76,3%). These and the rest of the demographic and socioeconomic characteristics can be seen in Table 1.
M
ed
eir
os SM
(13.5%) referred to their own health as “Bad” or “Very bad”.
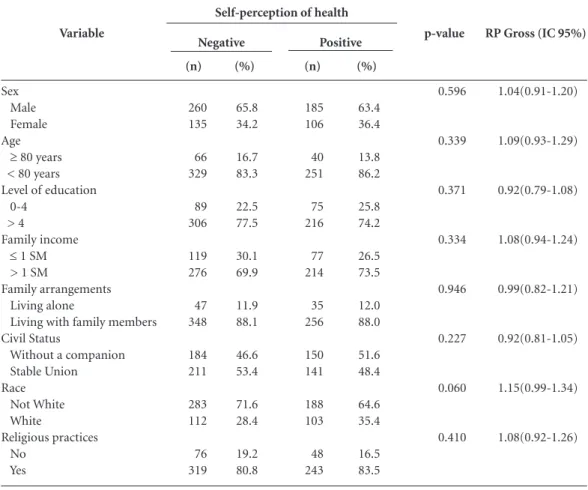
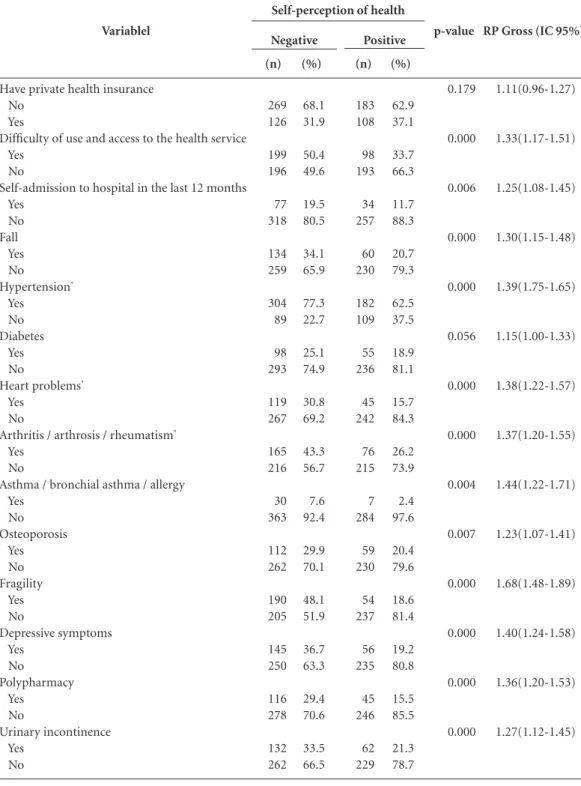
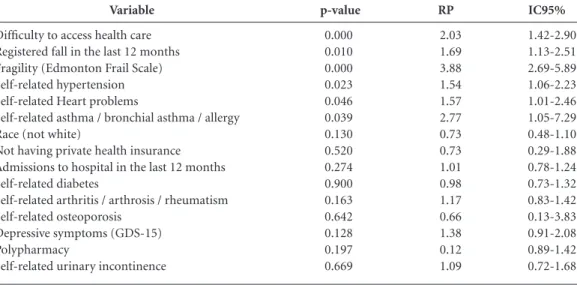
Tables 3 and 4 show the results of the bivar-iate analyzes (gross) for associations that were investigated and Table 5 are the variables that kept the final model after the group analysis of the variables. They showed associations with negative self-perception of health: difficulty in accessing health services, registering falls in the last year, arterial hypertension, heart problems,
asthma/bronchitis, allergies and some level of fragility according to the Edmonton Frail Scale.
Variable
Gender Female Male Age
60 to 69 years old 70 to 79 years old Older than 80 years old Race Mixed-race Black White Asia Marital status Single Married Stable Union Divorced/Separated Widowed Religion Catholic Evangelical Other None Religious practices Yes No
Level of education No formal education
1 to 4 years old of formal education > 4 years
Family arrangements Living alone
Living only with spouse
Living with other family members Not living with any family members Family income
≤ 1 minimum salary 1 to 2 minimum salaries > 2 minimum salaries
N 445 241 341 239 106 392 65 215 14 46 334 18 54 234 476 193 4 13 562 124 179 343 164 82 119 481 4 196 226 264 % 64.9 35.1 49.7 34.8 15.5 57.1 9.5 31.3 2.0 6.7 48.7 2.6 7.9 34.1 69.4 28.1 0.6 1.9 81.9 18.1 26.1 50.0 23.9 12.0 17.3 70.1 0.6 28.6 32.9 38.5
Table 1. Sociodemographic and demographic
characteristics of elderly in Montes Claros (MG) 2013.
* The sum of the percentages is higher due to the fact that the same person refers to more than one morbidity.
Variable
Have private health insurance Yes
No
Type of health service most used Public (SUS)
Private
Private connected with employment Unable to respond
Difficulty of use and access to health service
Yes No
Depressive symptoms (GDS-15) Yes
No
Fragility (Edmonton Scale) Without any fragility With some form of fragility Admissions to hospital in the last 12 months
None Once
More than once Fall in the last 12 months
Yes No
The regular use of five or more medications Yes No Self-referred morbidity* Arterial hypertension Diabetes Heart problems Osteoporosis
Arthritis / arthrosis / rheumatism Emphysema / chronic bronchitis / DPOC
Asthma/bronchial asthma/allergic bronchitis
Urinary incontinence Self-perception of state of health
Very good Good Regular Bad Very good N 234 452 472 29 120 65 269 417 201 485 290 396 564 72 50 194 492 161 525 486 153 164 171 241 30 37 194 30 261 302 84 9 % 34.1 65.9 68.8 4.2 17.5 9.5 39.2 60.8 29.3 70.7 42.3 57.7 82.2 10.5 7.3 28.3 71.7 23.5 76.5 70.8 22.3 23.9 24.9 35.1 4.4 5.4 28.3 4.4 38.0 44.0 12.2 1.3
Tables 2. Characteristics related to health care
aúd
e C
ole
tiv
a,
21(11):3377-3386,
2016
Discussion
This study revealed an important prevalence of negative self-perception in the state of health amongst the elderly community in the north of Minas Gerais. A slightly less percentage was registered in a study done in three cities in the interior of Brazil using a similar methodology that showed a frequency of 49.6% of negative
self-perception of health2. The percentage of
53.8% was observed for regular or bad self-rated
health in a large study in Sao Paulo16.
It should be noted that some studies show percentages far less in relation to negative
self-perception of help6,10. However such studies
group the results of a negative perception as only “bad” and “very bad”. There does not appear to be uniformity in the national studies on an ade-quate “cut off point” to evaluate the factors asso-ciated with negative perception of health. This is because some studies considered regular
percep-tion of health as a positive6,10 perception, others
as negative2,5,9,16 and others conducted analyses
with more than two levels of health perception covering negative perceptions, positive per-ceptions, regular perceptions and intermediate ones17,18. Also there are authors that present other
classifications with options like “excellent, very good, good, bad or very bad” and they exclude
the intermediate option19. The studies also show
discordance in relation to the process of
dichot-omization of responses on self-rated health1,4,20.
The divergence noted in the medical jour-nals on the different cutoff points to measure
self-perception of health is not recent21,22 and
it highlights the need for caution in comparing the results between different studies. Such diver-gences, however, do not mean one less indicator that is not worth using. It represents one measure that is very useful in population studies and re-flects the various aspects of care and the use of
the health services1.
Variable
Sex Male Female Age ≥ 80 years < 80 years Level of education 0-4
> 4
Family income ≤ 1 SM > 1 SM
Family arrangements Living alone
Living with family members Civil Status
Without a companion Stable Union Race
Not White White
Religious practices No
Yes
Table 3. Bivariate analysis amongst socioeconomic and demographic variables and self-rated health amongst the
elderly, Montes Claros (MG) 2013.
p-value
0.596
0.339
0.371
0.334
0.946
0.227
0.060
0.410
RP Gross (IC 95%)
1.04(0.91-1.20)
1.09(0.93-1.29)
0.92(0.79-1.08)
1.08(0.94-1.24)
0.99(0.82-1.21)
0.92(0.81-1.05)
1.15(0.99-1.34)
1.08(0.92-1.26) (n)
260 135
66 329
89 306
119 276
47 348
184 211
283 112
76 319
(%)
65.8 34.2
16.7 83.3
22.5 77.5
30.1 69.9
11.9 88.1
46.6 53.4
71.6 28.4
19.2 80.8 Negative
(%)
63.4 36.4
13.8 86.2
25.8 74.2
26.5 73.5
12.0 88.0
51.6 48.4
64.6 35.4
16.5 83.5 (n)
185 106
40 251
75 216
77 214
35 256
150 141
188 103
48 243
M
ed
eir
os SM
In this current study the variables associated with negative perception of health were those that related to chronic health conditions and took into account: registering a fall in the last
year, difficulty in accessing health services and fragility as assessed by the Edmonton Frail Scale.
On the chronic conditions, they kept: the fi-nal model of arterial hypertension, the register of
Variablel
Have private health insurance No
Yes
Difficulty of use and access to the health service Yes
No
Self-admission to hospital in the last 12 months Yes No Fall Yes No Hypertension* Yes No Diabetes Yes No
Heart problems*
Yes No
Arthritis / arthrosis / rheumatism*
Yes No
Asthma / bronchial asthma / allergy Yes No Osteoporosis Yes No Fragility Yes No Depressive symptoms Yes No Polypharmacy Yes No Urinary incontinence Yes No
Table 4. Bivariate analysis amongst variables related to health and self-rated health amongst the elderly, Montes
Claros (MG) 2013.
p-value 0.179 0.000 0.006 0.000 0.000 0.056 0.000 0.000 0.004 0.007 0.000 0.000 0.000 0.000
RP Gross (IC 95%)
aúd
e C
ole
tiv
a,
21(11):3377-3386,
2016
some heart problem, asthma/allergic bronchitis/ and bronchial asthma. They are conditions that show the narrow connection to the perception of risk of life and/or the continuous use of medi-cations.
Circulatory diseases constitute the principal group of causes of death in Brazil for both sexes. An association between such conditions and neg-ative self-perception of health observed in this
study was registered in Paraná23. Another study
in the elderly population of the Municipality of Sao Paulo concluded that heart disease presents itself as that which would promote percentage gains in years of life free from incapacity, if it
were eliminated in both sexes24. It was
highlight-ed that heart relathighlight-ed problems have an impact on the quality of an older person’s physical and psychological life which often culminates in the
reduction of autonomy25. Aside from this,
cardio-vascular diseases have been shown to be associat-ed with the highest level of dependency in daily and instrumental activities (AIVD) which are aspects that are strongly relevant to older people
with reference to their health conditions26. All of
these factors justify a negative self-perception of health amongst people with cardiovascular prob-lems which was observed even in individuals that were younger, according to the study conducted
in Paraná23. It is worth highlighting that many
times the symptoms and the consequences of the diseases, such as pain and the limitation of activi-ties, seem to be strongly associated with self-eval-uation of negative health than the diseases
them-selves as highlighted in a German study on older
people with multi-morbidity27.
The negative self-evaluation of health also showed an association with registers of system-ic arterial hypertension (HAS). This is a clinsystem-ical condition that is irreversible because of what it is as well as the complications that it can lead to or the medication therapy used which can in-terfere in the various aspects of the patient’s life,
especially older people28. The HAS is a major
risk factor for diseases such as cardiac and renal insufficiency. Aside from this, there is a need to control the medications used in a rigorous and prolonged way and all of this contributes to a worse perception of the state of health. Similar associations amongst negative self-rated health and arterial hypertension were also registered in
other studies2,6. The narrow relationship between
self-perception of health and cardiovascular
dis-eases was studied by Arruda et al.23 that noted
that such associations ought to be highlighted to health professionals as they interfere in the way how patients deal with diseases which can aid in the guidance on self-care.
Asthma which is another chronic condition associated with negative self-perception in this study is also known as “bronchial” asthma or “al-lergic bronchitis” and was investigated amongst the elderly. It is a disease that can be considered as one being able to incapacitate someone and those that are in the advanced ages have a great-er risk factor of it becoming vgreat-ery sgreat-erious and it
could even lead to death due to asthma29. The
Variable
Difficulty to access health care Registered fall in the last 12 months Fragility (Edmonton Frail Scale) Self-related hypertension Self-related Heart problems
Self-related asthma / bronchial asthma / allergy Race (not white)
Not having private health insurance Admissions to hospital in the last 12 months Self-related diabetes
Self-related arthritis / arthrosis / rheumatism Self-related osteoporosis
Depressive symptoms (GDS-15) Polypharmacy
Self-related urinary incontinence
p-value
0.000 0.010 0.000 0.023 0.046 0.039 0.130 0.520 0.274 0.900 0.163 0.642 0.128 0.197 0.669
RP
2.03 1.69 3.88 1.54 1.57 2.77 0.73 0.73 1.01 0.98 1.17 0.66 1.38 0.12 1.09
Table 5. Results in multi-variate analysis for factors associated with negative self-perception of health amongst
the elderly, Montes Claros (MG) 2013.
IC95%
M
ed
eir
os SM
symptoms include intense difficulty in breathing which exacerbates itself, amongst others, such as a lack of physical strength for the patient to do activities. Asthmatic older people use the hospital more frequently and more of them are admitted to hospital. Similar associations were observed in studies conducted with older people in six mu-nicipalities in Sao Paulo but they evaluated
pul-monary diseases in general30.
Also in this study we noted associations sta-tistically significant between negative self-per-ception of health and the register of difficulties in using the health services. These findings can probably be explained by the fact that negative self-perception of health is strongly related to the presence of morbidity, fragility and other conditions that determine the greater need of seeking out health services. In these conditions a more frequent search means greater difficulties in access and use. A large study conducted in Sao
Paulo31 had already highlighted the association
between negative self-perception of health and greater access to health services and the results of
the studies in Minas Gerais6 and in Rio Grande
do Sul5 also showed this association.
The occurrence of a fall in the last 12 months also associates itself with a negative self-percep-tion of health. The falls bring with them a lot of damage to an older person’s health and amongst them the most common was a facture. Aside from the physical trauma and its results such as pain, fear of falling, functional incapacity and being confined to a bed as well as other conse-quences, all of the above reduce the indepen-dence and quality of life of the older person and in turn brings a worse perception of a person’s state of health. This association has already been
noted in a previous32 study and other authors
have mentioned the association between
neg-ative self-perception of health and the fear33 of
falling or between negative self-perception and low functional capacity including the restriction
on movement34 and difficulties in walking fast18.
Another variable that showed an association with negative self-perception of health was fra-gility recognized as a multi-dimensional geriatric syndrome attributed to multi-systemic deterio-rations of the reserve abilities that results in vul-nerability and the major risk of the occurrence of adverse clinical outcomes. This is a condition
determined by multiple factors (biological, psy-chological and social) that vary from individual
to individual35 and can result in a growing cycle
of debility. It is natural, however, that any level of fragility is associated with a negative perception of health. Such associations have already been
observed in other studies36,37 which reiterated, as
has been highlighted, that the symptoms and the consequences of the diseases, such as pain and limitations, on activities seem to be more strong-ly associated negative self-perception of health than the disease in itself.
The results of the present study ought to be interpreted as shedding light on some limitations. This was a transversal study that only looked at the associations between variables without the possibility of defining the causal relationship. It was also noted that the variables were assessed by information from the elderly and although this was a valid procedure which has been used in various studies, there is a memory limitation as a factor that interferes in a negative way. The low level of education of the studied group can also be considered as a limitation, as it has the potential to compromise the understanding of the investigated questions and the quality of the responses. However, in spite of such limitations, this was an approach based on looking at a pop-ulation which is a segment that is growing na-tionally, in a region that until then had not been studied in this way.
Conclusion
aúd
e C
ole
tiv
a,
21(11):3377-3386,
2016
References
Aguilar-Palacio I, Carrera-Lasfuentes P, Rabanaque MJ. Salud percibida y nivel educativo en España: tendencias por comunidades autónomas y sexo (2001-2012). Gac-eta Sanitaria 2015; 29(1):37-43.
Silva RJS, Smith-Menezes A, Tribess S, Rómo-Perez V, Virtuoso Júnior JS. Prevalência e fatores associados à percepção negativa da saúde em pessoas idosas no Bra-sil. Rev Bras Epidemiol 2012; 15(1):49-62.
Blazer DG. How do you feel about...? Health outcomes in late life and self-perceptions of health and well-be-ing. Gerontologist 2008; 48(4):415-422.
Ocampo-Chaparro JM, Zapata-Ossa HJ, Cubides-Munévar AM, Curcio CL, Villegas JD, Reyes-Ortiz CA. Prevalence of poor self-rated health and associated risk factors among older adults in Cali, Colombia. Colomb Med 2013; 44(4):224-231. Agostinho MR, Oliveira MC, Pinto MEB, Balardin GU, Harzheim E. Autopercepção da saúde entre usuários da Atenção Primária em Porto Alegre, RS. R Bras Med Fam e Comum 2010; 5(17):9-15.
Loyola Filho AI, Firmo JOA, Uchôa E, Lima-Costa MF. Fatores associados à autoavaliação negativa da saúde entre idosos hipertensos e/ou diabéticos: resultados do projeto Bambuí. Rev Bras Epidemiol 2013; 16(3):559-571.
Idler EL, Benyamini Y. Self-rated health and mortality: a review of twenty-seven community studies. J Health Soc Behav 1997; 38(1):21-37.
Veras R. Envelhecimento populacional contemporâ-neo, demandas, desafios e inovações. Rev Saude Publica 2009; 43(3):548-554.
Reichert FF, Loch MR, Capilheira MF. Autopercepção de saúde em adolescentes, adultos e idosos. Cien Saude Colet 2012; 17(12):3353-3362.
Höfelmann DA, Garcia LP, Freitas LRS. Self-rated health in Brazilian adults and elderly: Data from the National Household Sample Survey 2008. Salud Publi-ca Mex 2014; 56(6):603-611.
Minas Gerais. Governo do Estado de Minas Gerais. Ca-derno Regional Norte de Minas. Belo Horizonte: Secre-tária de Estado de Planejamento e Gestão; 2014. [aces-sado 2015 jul 1]. Disponível em: http://www.planeja-mento.mg.gov.br/publicacoes/cadernos-regionais# Instituto Brasileiro de Geografia e Estatística (IBGE). Sinopse do Senso Demográfico de 2010. Rio de Janeiro: IBGE; 2011.
Brasil. Ministério da Saúde (MS). Departamento de Análise de Situação de Saúde. Vigilância de fatores de risco e proteção para doenças crônicas por inquérito tele-fônico: Vigitel 2010. Brasília: MS; 2011.
Fabrício-Wehbe SCC, Schiaveto FV, Vendrusculo TRP, Haas VJ, Dantas RAS, Rodrigues RAP. Adaptação cultu-ral e validade da Edmonton Frail Scale (EFS) em uma amostra de idosos brasileiros. Rev Latino-Am Enferma-gem 2009; 17(6):1043-1049.
Almeida OP, Almeida SA. Confiabilidade da versão brasileira da Escala de Depressão em Geriatria (GDS) versão reduzida. Arq Neuro-Psiquiatr 1999; 57(2-B):421-426.
Lebrão ML, Laurenti R. Saúde, bem-estar e envelheci-mento: o estudo SABE no Município de São Paulo. Rev Bras Epidemiol 2005; 8(2):127-141.
1.
2.
3.
4.
5.
6.
7.
8.
9.
10.
11.
12.
13.
14.
15.
16. Collaborations
M
ed
eir
os SM
Ribeiro TEL, Silva ECF, Meneses SLS, Lopes AJ. Cor-relação dos achados clínicos com os parâmetros fun-cionais em idosos portadores de asma. Rev Portuguesa Pneumol 2009; 15(6):1029-1041.
Francisco PMSB, Donalisio MR, Barros MBA, César CLG, Carandina L, Goldbaum M. Fatores associados à doença pulmonar em idosos. Rev Saude Publica 2006; 40(3):428-435.
Louvison MCP, Lebrão ML, Duarte YAO, Santos JLF, Malik AM, Almeida ES. Desigualdades no uso e acesso aos serviços de saúde entre idosos do município de São Paulo. Rev Saude Publica 2008; 42(4):733-740. Siqueira FV, Facchini LA, Piccini RX, Tomasi E, Thu-mé E, Silveira DS, Vieira V, Hallal PC. Prevalência de quedas em idosos e fatores associados. Rev Saude Pu-blica 2007; 41(5):749-756.
Silva CK, Trelha CS, Silva Junior RA. Fear of falling and self-perception of health in older participants and non-participants of physical activity programs. Motriz: rev educ fis 2013; 19(4):763-769.
Cardoso MC, Marquesan FM, Lindôso ZCL, Schneider R, Gomes I, De Carli GA. Análise da capacidade funcio-nal dos idosos de Porto Alegre e sua associação com au-topercepção de saúde. Estud interdiscipl envelhec 2012; 17(1):111-124.
Fernandes MGM, Andrade NA, Nóbrega MML. An-tecedents of frailty in the elderly: a systematic revision. Online Braz J Nurs 2010; 9(1).
Castelblanque EM, Cuñat VA. Quinénes son ancianos frágiles-ancianos de riesgo? Estudio em personas may-ores de 65 años del área sanitaria de Guadalajara. Med General 2002; 45:443-459.
Rockwood K, Howlett SE, Macknight C, Beattie BL, Bergman H, Hébert R, Hogan DB, Wolfson C, McDow-ell I. Prevalence, attributes, and outcomes of fitness and frailty in community-dwelling older adults: report from the Canadian Study of Health and Aging. J Geron-tol 2004; 59(12):1310-1317.
Article submitted 24/08/2015 Approved on 28/09/2015
Final version submitted 30/09/2015 29.
30.
31.
32.
33.
34.
35.
36.
37. Carvalho FF, Santos JN, Souza LM, Souza NRM. Análi-se da percepção do estado de saúde dos idosos da região metropolitana de Belo Horizonte. Rev Bras Geriatr Ge-rontol 2012; 15(2):285-293.
Bez JPO, Neri AL. Velocidade da marcha, força de preensão e saúde percebida em idosos: dados da rede FIBRA Campinas, São Paulo, Brasil. Cien Saude Colet 2014; 19(8):3343-3353.
Borim FSA, Barros MBA, Neri AL. Autoavaliação da saúde em idosos: pesquisa de base populacional no Município de Campinas, São Paulo, Brasil. Cad Saude Publica 2012; 28(4):769-780.
Rosenkranz RR, Duncan MJ, Rosenkranz SK, Kolt GS. Active lifestyles related to excellent self-rated health and quality of life: cross sectional findings from 194,545 participants in The 45 and Up Study. BMC Public Health 2013, 13:1071.
Eriksson I, Udén AL, Elofsson S. Self-rated health. Comparisons between three different measures. Re-sults from a population study. Int J Epidemiol 2001; 30(2):326-333.
Manor O, Mathews S, Power C. Dichotomous or cat-egorial response? Analysing self-rated health and life-time social class. Int J Epidemiol 2000; 29(1):149-157. Arruda GO, Santos AL, Teston EF, Cecilio HPM, Rado-vanovic CAT, Marcon SS. Associação entre autopercep-ção de saúde e características sociodemográficas com doenças cardiovasculares em indivíduos adultos. Rev Esc Enferm USP 2015; 49(1):61-68.
Campolina AG, Adami F, Santos JLF, Lebrão ML. A transição de saúde e as mudanças na expectativa de vida saudável da população idosa: possíveis impactos da prevenção dedoenças crônicas. Cad Saude Publica 2013; 29(6):1217-1229.
Tavares DMS, Dias FA, Ferreira PCS, Rodrigues LR, Gonçalves JRL, Ferreira LA. Morbidades e qualidade de vida de idosos urbanos com e sem problemas cardíacos Cienc Cuid Saude 2014; 13(4):674-681.
Barbosa BR, Almeida JM, Barbosa MR, Rossi-Barbo-sa LAR. Avaliação da capacidade funcional dos idosos e fatores associados à incapacidade. Cien Saude Colet 2014; 19(8):3317-3325.
Nützel A, Dahlhaus A, Fuchs A, Gensichen J, König HH, Riedel-Heller S. Self-rated health in multi morbid older general practice patients: a cross-sectional study in Germany. BMC Fam Pract 2014; 15:1.
Arbex FS, Almeida EA. Qualidade de vida e hipertensão arterial no envelhecimento. Rev Bras Clin Med 2009; 7(5):339-342.
17.
18.
19.
20.
21.
22.
23.
24.
25.
26.
27.