Rev Bras
Cineantropom
Hum
DOI: http://dx.doi.org/10.5007/1980-0037.2018v20n1p29
original article
Quantitative and qualitative aspects of barriers
to bicycle use for adults from Curitiba, Brazil
Aspectos quantitativos e qualitativos sobre as barreiras
para o uso de bicicleta em adultos de Curitiba, Brasil
Marilson Kienteka1,3
Edina Maria de Camargo1,2,3
Rogério César Fermino3,4
Rodrigo Siqueira Reis1,3,5
Abstract – The implementation of bicycling promotion programs should consider the bar-riers to this behavior. The aim of this study was to quantitative and qualitatively characterize barriers to leisure and commuting bicycle use for adults from Curitiba, Brazil. The first phase comprised a cross-sectional household survey involving 677 adults (53% women). Of these, 16.7% and 11.2% reported leisure and commuting bicycle use, respectively. Then, 24 bicycle users (50% women) were recruited and participated in focus group interviews. The content of answers was analyzed with a conceptual matrix. The most reported barriers to leisure bicycle use were “bad weather” (65.5%), “heavy traffic” (53.1%), “lack of bike lanes” (48.7%) and “lack of security “(44.2%). In commuting, the most reported were “bad weather” (69.7%), “heavy traffic”, “lack of safety” and “fear of accidents” (51.3% each). The comparative analysis between barriers reported in the survey and those reported in the focus groups showed a combination of seven of the 11 barriers reported in questionnaires. Some of the barriers identified in the survey were not mentioned in the focus groups (“poor street quality”, “pollution”, “not having a bicycle”, “lack of parking”, “distance to destinations”). The main barriers to bicycle use are related to physical environment and safety aspects, regardless of approach adopted and purpose of use.
Key words: Bicycling; Epidemiologic factors; Epidemiologic studies; Motor activity; Quantitative analysis; Qualitative research.
Resumo – A implementação de programas de promoção para o uso de bicicleta deve considerar as barreiras para este comportamento. Objetivou-se caracterizar quantitativa e qualitativamente as barreiras para o uso de bicicleta no lazer e no transporte em adultos de Curitiba, Brasil. A primeira etapa compreendeu um inquérito domiciliar transversal em que participaram 677 adultos (53% mulheres). Destes, 16,7% e 11,2% reportaram utilizar a bicicleta no tempo de lazer e no transporte, respectivamente. Em seguida, 24 usuários de bicicleta (50% mulheres) foram recrutados e participaram de entrevistas em grupos focais. O conteúdo das respostas foi analisado com uma matriz conceitual. As barreiras mais reportadas para o uso de bicicleta no lazer foram o “clima ruim” (65,5%), “tráfego intenso” (53,1%), “falta de ciclovias” (48,7%) e “falta de segurança” (44,2%). No transporte, as mais relatadas foram o “clima ruim” (69,7%), “tráfego intenso”, “falta de segurança” e “medo de acidentes” (51,3% cada). A análise compara-tiva entre as barreiras reportadas no inquérito e aquelas relatadas nos grupos focais mostraram combinação entre sete das 11 barreiras. Algumas barreiras identificadas no inquérito não foram mencionadas nos grupos focais (“má qualidade das ruas”, “poluição”, “não ter bicicleta”, “falta de estacionamento”, “distância até os destinos”). As principais barreiras para o uso de bicicleta estão relacionadas com aspectos do ambiente físico e segurança, independente da abordagem empregada e finalidade de uso.
1 Federal University of Paraná. Gra-duate Program in Physical Education. Curitiba, PR. Brazil.
2 Federal University of Paraná. Cen-ter for Physical Activity and Health Studies, Curitiba, PR. Brazil.
3 Pontifical Catholic University of Paraná. Research Group on Physical Activity and Quality of Life. Curitiba, PR. Brazil.
4 Federal Technological University of Paraná. Graduate Program in Physical Education. Research Group on Environment, Physical Activity and Health. Curitiba, PR. Brazil.
5 Washington University in St. Louis. Brown School. Prevention Research Center. St. Louis, MO. United States of America.
Received: September 02, 2017
INTRODUCTION
Bicycle is an advantageous means of commuting and physical activity (PA) promotion. In general, bicycle offers a relatively inexpensive and accessible way for a great part of the population1, without requiring large investments from the public administration in terms of infrastructure2,1. In addition, its use is associated with several health benefits1,3 and is often considered important for the reduction of physical inactivity4, which is one of the main causes of morbidities worldwide5. In addition to individual aspects, bicycle use can contribute to the reduction of traffic jams, consequent reduction of carbon emissions and consumption of fossil fuels6. Despite these benefits, bicycle use is still low in countries regardless of high7 or middle-low income8.
The low frequency of bicycle use may be related to social and envi-ronmental aspects that possibly influence this behavior9, such as cycling infrastructure2, traffic volume, aggressive behavior of drivers, protection of cyclists in traffic1,2,4 and distance to destinations8, among others. In ad-dition, individual characteristics such as gender, age and schooling have also been related to the use of bicycles10. These characteristics can influence the perception of people in relation to leisure or commuting bicycle use11.
The perception of barriers is important to identify individual, social or environmental aspects that are relevant to the implementation of programs to promote the use bicycles in the community2,10,12. However, studies are in general conducted with standardized questionnaires13, which limit the understanding of aspects that are not represented in the instrument. For this reason, studies with qualitative approaches have been used to capture contextual aspects, and thus, give greater meaning to perceptions about bicycle use 14. However, these studies have limitations on the generalization of their results15. In this sense, the use of mixed quantitative and qualitative method has been proposed to reduce the inherent limitations of studies that include only one approach16.
One of the important factors for success in promoting physical activ-ity is to identify aspects that limit the participation and/or maintenance of individuals in the practice17. Therefore, analyzing barriers to bicycle use may represent an advance in the identification of aspects that may limit the implementation of incentive programs in this modality in the community2. In Brazil, although some studies have explored barriers to bicycle use for adults13,14,18, there are no studies that have used mixed approaches15. Thus, the aim of this study was to quantitatively and qualitatively characterize barriers to leisure and commuting bicycle use for adults from Curitiba, Paraná, Brazil.
METHODOLOGICAL PROCEDURES
cross-sectional study with home interviews was conducted to identify the association between the characteristics of the built environment and the practice of physical activity in adults (aged 18-65 years) living in different census tracts in the city8,19. To that end, 32 census tracts were intentionally selected (16 with a high walkability score [8 with low income and 8 with high income] and 16 with low walkability [8 with low income and 8 with high income]). Further details on the selection of sectors, residences and participants are available in literature8,19.
In total, 1,052 households were visited, 697 people were interviewed and the refusal rate for participation in the study was 34%. About 17% and 11% of respondents reported using the bicycle at leisure (n = 113) and for commuting (n = 76), respectively (table 1). Interviewees were invited to participate in focus group interviews to identify barriers and facilitators for bicycle use (qualitative aspect)14.
Both phases of the project were approved by the Ethics Research Committee of the Pontifical Catholic University of Paraná (quantitative study: 3034/2009 | qualitative study: 5418/2011) and individuals agreed to voluntarily participate in the research by signing the free and informed consent form.
QUANTITATIVE ASPECTS
Barriers for bicycle use
Barriers for bicycle use for leisure and commuting were identified in a spe-cific way, with a previously validated questionnaire13. Participants reported the presence (“no”, “yes”) of some barrier that could hinder cycling at leisure (“heavy traffic”, “bad weather”, “lack of safety”, “fear of accidents”, “lack of will”, “poor quality of streets”, “not having a bicycle”, “lack of bicycle lanes”, “lack of parking”, “pollution”, “lack of support”) and in commuting (“heavy traffic” “bad weather”, “lack of safety”, “fear of accidents”, “lack of will”, “poor quality of streets”, “not having a bicycle”, “distance to destinations”, “lack of parking”, “lack of changing rooms”, “pollution”).
Individual, sociodemographic, health and behavioral variables
Based on a literature review and a conceptual model10,20, some individual, sociodemographic, health and behavioral variables potentially associated with barriers and/or bicycle use were identified: gender, age, marital status, schooling, socioeconomic level, number of motor vehicles in the residence, body mass index, health perception, quality of life and level of physical activity. These variables were measured and used in analyses.
on data collected, individuals were classified into two levels: “low” (classes C1 + C2 + D + E) and “intermediate / high” (B1 + B2 + A1 + A2). The number of motor vehicles in the residence was classified into two categories (“0” and “≥ 1”)8.
Body mass index (BMI) was calculated with self-reported measures of body mass (kg) and height (cm), and classified into two categories (“≤ 24.9” and “≥ 25.0” kg/m2)8. Health perception and quality of life were measured with a questionnaire from the World Health Organization (WHOQOL) and classified as “negative” and “positive” perception23.
The practice of walking at leisure, commuting and total physical activity in the last week was identified with the long version of the International Physical Activity Questionnaire24. The walking scores were attributed by the product between the weekly frequency and the average time spent in each activity. While the total leisure physical activity score was identified by the equation: [min/wk of walking + min/wk moderate activity + (min/ wk vigorous activity x 2)]. Leisure and commuting walking, and total leisure physical activity were classified into two levels (“0-149 min/wk” and “≥150 min/wk”)8. The purpose of bicycle use (leisure and commuting) was measured based on the dichotomous response (“no”, “yes”) to the fol-lowing questions: “Do you use bicycle in your leisure time?” And “Do you use bicycle to go from one place for another as a form of commuting?”8,24.
Qualitative aspects
After collecting quantitative data, participants who reported using bicycles at leisure or commuting were eligible to participate in focus groups. This technique was used to identify participants’ feelings, perceptions, attitudes and ideas about barriers to bicycle use in order to complement informa-tion collected in the household survey, which presented quesinforma-tions with dichotomous responses14,25.
Elaboration of focus groups and data collection
The number of participants in each group was determined according to lit-erature recommendations16, which suggests a maximum of 12 individuals per focal group. Thus, 48 subjects were invited to participate, 12 in each of the four groups, subdivided by sex, to attend at a scheduled time and place. At the end, 24 individuals accepted to participate and attended the interviews14.
started with the authorization of participants and finalized after the end of the discussion. All discussions were conducted in an appropriate room, soundproofed, on the premises of the university14.
Data analysis
• Analysis of quantitative data
Barriers to leisure and commuting bicycle use were analyzed by absolute and relative frequency distribution. The association between individual, sociode-mographic, health and behavioral variables with barriers to bicycle use was analyzed with the chi-square test of heterogeneity in SPSS 20.0 software.
• Analysis of qualitative data
The files of recordings of focus groups were transcribed in full, each par-ticipant being assigned a code (P1, P2, ...) to maintain anonymity. The content analysis was then applied using Atlas.ti software 5.0. Initially, reports were grouped according to their negative influence on bicycle use. For example, the report “...the lack of a bicycle lane makes it difficult to use a bicycle, as well as the lack of safety,... I often give up for fear”, was classified as a barrier14,25.
• Description of reports according to barriers
A comparative matrix was elaborated with the aim of combining reports of bar-riers to leisure and commuting bicycle use according to the most self-reported barriers in the quantitative analyses. For this combination, reports that best exemplify barriers identified in the qualitative aspect were selected. Further-more, barriers were classified according to influence factors and grouped into dimensions14,25. This grouping was carried out with the aim of identifying the influence factors found and the dimensions to which they belong.
RESULTS
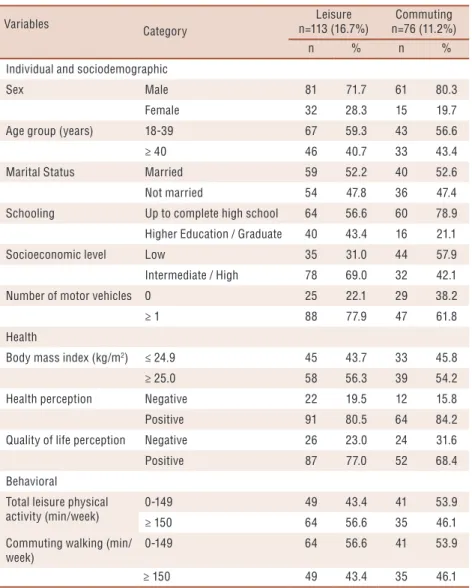
Among participants who reported using leisure cycling (n = 113), the highest proportion were males (71.7%), aged 18-39 years (59.3%), mar-ried (52.2%), reported having completed high school (56.6%), belong to intermediate/high socioeconomic level (69.0%) and had at least one motor vehicle in the residence (77.9%) (Table 1). Regarding health variables, the highest proportion had BMI ≥25 kg/m2 (56.3%), positive health perception (80.5%) and quality of life (77.0%). The majority of participants performed ≥150 min/week total physical activity at leisure time (56.6%) and walked 0-149 min/week in commuting (56.6%) (Table 1). Participants who reported commuting bicycle use (n = 76) had similar profile, except for the lower schooling level f (78.9%), low socioeconomic level (57.9%) and lower total leisure time physical activity (53.9%) (Table 1).
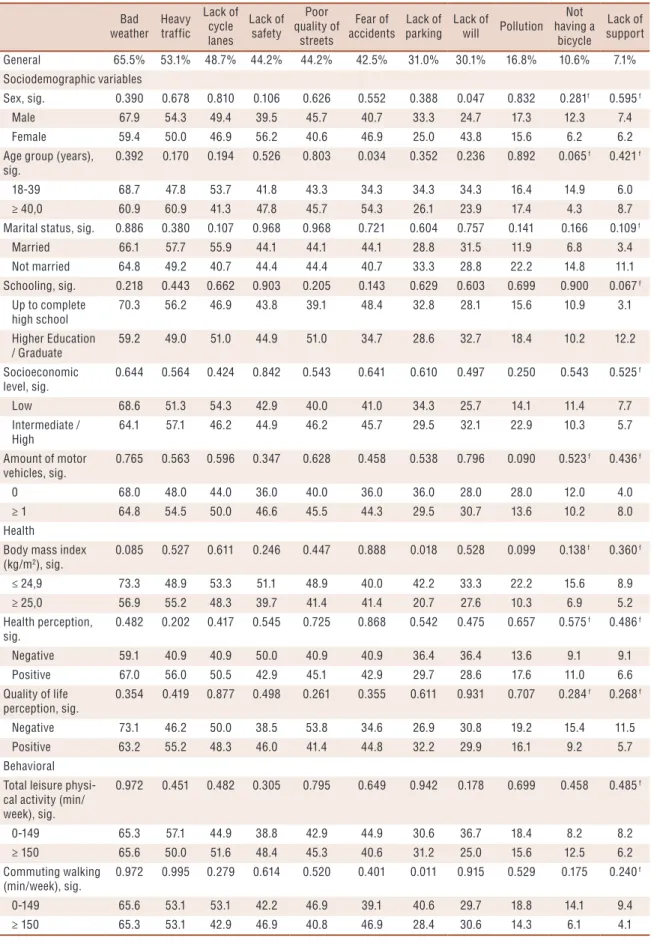
Quantitative aspects of barriers to bicycle use
most and least reported barriers to leisure bicycle use (Table 2). Female gender was associated with the “lack of will” barrier (p = 0.047), age range ≥40 years with “fear of accidents” (p = 0.034), while BMI ≤24.9 kg / m2 (p = 0.018) and lower commuting walking volume (0-149 min / wk), were associated with the “lack of parking” barrier (p = 0.011) (Table 2).
Table 1. Individual, sociodemographic, health and behavioral characteristics of participants by purpose of use. Curitiba, Brazil, 2010.
Variables
Category
Leisure n=113 (16.7%)
Commuting n=76 (11.2%)
n % n %
Individual and sociodemographic
Sex Male 81 71.7 61 80.3
Female 32 28.3 15 19.7
Age group (years) 18-39 67 59.3 43 56.6
≥ 40 46 40.7 33 43.4
Marital Status Married 59 52.2 40 52.6
Not married 54 47.8 36 47.4
Schooling Up to complete high school 64 56.6 60 78.9 Higher Education / Graduate 40 43.4 16 21.1
Socioeconomic level Low 35 31.0 44 57.9
Intermediate / High 78 69.0 32 42.1
Number of motor vehicles 0 25 22.1 29 38.2
≥ 1 88 77.9 47 61.8
Health
Body mass index (kg/m2) ≤ 24.9 45 43.7 33 45.8
≥ 25.0 58 56.3 39 54.2
Health perception Negative 22 19.5 12 15.8
Positive 91 80.5 64 84.2
Quality of life perception Negative 26 23.0 24 31.6
Positive 87 77.0 52 68.4
Behavioral
Total leisure physical activity (min/week)
0-149 49 43.4 41 53.9
≥ 150 64 56.6 35 46.1
Commuting walking (min/ week)
0-149 64 56.6 41 53.9
≥ 150 49 43.4 35 46.1
Table 2. Frequency of barriers to leisure bicycle use according to individual, sociodemographic, health and behavioral variables. Curitiba, Brazil, 2010 (n = 113).
Bad weather
Heavy traffic
Lack of cycle lanes
Lack of safety
Poor quality of
streets
Fear of accidents
Lack of parking
Lack of
will Pollution Not having a
bicycle
Lack of support
General 65.5% 53.1% 48.7% 44.2% 44.2% 42.5% 31.0% 30.1% 16.8% 10.6% 7.1% Sociodemographic variables
Sex, sig. 0.390 0.678 0.810 0.106 0.626 0.552 0.388 0.047 0.832 0.281f 0.595 f
Male 67.9 54.3 49.4 39.5 45.7 40.7 33.3 24.7 17.3 12.3 7.4
Female 59.4 50.0 46.9 56.2 40.6 46.9 25.0 43.8 15.6 6.2 6.2
Age group (years), sig.
0.392 0.170 0.194 0.526 0.803 0.034 0.352 0.236 0.892 0.065 f 0.421 f
18-39 68.7 47.8 53.7 41.8 43.3 34.3 34.3 34.3 16.4 14.9 6.0
≥ 40,0 60.9 60.9 41.3 47.8 45.7 54.3 26.1 23.9 17.4 4.3 8.7
Marital status, sig. 0.886 0.380 0.107 0.968 0.968 0.721 0.604 0.757 0.141 0.166 0.109 f
Married 66.1 57.7 55.9 44.1 44.1 44.1 28.8 31.5 11.9 6.8 3.4
Not married 64.8 49.2 40.7 44.4 44.4 40.7 33.3 28.8 22.2 14.8 11.1 Schooling, sig. 0.218 0.443 0.662 0.903 0.205 0.143 0.629 0.603 0.699 0.900 0.067 f
Up to complete high school
70.3 56.2 46.9 43.8 39.1 48.4 32.8 28.1 15.6 10.9 3.1
Higher Education / Graduate
59.2 49.0 51.0 44.9 51.0 34.7 28.6 32.7 18.4 10.2 12.2
Socioeconomic level, sig.
0.644 0.564 0.424 0.842 0.543 0.641 0.610 0.497 0.250 0.543 0.525 f
Low 68.6 51.3 54.3 42.9 40.0 41.0 34.3 25.7 14.1 11.4 7.7
Intermediate / High
64.1 57.1 46.2 44.9 46.2 45.7 29.5 32.1 22.9 10.3 5.7
Amount of motor vehicles, sig.
0.765 0.563 0.596 0.347 0.628 0.458 0.538 0.796 0.090 0.523 f 0.436 f
0 68.0 48.0 44.0 36.0 40.0 36.0 36.0 28.0 28.0 12.0 4.0
≥ 1 64.8 54.5 50.0 46.6 45.5 44.3 29.5 30.7 13.6 10.2 8.0
Health
Body mass index (kg/m2), sig.
0.085 0.527 0.611 0.246 0.447 0.888 0.018 0.528 0.099 0.138 f 0.360 f
≤ 24,9 73.3 48.9 53.3 51.1 48.9 40.0 42.2 33.3 22.2 15.6 8.9
≥ 25,0 56.9 55.2 48.3 39.7 41.4 41.4 20.7 27.6 10.3 6.9 5.2
Health perception, sig.
0.482 0.202 0.417 0.545 0.725 0.868 0.542 0.475 0.657 0.575 f 0.486 f
Negative 59.1 40.9 40.9 50.0 40.9 40.9 36.4 36.4 13.6 9.1 9.1
Positive 67.0 56.0 50.5 42.9 45.1 42.9 29.7 28.6 17.6 11.0 6.6 Quality of life
perception, sig.
0.354 0.419 0.877 0.498 0.261 0.355 0.611 0.931 0.707 0.284 f 0.268 f
Negative 73.1 46.2 50.0 38.5 53.8 34.6 26.9 30.8 19.2 15.4 11.5
Positive 63.2 55.2 48.3 46.0 41.4 44.8 32.2 29.9 16.1 9.2 5.7
Behavioral Total leisure physi-cal activity (min/ week), sig.
0.972 0.451 0.482 0.305 0.795 0.649 0.942 0.178 0.699 0.458 0.485 f
0-149 65.3 57.1 44.9 38.8 42.9 44.9 30.6 36.7 18.4 8.2 8.2
≥ 150 65.6 50.0 51.6 48.4 45.3 40.6 31.2 25.0 15.6 12.5 6.2
Commuting walking (min/week), sig.
0.972 0.995 0.279 0.614 0.520 0.401 0.011 0.915 0.529 0.175 0.240 f
0-149 65.6 53.1 53.1 42.2 46.9 39.1 40.6 29.7 18.8 14.1 9.4
≥ 150 65.3 53.1 42.9 46.9 40.8 46.9 28.4 30.6 14.3 6.1 4.1
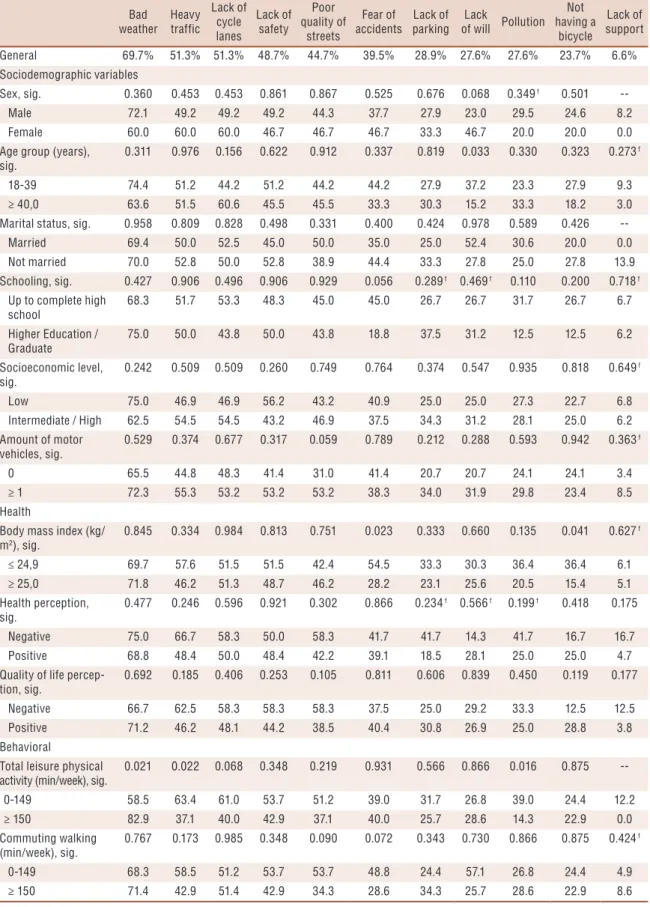
Table 3. Frequency of barriers for commuting bicycle use according to individual, sociodemographic, health and behavioral variables. Curitiba, Brazil, 2010 (n = 76).
Bad weather
Heavy traffic
Lack of cycle lanes
Lack of safety
Poor quality of
streets
Fear of accidents
Lack of parking
Lack
of will Pollution Not having a
bicycle
Lack of support
General 69.7% 51.3% 51.3% 48.7% 44.7% 39.5% 28.9% 27.6% 27.6% 23.7% 6.6% Sociodemographic variables
Sex, sig. 0.360 0.453 0.453 0.861 0.867 0.525 0.676 0.068 0.349 f 0.501
--Male 72.1 49.2 49.2 49.2 44.3 37.7 27.9 23.0 29.5 24.6 8.2
Female 60.0 60.0 60.0 46.7 46.7 46.7 33.3 46.7 20.0 20.0 0.0
Age group (years), sig.
0.311 0.976 0.156 0.622 0.912 0.337 0.819 0.033 0.330 0.323 0.273 f
18-39 74.4 51.2 44.2 51.2 44.2 44.2 27.9 37.2 23.3 27.9 9.3
≥ 40,0 63.6 51.5 60.6 45.5 45.5 33.3 30.3 15.2 33.3 18.2 3.0
Marital status, sig. 0.958 0.809 0.828 0.498 0.331 0.400 0.424 0.978 0.589 0.426
--Married 69.4 50.0 52.5 45.0 50.0 35.0 25.0 52.4 30.6 20.0 0.0
Not married 70.0 52.8 50.0 52.8 38.9 44.4 33.3 27.8 25.0 27.8 13.9 Schooling, sig. 0.427 0.906 0.496 0.906 0.929 0.056 0.289 f 0.469 f 0.110 0.200 0.718 f
Up to complete high school
68.3 51.7 53.3 48.3 45.0 45.0 26.7 26.7 31.7 26.7 6.7
Higher Education / Graduate
75.0 50.0 43.8 50.0 43.8 18.8 37.5 31.2 12.5 12.5 6.2
Socioeconomic level, sig.
0.242 0.509 0.509 0.260 0.749 0.764 0.374 0.547 0.935 0.818 0.649 f
Low 75.0 46.9 46.9 56.2 43.2 40.9 25.0 25.0 27.3 22.7 6.8
Intermediate / High 62.5 54.5 54.5 43.2 46.9 37.5 34.3 31.2 28.1 25.0 6.2 Amount of motor
vehicles, sig.
0.529 0.374 0.677 0.317 0.059 0.789 0.212 0.288 0.593 0.942 0.363 f
0 65.5 44.8 48.3 41.4 31.0 41.4 20.7 20.7 24.1 24.1 3.4
≥ 1 72.3 55.3 53.2 53.2 53.2 38.3 34.0 31.9 29.8 23.4 8.5
Health
Body mass index (kg/ m2), sig.
0.845 0.334 0.984 0.813 0.751 0.023 0.333 0.660 0.135 0.041 0.627 f
≤ 24,9 69.7 57.6 51.5 51.5 42.4 54.5 33.3 30.3 36.4 36.4 6.1
≥ 25,0 71.8 46.2 51.3 48.7 46.2 28.2 23.1 25.6 20.5 15.4 5.1
Health perception, sig.
0.477 0.246 0.596 0.921 0.302 0.866 0.234 f 0.566 f 0.199 f 0.418 0.175
Negative 75.0 66.7 58.3 50.0 58.3 41.7 41.7 14.3 41.7 16.7 16.7 Positive 68.8 48.4 50.0 48.4 42.2 39.1 18.5 28.1 25.0 25.0 4.7 Quality of life
percep-tion, sig.
0.692 0.185 0.406 0.253 0.105 0.811 0.606 0.839 0.450 0.119 0.177
Negative 66.7 62.5 58.3 58.3 58.3 37.5 25.0 29.2 33.3 12.5 12.5 Positive 71.2 46.2 48.1 44.2 38.5 40.4 30.8 26.9 25.0 28.8 3.8 Behavioral
Total leisure physical activity (min/week), sig.
0.021 0.022 0.068 0.348 0.219 0.931 0.566 0.866 0.016 0.875
--0-149 58.5 63.4 61.0 53.7 51.2 39.0 31.7 26.8 39.0 24.4 12.2
≥ 150 82.9 37.1 40.0 42.9 37.1 40.0 25.7 28.6 14.3 22.9 0.0
Commuting walking (min/week), sig.
0.767 0.173 0.985 0.348 0.090 0.072 0.343 0.730 0.866 0.875 0.424 f
0-149 68.3 58.5 51.2 53.7 53.7 48.8 24.4 57.1 26.8 24.4 4.9
≥ 150 71.4 42.9 51.4 42.9 34.3 28.6 34.3 25.7 28.6 22.9 8.6
Quantitative and qualitative aspects of barriers to bicycle use
Box 1 presents the reports of barriers to leisure bicycle use, identified in focus group interviews (qualitative aspect) according to barriers reported by questionnaire (quantitative aspect). Participants did not mention reports about the “poor quality of streets”, “lack of parking”, “pollution” and “not having a bicycle” barriers. Reports of barriers to commuting bicycle use are presented in Box 2. Participants did not mention “poor quality of streets”, “distance to destinations”, “pollution” and “not having a bicycle”.
Box 1. Barriers to leisure bicycle use identified in focus groups and in questionnaire interviews.
Reports from focus group Frequency of
self-reported barriers Reports from focus group
Environment
“... Curitiba in particular rains a lot. For women, it is more complicated, rain and cold discourages cycling, I prefer to use the car these days ... “
Bad weather 65.5%
“... when it rains, I do other things. I get out of by car. I only use it if it does not rain. Be-cause I always ride my bicycle with the kids when it does not rain. “
“... People use the bicycle on the street, with all the traffic problems, lack of respect ... we need space to use the bicycle safely ...”
Heavy traffic 53.1%
“... we use it more at the weekend and we are always with the children, I always perceive the lack of respect from some drivers, which discourages. “
“... I get out of the car and take the bicycle to use in the park, because bicycle paths are poorly maintained, maintenance is bad ...”
Lack of cycle lanes 48.7%
“... There are bicycle lanes that connect parks. But to get from the neighborhood to these bicycle paths, we use the street. It’s complicated, they need to increase bicycle lanes that leave the neighborhoods, so that we can also walk ... “
“... as much as the park has security, guards, I like to be together. In parks and squares that do not have security, we do not go by bicycle. I’m afraid they steal it”
Lack of safety 44.2%
“... in the park, I do not see any problems. But as long as I am with them (“children”). I’m afraid they’ll steal them (“children”), do some violence with them (“children”) to steal their bike ... “
Intrapersonal
“... bicycle is not respected in traffic, lack of respect, lack of culture. Many times I stopped using it because I felt frightened about the fact of respect in traffic “
Fear of accidents 42.5%
“... I’m afraid sometimes because women are more vulnerable. Many times I stopped using my bike because I felt afraid in a certain neighborhood or at certain times of the day / night. “
“... if I have a lot of things to study over the weekend, I’m not in the mood. It gives laziness. It’s so complicated when it’s up to me ... “
Lack of will 30.1%
“... sometimes I’m lazy if I’m alone. When I’m alone, I’m not in the mood. It seems that I do not have the strength alone, I do not have the courage ... “
Interpersonal
“... if I have company I go every day. Because with a friend it is better, time passes faster, is safer, is fun. Otherwise I do not feel like it. “
Lack of support 7.1%
Box 2. Barriers to commuting bicycle use identified in focus groups and in questionnaire interviews.
Reports from focus group Frequency of self-reported barriers
Reports from focus group
Environment “... the rain becomes a barrier because we do not have a shower at work. If we had, I would not care for the weather (cold, heat, rain ...)
Bad weather 69.7%
“With rain and cold I do not use it. As the climate in Curitiba is colder and rainier, I am sincere, I do not use a bicycle every day, I rather use the car ... “
“... if there were laws and if they were ful-filled, heavy traffic should not be a problem, because cars and bicycles would comply with the established law, what they need are laws and compliance ...”
Heavy traffic 51.3%
“... with women it is more complicated, they offend, they speak rude, as if we were disturbing the traffic and in fact we want to reduce the traffic with the bicycle ...”
“... I was already robbed going to work. Now we only go in two, me and my friend from work. My wife was robbed too. She does not use it anymore. “
Lack of safety 51.3%
“I am afraid about my children and my wife. It’s dangerous. “
Intrapersonal “... cars do not respect the space between car and bicycle ...”
Fear of accidents 44.7%
“...They always throw the car on the bicycle and still offend, as if the space was only for the car ...”
Environment “... I worry about where to leave it, some-times I stop using it if I know I will not have a place to keep it”
Lack of parking 39.5%
“... Even to go to the pharmacy, market and others. If I know where to park I use it, if not, I do not use it ... “
Intrapersonal “I’m lazy sometimes, not every day I use it. For example, when I have a meeting, I do not feel like it. And there are days that we want to wear other clothes, jump, skirt ... these days I do not feel like it, but it’s a day or another that it happens ... “
Lack of will 28.9%
“... the reasons for not using are other. But every now and then my will to use loses to the weather, especially cold and rain, I do not have the courage ... “
Environment “... what’s troubling is not having a shower. Because we need to take a shower when we get there, we need to change clothes. I believe that people do not use it, because they have nowhere to change, to take a shower ... “
Lack of changing rooms
23.7%
“... companies need to put changing rooms for employees, it would make a lot of differ-ence. Why do many women worry about the clothes they will wear, with the bath. And they stop using it because they cannot be sweaty all day ... “.
DISCUSSION
support from close people”).
A recent literature review has shown that the physical (“lack of bicycle lanes”), natural (“bad weather”) and social environment (“support from friends”), as well as individual (sex and age) and psychosocial characteristics (“lack of will” and “low self-efficacy”) are associated with barriers to leisure and commuting bicycle use12. These findings corroborate those found in the present study, where the most reported barriers were “bad weather”, “heavy traffic”, “lack of safety” (leisure and commuting) and “lack of bicycle lanes” (leisure). In part, these results can be explained by low urban plan-ning, with inadequate structures for bicycle use, associated with intense traffic in most cities, which cause greater sensation of fear of accidents10. The high number of rainy days or low temperatures in Curitiba may have contributed to the high frequency of reports of “bad weather” barrier. For example, in the year of the survey, rainfall occurred on 44% of days26.
Among the 11 barriers for commuting bicycle use examined in this study, more than half (55%) had some association with the tested variables. Among sociodemographic variables, only the “distance to destinations” barrier was associated with the age group. For health variables, “lack of parking” and “lack of changing rooms” barriers were the only that showed association with BMI. As for leisure bicycle use, only 27% of barriers (3/11) tested were associated with the examined variables. Among sociodemo-graphic variables, sex was related to “lack of will”; and the age group with “fear of accidents”. For health and behavioral aspects, BMI and commuting walking were related to “lack of parking”. Only one study that analyzed the association between presence of barriers to physical activity practice and some of these variables in adults was found 27, corroborating the presence of barriers associated in the present study, such as age and BMI27. Several reasons may explain some of these associations in leisure and commuting bicycle use. For example, distance to work10, especially when it is greater than 4 km, may be related to low self-efficacy of overcoming major courses, which may be influenced by the quality of the environment20 and the lack of company or invitation from friends or family28, as well as lack of safe places to park the bicycle and lack of changing rooms in the workplace, representing an important barrier due to the fear of having the bicycle stolen and the discomfort of being sweaty during the workday10. Several studies have shown positive association between having a bicycle and its use during leisure or commuting and consequently higher total physical activity indexes8,10,11.
commuting. On the other hand, some barriers to bicycle use, identified by the questionnaire, did not present combinations with reports mentioned by the focus groups, being “poor quality of streets”, “pollution” and “not having a bicycle” for both use modalities; and specifically for leisure, “lack of parking” and for commuting “distance to destinations”.
The reports identified in the focus group interviews contributed to the identification of the main barriers to bicycle use. For example, the reports referring to “heavy traffic” presented differences between sexes, regardless of purpose of use. Women reported problems of verbal disrespect of drivers who feel disturbed by the presence of bicycles (Leisure: “... we use it more at the weekend and we are always with the children, I always perceive the lack of respect from some drivers, which discourages”. Commuting: “... with women it is more complicated, they offend, they speak rude, as if we were disturbing the traffic and in fact we want to reduce traffic with the use of bicycle…”. However, men report problems related to the lack of respect by drivers and lack of supervision of traffic laws (Leisure: “... even if there are laws for cycling, many drivers do not respect. They think the bike is there to hinder traffic...”. Commuting: “... if there are laws and they are enforced, heavy traffic should not be a problem, why cars and bicycles would comply with the established law, what they need are laws and compliance ...”. On the other hand, other barriers presented similar reports between sexes. For example, for the “fear of accidents” barrier to leisure bicycle use, men and women reported lack of respect from drivers (Men: “... they always throw the car on the bike and still offend, as if the space was just for cars ... “. Women: “... cars do not respect the space between car and bicycle ... “. Similar reports, among others, have been identified in literature, which vary by sex, purpose of use, weather and cultural aspects related to bicycle use in each country12.
CONCLUSION
The main barriers to bicycle use are related to aspects of the physical envi-ronment and safety, regardless of approach adopted and purpose of use. The results obtained by the household survey and focus group interviews showed similarity in the most reported barriers. The results reinforce the importance of public and traffic safety, as well as the implementation and improvement of cycling structures and the prioritization of traffic education. Future stud-ies could analyze the cost-effectiveness of environmental interventions, the cycling structure of cities, use of bicycles and perception of barriers.
Acknowledgments
This study was funded by the National Institutes of Health (NIH) R01 CA127296. NCI. Marilson Kienteka received grant from the Coordina-tion for the Improvement of Higher EducaCoordina-tion Personnel (CAPES) during his PhD course.
REFERENCES
1. Butler GP, Orpana HM, Wiens AJ. By your own two feet: Factors associated with active transportation in Canada. Can J Public Health 2007;98(4):259–264.
2. Pucher J, Dill J, Handy S. Infrastructure, programs, and policies to increase bicy-cling: An international review. Prev Med 2010;50(Suppl.):106–125.
3. Oja P, Titze S, Bauman A, de Geus B, Krenn P, Reger-Nash B, et al. Health ben-efits of cycling: A systematic review. Scand J Med Sci Sports 2011;21(4):496–509.
4. Engbers LH, Hendriksen IJ. Characteristics of a population of commuter cyclists in the Netherlands: perceived barriers and facilitators in the personal, social and physical environment. Int J Behav Nutr Phys Act 2010;7:89.
5. Sallis JF, Bull F, Guthold R, Health G, Inoue S, Kelly P, et al. Progress in physi-cal activity over the Olympic quadrennium. Lancet 2016;388(10051):1325–1336.
6. Woodcock J, Banister D, Edwards P, Prentice A, Roberts I. Energy and transport. Lancet 2007;370(9592):1078–1088.
7. Sener I, Eluru N, Bhat C. An analysis of bicycle route choice preferences in Texas, US. Transportation 2009;36(5):511–539.
8. Kienteka M, Reis RS, Rech CR. Personal and behavioral factors associated with bicycling in adults from Curitiba, Paraná State, Brazil. Cad Saude Publica 2014;30(1):79–87.
9. Chataway E, Kaplan S, Nielsen T, Prato C. Safety perceptions and reported behavior related to cycling in mixed traffic: A comparison between Brisbane and Copenhagen. Transp Res Part F Traffic Psychol Behav 2014;23:32–43.
10. Kienteka M, Fermino RC, Reis RS. Fatores individuais e ambientais associados com o uso de bicicleta por adultos: Uma revisão sistemática. Rev Bras Ativ Fís Saúde 2014;19(1):12–24.
11. Dill J, McNeil N. Four types of cyclists? Examination of typology for better understanding of bicycling behavior and potential. Transp Res Rec J Transp Res Board 2013;2387:129–138.
12. Camargo EM, Fermino RC, Reis RS. Barriers and facilitators to bicycle use in adults: A systematic review. Rev Bras Ativ Fís Saúde 2015;20(2):103–112.
13. Kienteka M, Rech CR, Fermino RC, Reis RS. Validade e fidedignidade de um instrumento para avaliar as barreiras para o uso de bicicleta em adultos. Rev Bras Cineantropom Desempenho Hum 2012;14(6):624–635.
CORRESPONDING AUTHOR
Marilson Kienteka
Pontifícia Universidade Católica do Paraná.
Grupo de Pesquisa em Atividade Física e Qualidade de Vida (GPAQ). Rua Imaculada Conceição, 1.155 – Prado Velho, 80215-901, Curitiba-PR, Brasil.
Email: marilson_kienteka@hotmail. com
15. Hallal PC, Knuth AG. Epidemiologia da atividade física e a aproximação necessária com as pesquisas qualitativas. Rev Bras Ciências do Esporte 2011;33(1):181–192.
16. Turato ER. Métodos qualitativos e quantitativos na área da saúde: definições, diferenças e seus objetos de pesquisa. Rev Saúde Pública 2005;39(3):507–514.
17. Sallis JF, Cervero RB, Ascher W, Ascher W, Henderson K, Kraft M, Kerr J. An ecological approach to creating active living communities. Annu Rev Public Health 2006;27:297–322.
18. Sousa A, Sanches SP, Ferreira M. Perception of Barriers for the Use of Bicycles. Procedia - Soc Behav Sci 2014;160:304–313.
19. Hino AAF, Rech CR, Gonçalves PB, Hallal P, Reis RS. Project ESPAÇOS of Curitiba, Brazil: Applicability of mixed research methods and geo-referenced information in studies about physical activity and built environments. Rev Panam Salud Public 2012;32(3):226–232.
20. Saelens BE, Sallis JF, Frank LD. Environmental correlates of walking and cycling: Findings from the transportation, urban design, and planning literatures. Ann Behav Med Publ Soc Behav Med 2003;25(2):80–91.
21. ABEP. Associação Brasiliera de Empresa de Pesquisa. Critério de classificação econômica do Brasil. 2017; Available from: <http://www.abep.org/criterio-brasil>[ 2017 jun 12].
22. Word Health Organization. Global recomendations on Phisycal activity for health. 2017; Available from: <http://www.who.int>[2017 jun 12].
23. Fleck MP, Louzada S, Xavier M, Chachamovich E, Vieira G, Santos L, et al. Application of the Portuguese version of the abbreviated instrument of quality life WHOQOL-bref. Rev Saude Publica 2000;34(2):178–183.
24. Matsudo S, Araújo T, Matsudo V, Andrade D, Andrade E. International physical activity questionnaire (IPAQ ): Study of validity and reability in Brazil. Rev Bras Ativ Fís Saude 2001;6(2):5–18.
25. Cassou AC, Fermino RC, Santos MS, Rodriguez-Añez C, Reis RS, et al. Bar-reiras para a atividade física em idosos: Uma análise por grupos focais. Rev Educ Física/uem 2008;19(3):353-360.
26. INMET. Instituto Nacional de Meteorologia. 2016; Available from: <http://www. inmet.gov.br/portal>[2015 jun 01]
27. Reichert FF, Barros AJD, Domingues MR, Hallal P. The Role of Perceived Personal Barriers to Engagement in Leisure-Time Physical Activity. Am J Public Health 2007;97(3):515–519.