Seedling length in wheat determined by image processing using
mathematical tools
1Comprimento de plântula de trigo determinado por processamento de imagem em
ferramenta matemática
André Pich Brunes2*, Ádamo de Souza Araújo2, Letícia Winke Dias2, Francisco Amaral Villela2 and Tiago
Zanatta Aumonde2
ABSTRACT -Seed vigour is determined by a series of laboratory tests, many of these laborious and time-consuming. In view of this, the present study aimed to compare the determination of seedling length in wheat using image processing, with the traditional method, as well as the ability of the method to determine seed vigour. The experimental design was completely randomised, with five replications comprising a single-factor experimental scheme. The data were analysed for normality by the Shapiro-Wilk test and variance analysis using ANOVA at 5% probability. The response variables were correlated using Pearson’s test, and the methodologies for determining the length of the shoots and roots, by measuring with a graduated rule and by image processing, were compared using the F-test at 5% probability. To compare mean values between cultivars, Tukey’s test at 5% probability was used. The length of the shoots and roots of wheat seedlings, determined by image processing using the Matlab® mathematical tool, is efficient in separating the cultivars
into levels of vigour in a similar way to evaluations used routinely for this purpose.
Key words:Triticum aestivum. Matlab®. Image analysis. Vigour.
RESUMO - O vigor das sementes é determinado por uma série de testes laboratoriais, muitos destes, trabalhosos e morosos. Em vista disso o presente trabalho teve por objetivo comparar a determinação do comprimento de plântula de trigo através do processamento de imagens com o método tradicional, bem como sua capacidade de determinar o vigor de sementes. O delineamento experimental utilizado foi o inteiramente casualizado com cinco repetições, constituindo um experimento em esquema unifatorial. Os dados foram analisados quanto a sua normalidade pelo teste de Shapiro-wilk e análise de variância pelo teste de ANOVA a 5% de probabilidade. As variáveis respostas foram correlacionadas pelo teste de Pearson, e as metodologias de determinação do comprimento de parte aérea e de raiz através de medição com régua graduada, e por processamento de imagem foram comparadas através do teste F a 5% de probabilidade. Para comparação de média entre as cultivares utilizou-se o teste de Tukey a 5% de probabilidade. O comprimento de parte aérea e de raiz de plântulas de trigo determinados através do processamento de imagens em ferramenta matemática Matlab® são eficientes para separar as cultivares em níveis de vigor de forma similar às avaliações rotineiramente
utilizadas para essa finalidade.
Palavras-chave:Triticum aestivum.Matlab®. Análise de imagens. Vigor.
DOI: 10.5935/1806-6690.20160044 *Autor para correspondência
1Recebido para publicação em 20/08/2014; aprovado em 18/11/2015
Parte da Dissertação de Mestrado do primeiro autor em Ciências pelo Programa de Pós-Graduação em Ciência e Tecnologia de Sementes
2Departamento de Fitotecnia/FAEM/UFPel, Campus Universitário, Caixa Postal 354, Pelotas-RS, Brasil, 96.001-970, [email protected],
INTRODUCTION
Wheat is the second most-produced cereal in the world and the main winter cereal cultivated in Brazil, being grown mainly in the southern half of the country. The sown area for the harvest of 2013/14 showed an increase of 15.6% compared to the previous harvest, covering 2,191,300 hectares, with a production of 5,358,500 tonnes, of which the States of Rio Grande do Sul and Paraná contributed with 57.6% and 33.4% respectively (CONAB, 2013).
Part of the success of the wheat crop comes from the use of high quality seeds, resulting in high vigour in the field, uniform stand, and therefore higher rates of productivity. High quality seeds have faster metabolic processes, giving more rapid and more uniform primary root emission during the germination process and a greater growth rate, producing seedlings of larger initial size and hence greater growth and grain yield (MIELEZRSKIet al., 2008; MUNIZZIet al., 2010).
Seed vigour is determined through a series of laboratory tests, many labour-intensive and time-consuming, such as determining the length of shoots and roots in seedlings, where 10 to 20 seedlings must be measured individually with a graduated ruler for shoot and root length, as per a methodology described by Nakagawa (1999). It therefore becomes important to develop practices aimed at increasing the efficiency and effectiveness of the results, such as image processing, which allows analysis of a large number of samples in a short time.
A digital image is a representation of a three-dimensional numerical matrix where each dot corresponds to one pixel, with the value of each pixel representing colour intensity. Each dimension of the matrix comprises one of the three elementary colours (red, green and blue), and the proportion of these colours gives the pixel intensity (KALAIVANI; MURUGANAND; PERIASAMY, 2013).
In digital image processing, image recognition is used to measure desired features, such as area, length, shape, or any other characteristic that may be of interest. This analysis is by spatial processing, where the position and colour of the pixels are analysed, or through distribution in the frequency domain of pixel intensity (TEIXEIRA; CICERO; GOLDEN NETO, 2006).
Morphological image processing offers a unified and powerful approach to various problems of image processing. To this end, extraction algorithms are used for objects found in an image; these algorithms are developed with the Matlab® software, which comprises
a mathematical tool with multiple components designed for image processing (GONZALES; WOODS, 2011).
In the area of seeds, the software proved to be effective in inspecting the seeds of irrigated rice where the glumes were not completely closed; using the Radon transform, it was possible to achieve an accuracy of 96% for normal seeds, 96% for seeds with small cracks and 87% for seeds with unclosed glumes (CHENG; YING, 2003).
As a result, the aim of this study was to compare measurement of the length of wheat seedlings using image processing to the traditional method, as well as efficiency in determining seed vigour.
MATERIAL AND METHODS
The experiment was carried out in the Teaching Laboratory for Seed Analysis of the Federal University of Pelotas, located in the municipality of Capão do Leão, in the State of Rio Grande do Sul, Brazil (RS), (latitude 31°48’02.69” S, longitude 52°21’24” W, and altitude of 13.24 m). Seed from the wheat cultivars Itaipu, Guamirim, Pioneiro and Mestre were used in a
single-factor experimental scheme. The experimental design was completely randomised with five replications. The physiological quality of the seeds was evaluated with the following tests:
Germination - (G), carried out with four replications of 50 seeds per experimental unit, arranged on a paper substrate previously soaked in distilled water at a ratio of 2.5 times the weight of the unmoistened paper, and kept in a germinator at 20 °C. Evaluations were made eight days after sowing, as per the Norms for Seed Analysis (BRASIL, 2009), and the results expressed as a percentage of normal seedlings. First germination count (FGC) was evaluated four days after sowing, at the time of the test for germination.
Accelerated ageing (AA) was carried out in gerbox containers (11.0 x 11.0 x 3.5) covered by a metal screen. Forty mL of distilled water was added to the bottom of each box, and the seeds of each cultivar were uniformly distributed in a single layer on the screen. The boxes containing seeds were then closed and placed in a Biochemical Oxygen Demand (BOD) incubator at 41 °C for 72 hours (DELOUCHE; BASKIN, 1973). They were later submitted to the test for germination as per the previously described methodology.
seedlings, each seedling being measured separately, and the average for shoot and root length then calculated.
Scanning the images - the seedlings were placed one by one against a dark surface where the images were scanned, using a camera with a resolution of 0.3 megapixels, set at a fixed height. Pixel size was determined by taking an image of a graduated ruler. Image processing was carried out by first developing digital-image processing routines in Matlab®, so as to isolate the seedling and obtain
the length of the shoot and roots. A filter was applied to isolate the seedling from the background and obtain maximum uniform black intensity. A second filter was applied to remove the seed from the image, facilitating implementation of the length-measurement algorithms. The colour image was then converted to binary using only two colours (black and white), so that the background remained black and the seedling became brighter.
Once the binary image was obtained, an algorithm was used to separate the shoot from the root, using a filter to determine the change in width of the shoot which indicates the transition to the root, and leaving a cutting line in the image one pixel in width, from one side to the other. A skeletonisation algorithm was then applied, which creates an internal skeleton passing through the midpoints along the image. This skeleton is of unit width, making it possible to measure distance pixel by pixel.
Shoot length using image processing (SLI) was determined by calculating the distance from the first point to the next point, and repeating this process until reaching the cutting line made in the image, described in the previous step. Root length using image processing (CRI) was carried out from the end of the longest root, measuring the point to point distance to the cutting point.
The data were analysed for normality with the Shapiro-Wilk test, and analysis of variance by ANOVA at 5% probability. The response variables were correlated by the Pearson test, and the methodologies for determining shoot and root length by measuring with a graduated ruler and by image processing, were compared by F-test at 5% probability. For mean comparison between cultivars, Tukey’s test was used at 5% probability. The R software, v. 3.1.1. and the “agricolae” data package were
used in the statistical procedure (MENDIBURU, 2014; R DEVELOPMENT CORE TEAM, 2014).
RESULTS AND DISCUSSION
The results of the analysis of variance showed that there were differences between cultivars when determining accelerated ageing (AA), shoot length measured by ruler (SLR), shoot length by image processing (SLI), root length measured by ruler (RCR) and root length measured by image processing (RLI) (Table 1). No significance was seen for germination (G) and first germination count (FGC).
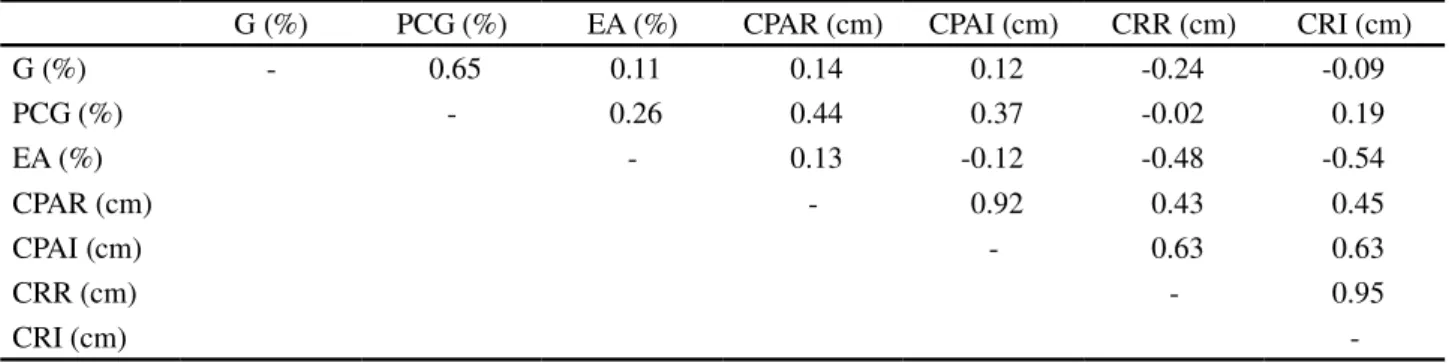
From the correlation analysis, it was possible to see a high positive correlation between the variables shoot length as measured by graduated ruler (SLR) and shoot length determined by image processing (SLI) (Table 2). Similarly for root length, a high correlation was seen between the two methods of evaluation, measuring with a graduated ruler (RLR) and by image processing (RLI) (Table 2). However, a high correlation only indicates a similar trend in variation between two characteristics, and should not be interpreted in isolation (LEALet al., 2012).
The test for first germination count (FGC) showed the highest correlation with the results for germination (G), and was classified as positive, i.e. the results increased while those of germination decreased, and moderate, due to the value forp being equal to 0.65 (Table 2). The other
tests of vigour displayed low correlation with germination. The results for seedling length, as measured both by ruler and by image processing, did not show high correlation with the test for accelerated ageing (AA) (Table 2).
From the results of the F-test at 5% probability, it was possible to see that there were no significant differences between the methods for evaluating seedling length, either by measuring with a graduated ruler or by image processing using the Matlab® program (Table 3). Since the F-test
is indicated for verifying whether variances in samples arising from normal distributions are identical, known as homogeneous variances (MELLO; PETERNELLI, 2013), these results showed that both methods display homogeneous results for seedling length.
Table 1 - Analysis of variance for the variables germination (G), first germination count (FGC), accelerated ageing (AA), shoot length by ruler (SLR), shoot length by imaging (SLI), root length by ruler (RLR) and root length by imaging (RLI), in seeds and seedlings of different wheat cultivars
ns= Not significant
F G (%) FGC (%) AA (%) SLR (cm) SLI (cm) RLR (cm) RLI (cm)
G (%) PCG (%) EA (%) CPAR (cm) CPAI (cm) CRR (cm) CRI (cm)
G (%) - 0.65 0.11 0.14 0.12 -0.24 -0.09
PCG (%) - 0.26 0.44 0.37 -0.02 0.19
EA (%) - 0.13 -0.12 -0.48 -0.54
CPAR (cm) - 0.92 0.43 0.45
CPAI (cm) - 0.63 0.63
CRR (cm) - 0.95
CRI (cm)
-Table 2 - Pearson correlation for the variables germination (G), first germination count (FGC), accelerated ageing (AA), shoot length by ruler (SLR), shoot length by imaging (SLI), root length by ruler (RLR) and root length by imaging (RLI), in seeds and seedlings of different wheat cultivars
F-test SLR SLI RLR RLI
Mean 2.31 2.35 5.46 5.49
F value 1.11ns 1.38ns
Degrees of freedom 20 20
Confidence interval 0,4619 0,5727
Table 3 - Result of the F-test at 95% probability for comparison between shoot length determined by ruler (SLR) and image analysis (SLI), and comparison between root length determined by ruler (RLR) and image analysis (RLI), in seeds and seedlings of different wheat cultivars
There was no difference between cultivars for germination or vigour, as determined by the test for first germination count (Table 4). In the test for accelerated ageing, the Itaipu and Mestre cultivars
showed superior vigour to thePioneiro andGuamirim
cultivars, the latter having the worst performance of the evaluation (Table 4).
The ranking for vigour in the cultivars, which was obtained by the test for seedling length by image processing, was different to that obtained with the test
Table 4 - Germination (G), first germination count (FGC) and accelerated ageing in different wheat cultivars
*nsNot significant;**Mean values followed by the same lowercase letter in a column do not differ by Tukey’s test (p 0.05)
for accelerated ageing. However, it should be noted that the latter test is one of the most used in evaluating the physiological potential of various species (TEKRONY, 1995). The principle of the test is the considerable increase in rate of deterioration of seeds when exposed to high levels of temperature and relative humidity, considered to be the prevailing environmental factors in the intensity and rate of decay (OHLSON et al.,
2010). However, classification of vigour levels can occur differently in different tests for vigour, when other seed attributes are also studied.
Cultivar G (%) FGC (%) AA (%)
Itaipu 93ns* 79ns 84 a**
Guamirim 90 79 74 c
Pioneiro 95 81 79 b
Mestre 93 85 88 a
Mean 93 81 81
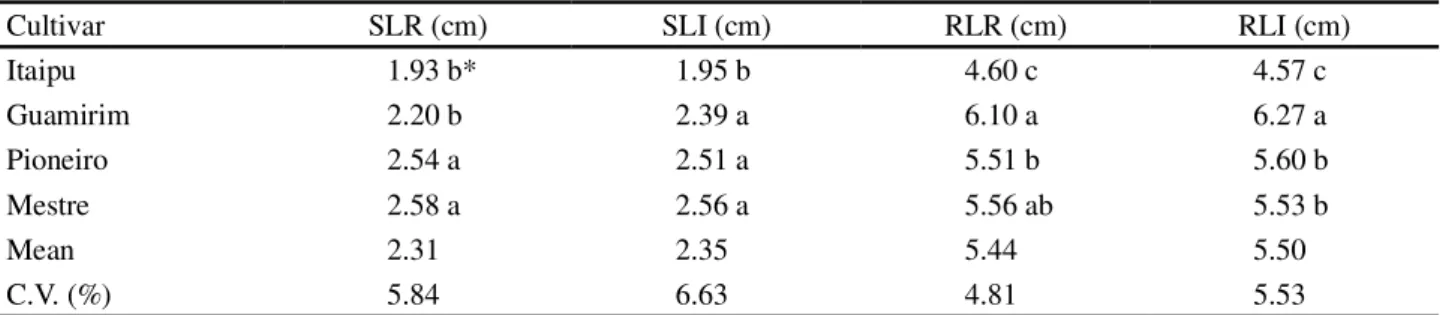
Table 5 - Shoot length determined by ruler (SLR), shoot length determined by image analysis (SLI), root length determined by ruler (RLR) and root length determined by image analysis (RLI), in seedlings of different wheat cultivars
Cultivar SLR (cm) SLI (cm) RLR (cm) RLI (cm)
Itaipu 1.93 b* 1.95 b 4.60 c 4.57 c
Guamirim 2.20 b 2.39 a 6.10 a 6.27 a
Pioneiro 2.54 a 2.51 a 5.51 b 5.60 b
Mestre 2.58 a 2.56 a 5.56 ab 5.53 b
Mean 2.31 2.35 5.44 5.50
C.V. (%) 5.84 6.63 4.81 5.53
*Mean values followed by the same lowercase letter in a column do not differ by Tukey’s test (p 0.05)
The shoot length as measured by ruler for the
Pioneiro andMestre cultivars did not differ, however they
were greater than for theItaipu and Guamirim cultivars
(Table 5). For shoot length by image processing, there was no difference between theGuamirim,Pioneiro andMestre
cultivars, however they were greater than theItaipu cultivar
(Table 5). There was little difference between results for the two methods of determination; theGuamirim cultivar was
considered inferior to thePioneiro andMestre cultivars
by graduated scale, and similar by image processing. The root length, as determined by graduated scale, was greater in seedlings of theGuamirim andMestre cultivars,
however, the latter showed no difference to the Pioneiro
cultivar (Table 5). TheItaipu cultivar had the worst result in
this evaluation. Root length determined by image processing showed similar results to those found in the previous evaluation, where the Guamirim cultivar was superior to
the others, followed byPioneiro andMestre which were not
different, but were superior to theItaipu cultivar (Table 5). A
difference in the classification of vigour levels was found only for theMestre cultivar, considered superior toPioneiro as
determined by ruler, and inferior by image processing. Despite the divergence seen between mean values for seedling length obtained by measuring with a ruler and by image processing, classification of the cultivars into vigour levels was fairly similar, in both cases classifying the Itaipu cultivar as inferior to the
others. It can be inferred from this result that image processing can be used in determining seedling length with a high degree of efficiency, and in relatively less time. Similar results were seen in a recent survey, where the parameters obtained in a computer analysis of seedlings, using the SVIS (r) software to determine the length of seedlings and indices of vigour and growth, were efficient for evaluating physiological potential in seeds of the eggplant, in a similar way to evaluations routinely used for that purpose (SILVA; CICERO, 2014a). Also classifying batches of tomato seeds into high and low vigour (SILVA;
CICERO, 2014b), classifying seeds of the bean cultivar IAC Carioca (GOMES JUNIOR; CHAMMA; CÍCERO, 2014), classifying supersweet corn (ALVARENGA; MARCOS FILHO; GOMES JÚNIOR, 2012), in lettuce seed for the classification of vigour into different batches (KIKUTI; MARCOS FILHO, 2012), for crotalaria (SILVA
et al., 2012), cucumber (CHIQUITO; GOMES JÚNIOR;
MARCOS FILHO, 2012), melon (MARCOSet al., 2006)
and maize (HOFFMASTERet al., 2005), demonstrating
the efficiency of image processing in classifying batches of cereals and vegetables.
CONCLUSION
Shoot and root length in wheat seedlings, determined by image processing using the Matlab®
mathematical tool, is efficient in separating cultivars into levels of vigour in a similar way to those evaluations which are routinely used for that purpose.
REFERENCES
ALVARENGA, R. O.; MARCOS FILHO, J.; GOMES JÚNIOR, F. G. Avaliação do vigor de sementes de milho superdoce por meio da análise computadorizada de imagens de plântulas.
Revista Brasileira de Sementes, v. 34, n. 3, p. 488-494, 2012. BRASIL. Ministério da Agricultura, Pecuária e Abastecimento.
Secretaria de Defesa Agropecuária.Regras para análise de sementes. Brasília, DF: Mapa: ACS, 2009. 395 p.
CHENG, F.; YING, Y. Image-processing algorithms for inspecting characteristics of hybrid rice seed. Proceedings of SPIE, v. 5271, p. 171-179, 2003.
COMPANHIA NACIONAL DE ABASTECIMENTO.
Acompanhamento da safra brasileira de grãos. Brasília: Conab, 2013. v.1, n. 1, 77 p. DELOUCHE, J. C.; BASKIN, C. C. Accelerated aging techniques for predicting the relative storability of seed lots.Seed Science and Technology, v. 1, n. 2, p. 427-52, 1973.
GOMES JUNIOR, F. G.; CHAMMA, H. M. C. P.; CÍCERO, S. M. Automated image analysis of seedling for vigor evaluation of common bean seeds.Acta Scientiarum. Agronomy, v. 36, n. 2, p. 195-200, 2014.
GONZALES, R. C.; WOODS, R. E. Processamento digital de imagens. 3. ed.São Paulo: Pearson Prentice Hall, 2011, 624 p. HOFFMASTER, A. F.et al. The Ohio State University Seed Vigor Imaging System (SVIS) for soybean and corn seedlings.
Seed Technology, v. 27, n.1, p. 7-24, 2005.
KALAIVANI, R.; MURUGANAND, S.; PERIASAMY, A. Identifying the quality of tomatoes in image processing using matlab. International Journal of Advanced Research in Electrical, Electronics and Instrumentation Engineering, v. 2, n. 8, p. 3525-3531, 2013.
KIKUTI, A. L. P.; MARCOS FILHO, J. Testes de Vigor em sementes de alface.Horticultura Brasileira, v. 30, p. 44-50, 2012. LEAL, C. C. P. et al. Validação de testes de vigor para
sementes de rúcula (Eruca sativa L.).Brazilian Journal of Biosciences. v. 10, n.3, p. 421-424, 2012.
MARCOS FILHO, J.et al. Assessment of melon seed vigor
by an automated computer imaging system compared to traditional procedures.Seed Science and Technology, v. 34, n. 2, p. 485-497, 2006.
MELLO, M. P.; PETERNELLI, L. A.Conhecendo o R: uma visão mais que estatística. Viçosa, Ed. UFV, 2013, 222 p. MENDIBURU, F. Agricolae: statistical procedures for agricultural research. R package version 1.2-0. 2014. Disponível em: <http://CRAN.R-project.org/package=agricolae>. Acesso em: 18 jun.2015.
MIELEZRSKI, F. et al. Desempenho em campo de plantas isoladas de arroz híbrido em função da qualidade fisiológica das sementes.Revista Brasileira de Sementes, v. 30, n.3, p. 139-144, 2008.
MUNIZZI, A.et al. Qualidade de sementes de quatro cultivares
de soja, colhidas em dois locais no estado de Mato Grosso do Sul.
Revista Brasileira de Sementes, v. 32, n. 1, p. 176-185, 2010. NAKAGAWA, J. Testes de vigor baseados no desempenho das plântulas. In: KRZYZANOWSKI, F. C.; VIEIRA, R. D.; FRANÇA-NETO, J. B.Vigor de sementes:conceitos e testes. Londrina: ABRATES, 1999. cap. 2, p. 9-13.
OHLSON, O. C.et al. Teste de envelhecimento acelerado em
sementes de trigo.Revista Brasileira de Sementes, v. 32, n. 4, p. 118-124, 2010.
R DEVELOPMENT CORE TEAM. R: a language and environment for statistical computing. Vienna, Austria: R Foundation for Statistical Computing, 2014. Disponível em: < http://www.R-project.org/>. Acesso em: 18 jun.2015. SILVA, C. B. et al. Sistema automatizado de análise de
imagens SVIS e condutividade elétrica para avaliação do vigor de sementes de crotalária. Revista Brasileira de Sementes, v. 34, n. 1, p. 55-60, 2012.
SILVA, V. N.; CICERO, S. M. Análise de imagens de plântulas para avaliação do potencial fisiológico de sementes de berinjela.
Horticultura Brasileira, v. 32, n. 2, p. 145-151, 2014a. SILVA, V. N.; CICERO, S. M. Image Seedling to evaluate tomato seed physiologcal potential. Revista Ciência Agronômica, v. 45, n. 2, p. 327-334, 2014b.
TEIXEIRA, E. F.; CICERO, S. M.; DOURADO NETO, D. Análise de imagens digitais de plântulas para avaliação do vigor de sementes de milho.Journal of Seed Science, v. 28, n. 2, p. 159-167, 2006.
TEKRONY, D. M. Accelerated ageing test.In: VAN DE VENTER,