Received October 15, 2009 and accepted April 13, 2011. Corresponding author: gleidsongiordano@ufba.br
Evaluation of intervals between observations on estimation of eating
behavior of cattle
1Gleidson Giordano Pinto de Carvalho2, Rasmo Garcia3,7, Aureliano José Vieira Pires4,7, Robério Rodrigues Silva5, Edenio Detmann3,7, Leandro Sampaio Oliveira Ribeiro6
1Projeto financiado pelo CNPq.
2Departamento de Produção Animal/UFBA, Salvador, BA. 3Departamento de Zootecnia/UFV, Viçosa, MG.
4Departamento de Tecnologia Rural e Animal/UESB, Itapetinga, BA. 5Departamento de Estudos Básicos e Instrumentais/UESB, Itapetinga, BA. 6Departamento de Zootecnia/UESB, Itapetinga, BA.
7Pesquisador CNPq.
ABSTRACT - The effect of different intervals between observations on the estimation of the eating behavior of dairy heifers and lactating cows was evaluated. Twenty Holstein-zebu crossbred dairy heifers were distributed in a completely randomized design, with four levels and five repetitions, fed isonitrogenous diets containing 71% sugar cane and 29% concentrate. Also, 16 dairy crossbred cows were distributed in a completely randomized design, with four levels and four repetitions. They received isonitrogenous diets, containing 85% sugar cane and 1% concentrate. For both heifers and lactating cows, the sugar cane used was treated with doses of 0, 0.75, 1.5 and 2.25% CaO, and corrected with 1% of urea and ammonium sulfate mixture (9:1), at the moment of offering the diets. The experimental period was 21 days long, with observations done on the 19th and 20th days, during 24 hours, at intervals of 5, 10, 15 and 20 minutes. For
both heifers and cows, lower values were verified for number of periods (nº/day) and higher values were obtained for average time spent per period of eating, rumination and idle activities, for 10-, 15- and 20-minute intervals. The mean dry matter and neutral detergent fiber with corrections for ash and protein intake per period of eating was also lower for 10-, 15- and 20-minute intervals. The intervals between observations of 10, 15 and 20 minutes lead to underestimation of the number of periods (nº/day) and to overestimation of the average time spent per period of eating, rumination and idle (min) on dairy heifers and cows, resulting in fallacy estimations. The use of 5-minute intervals for studying cattle eating behavior is recommended.
Key Words: chewing, idle, period of eating, rumination, rumination efficiency
www.sbz.org.br
Introduction
The evaluation of different feeds or diets for cattle in Brazil is a widely researched area, and provides valuable information for the beef and dairy industry. In the constant search to minimize production costs, by developing new techniques and providing alternative feeds, the eating behavior rises as a tool, contributing to decisions of animal eating management.
In a study conducted by Albright (1993), the author emphasized the importance of the eating behavior for the animal production system, reporting that besides contributing to management practices, facilities design and determination of quality and quantity of diets, in the case of dairy animals, it can even be used to elucidate the problems arising from intake decrease in critical periods of milk production, such as the lactation period.
Reliable estimations of behavior variables depend on the right choice of an interval between observations that do not compromise the results to be obtained. A five-minute interval between observations has been adopted as a pattern in most studies (Moore et al., 1990; Bürger et al., 2000; Queiroz et al., 2001; Salla et al., 2003; Mendonça e al., 2004; Cardoso et al., 2006), because it leads to results similar to the continuous method (no interval). In a study conducted by Silva et al. (2005), the authors evaluated the eating behavior of crossbred feedlot heifers, at intervals of 5, 10, 15, 20, 25 and 30 minutes, and recommended a 30-minute interval for the evaluation of eating, rumination and idleness. However, it is noted that the choice for these intervals is made completely randomly, which can significantly compromise the behavior estimations (Dutilleul, 1997).
the estimations of eating behavior of heifers and lactating cows.
Material and Methods
The present research was conducted gathering information of two distinct experiments, one with heifers and another with lactating cows.
The heifers’ experiment was conducted in the Laboratório de Animais e Laboratório de Forragicultura e Pastagem da Universidade Estadual do Sudoeste da Bahia, at Itapetinga campus, Bahia, Brazil. Twenty Holstein-Zebu (¾ Gyr × Holstein) crossbred heifers with average initial body weight of 200 kg were distributed in a completely randomized design, with four levels and five experimental units per level.
Heifers were kept in individual sheltered pens, with concrete floor, provided with individual concrete feed bunk and automatic drinkers shared by two pens. The diets contained 14 % of crude protein, with 71% of in natura
sugar cane treated with calcium oxide (CaO) doses of 0, 0.75, 1.5 and 2.25 %, and 29 % of concentrate (Table 1).
The lactating cows’ study was conducted at Fazenda Paulistinha, located in Macarani, BA, Brazil, and in the Laboratório de Animais e Laboratório de Forragicultura e Pastagem da Universidade Estadual do Sudoeste da Bahia, at Itapetinga campus, BA, Brazil. Sixteen lactating Holstein-Zebu crossbred cows, of third to fourth lactation, with average body weight of 455 kg and average milk production of 8 kg/day, were assigned in a completely randomized design, with four levels and four experimental units per level.
Cows were kept in individual sheltered pens, provided with individual concrete feed bunks and automatic drinkers, shared by two pens. The diets, with approximately 13 % of crude protein, presented 85 % in natura of sugar cane
with calcium oxide (CaO) doses of 0, 0.75, 1.5 and 2.25 %, and 15 % of concentrate (Table 1).
In both experiments the non-treated sugar cane (0% CaO) was disintegrated and offered at the moment of feeding, every day, in the morning and in the afternoon. The sugar cane added with CaO doses was processed in a stationary disintegrator machine, weighed and spread on the concrete floor, and then treated with the CaO doses previously described. After that, it was piled, and offered to the animals after 24 hours of storage.
In all levels, the sugar cane was corrected in the moment of feeding the animals with 1 % of urea/ammonium sulfate mixture (9:1), in as-fed basis. For this procedure, the urea was previously weighed according to the estimated quantity of sugar cane daily necessary for each level. Then, it was diluted in water (always keeping 1 kg urea/4 L water ratio), and poured into the sugar cane with a watering can.
The experiments were 21 days long; the first 14 days were destined to animals’ adaptation. Diets were offered
ad libitum, twice a day, at 7:30 am and 3:30 pm; adjusted
to maintain from 5 to 10% of orts from the amount offered. Water was permanently available for the animals. The feeds offered were daily recorded during all the experiment. During the period of animal’s behavior evaluation, samples of roughage and concentrate from the 19th to the 20th day,
and samples of orts from the 20th to the 21st day, were stored
and identified to estimate the intake of dry matter and neutral detergent fiber with corrections for ash and protein.
Samples of roughage, concentrate and orts from each animal were pre-dried in an oven with forced air circulation (60 °C, 72 hours) and milled in a knife mill (1-mm opening sieve) for further chemical analysis (Tables 2 and 3).
The contents of dry matter, organic matter, crude protein, ether extract, neutral detergent fiber, acid detergent fiber, neutral detergent insoluble protein, acid detergent insoluble protein and lignin were determined according to the procedure described by Silva and Queiroz (2002). The content of neutral detergent fiber with corrections for ash and protein content was determined according to the recommendations of Licitra et al. (1996) and Mertens (2002).
Ingredient Heifers’ experiment Cows’ experiment
Concentrate Diet Concentrate Diet
Sugar cane1 - 71.0 - 85.00
Corn meal 54.8 15.9 60.3 9.13
Soybean meal 39.4 11.4 28.3 4.24
Calcareous limestone 2.0 0.59 1.0 0.16
Dicalcium phosphate 1.5 0.46 4.3 0.66
Mineral mixture2 2.3 0.65 6.1 0.95
1 Sugar cane with different doses of calcium oxide (0, 0.75, 1.5 or 2.25%, as-fed basis) and added with 1 % of urea + ammonium sulfate mixture (9:1) (as-fed %). 2 Quantity/kg of product (heifers experiment): Ca 175 g; P 60 g; Na 107 g; Mg 5 g; S 12 g; Co 70 mg; Cu 1,200 mg; I 70 mg; Mn – 1,000 mg; Ni 30 mg; Se
18 mg; Zn 4000 mg; Fe 14,000 mg. Cows experiment: Ca 200 g; P 100 g; Na 68 g; Mg 18 g; S 12 g; Co 200 mg; Cu 1,600 mg; I 195 mg; Mn 1,960 mg; Ni -40 mg; Se - 32 mg; Zn - 6,285 mg; Fe - 1,000 mg.
The content of non-fibrous carbohydrate with corrections for ash and protein (NFCap) was calculated with an equation adapted from the one proposed by Hall (2003):
NFCap = (100 – % NDFap – %CP – %EE – %ash). The estimation of total digestible nutrients (TDNest) contents of total diets was calculated according to the equations described by NRC (2001). For sugar cane
Table 2 - Mean chemical composition of experimental diets for heifers
Item Calcium oxide doses on sugar cane1
0 0.75 1 . 5 2.25
Dry matter 45.3 47.9 48.5 49.0
Organic matter(% of DM) 95.0 92.8 91.1 88.3
Crude protein(% of DM) 14.6 14.7 14.4 14.8
Neutral DIN(% of CP) 17.8 22.1 21.3 22.9
Acid DIN (% of CP) 8.6 12.2 11.9 7.6
Ether extract(% of DM) 2.1 2.5 2.8 2.5
Ash (% of DM) 5.0 7.2 8.9 11.7
Total carbohydrates (% of DM) 74.6 74.1 73.6 71.9
Neutral detergent fiber (% of DM) 54.0 54.0 51.5 50.0
Neutral detergent fiber (ap) (% of DM)2 48.9 48.6 46.3 43.1
Indigestible neutral detergent fiber(% of DM) 21.7 22.1 20.4 17.0 Potentially digestible neutral detergent fiber 32.3 31.9 31.1 33.0
Non-fibrous carbohydrates (% of DM) 25.7 25.5 27.3 28.8
Non-fibrous carbohydrates (ap)(% of DM)2 29.2 26.9 27.4 27.8
Acid detergent fiber(% of DM) 34.1 34.4 33.3 28.5
Hemicellulose(% of DM) 19.8 19.6 18.2 21.6
Cellulose(% of DM) 27.0 26.9 26.5 24.1
Lignin(% of DM) 5.2 5.7 5.0 4.3
Potentially digestible dry matter (% of DM) 77.4 77.0 78.6 82.1
Total digestible nutrients(% of DM)2 61.4 60.7 62.5 62.9
1Sugar cane added with 1% of urea + ammonium sulfate mixture (9:1) and CaO doses in as-fed percentage. 2With corrections for ash and protein.
The estimation of feed potentially digestible neutral detergent fiber (NDFpD) and potentially digestible dry matter (DMpD) contents was determined according to Paulino et al. (2006).
The total carbohydrate (TC) content was estimated according to Sniffen et al. (1992):
TC = 100 – (%CP + %EE + %ash).
Item Calcium oxide doses on sugar cane1
0 0.75 1 . 5 2.25
Dry matter 37.6 38.7 40.0 41.7
Organic matter (% of DM) 94.3 91.7 89.6 85.6
Crude protein (% of DM) 13.7 13.6 13.7 13.3
Neutral DIN (% of CP) 15.5 14.1 16.7 16.9
Acid DIN(% of CP) 10.0 10.8 10.9 13.3
Ether extract(% of DM) 1.8 2.0 2.5 2.4
Ash(% of DM) 5.8 8.3 10.4 14.4
Total carbohydrates (% of DM) 78.2 78.4 73.2 69.9
Neutral detergent fiber (% of DM) 51.2 54.1 49.2 48.3
Neutral detergent fiber (ap)(% of DM)2 46.8 49.2 43.7 41.5
Indigestible neutral detergent fiber (% of DM) 27.1 29.3 19.8 18.8 Potentially digestible neutral detergent fiber 24.1 24.8 29.3 29.5
Non-fibrous carbohydrates (% of DM) 27.0 24.4 24.0 21.6
Non-fibrous carbohydrates (ap) (% of DM)2 31.4 29.3 29.5 28.4
Acid detergent fiber (% of DM) 35.1 37.0 33.2 32.8
Hemicellulose(% of DM) 16.1 17.1 15.9 15.5
Cellulose(% of DM) 26.4 28.5 26.3 25.4
Lignin(% of DM) 6.1 6.1 5.6 5.3
Potentially digestible dry matter 71.8 69.6 79.1 80.0
Total digestible nutrients (% of DM)2 61.2 58.4 59.2 56.0
1Sugar cane with different doses of calcium oxide (0, 0.75, 1.5 or 2.25%, as-fed basis) and added with 1 % of urea + ammonium sulfate mixture (9:1) (as-fed %). 2With corrections for ash and protein.
TDNest calculation, the following equation was used: TDNest = 0.98 [100 – (%NDFp + %CP + %EE + %ash)] × FP + CP × exp [–1.2 × (ADIP/CP)] + 2.25 × (EE – 1) + 0.75 × (NDFp - Lignin) × [1 – (Lignin/NDFp)0.667] – 7. For the
TDNest of concentrate rations calculation, the following equation was used: TDNest = 0.98 [100 – (%NDFp + %CP + %EE + %ash)] × FP + CP × exp [–0.4 × (ADIP/CP)] + 2.25 × (EE – 1) + 0.75 × (NDFp – lignin) × [1 – (lignin/ NDFp)0.667] – 7; where:
NDFp = NDF – NDIP (NDIP = neutral detergent insoluble nitrogen × 6.25);
FP = effect of physical processing on the digestibility of non-fibrous carbohydrate; and
ADIP = acid detergent insoluble nitrogen × 6.25. For EE < 1 values, on the equation (EE – 1) = 0 During all the experiment, before the diets were offered, the soluble sugar content (°Brix) of both natural and CaO treated sugar cane was monitored using refractometer. The sugar cane fed to heifers and cows presented mean values of 20.8 °Brix and 18.8 °Brix, respectively.
For the ingestive behavior evaluation, animals (heifers and lactating cows) were visually observed on the 19th
and 20th days. At the 19th day they were observed during
24 hours, at five-minute intervals, for the evaluation of eating, rumination and idleness periods. Data registered in the spreadsheet was used to calculate time spent with the behavior activities at the intervals of five, ten, fifteen and twenty minutes. During night time observation, the environment was kept artificially illuminated.
On the following day, the 20th, three observations of
each animal were done at three different periods: morning, afternoon and night. In these periods, the number of chews per ruminal bolus was observed, and the time spent on rumination of each bolus was measured. This procedure was done using digital chronometers, manipulated by four observers, who were positioned in front of the pens in a way that they did not disturb the animals.
For the estimation of the behavior variables: eating and rumination (min/kg of DM and NDFap), eating efficiency (g/DM and NDF/h), rumination efficiency (g of DM and NDFap/bolus and g of DM and NDFap/h), and mean DM and NDFap intakes per eating period, DM and NDF voluntary intakes of the 19th and 20th days of each
experimental period were considered, while the orts were accounted between the 20th and the 21st days.
The number of daily ruminated boluses was obtained using total rumination time (min) divided by average time spent on the rumination of one bolus. The DM and NDFap contents of each ruminated bolus (g) was obtained by
dividing the amount of DM and NDFap consumed (g/day) in 24 h by the number of daily ruminated boluses.
The eating and rumination efficiencies were obtained as follows:
DMFEE = DMI/FET; NDFFEE = DNFI/FET;
where: DMFEE (g DM ingested/h); NDFFEE (g NDF ingested/h) = eating efficiency; DMI (g) = daily dry matter intake; NDFI (g) = daily NDF intake; FET = daily time spent on eating.
DMRUE = DMI/RUT; NDFRUE = NDFI/RUT;
where: DMRUE (g DM ruminated/h); NDFRUE (g NDF ruminated/h) = rumination efficiency and RUT (h/day) = rumination time.
TCT = FET + RUT
where: TCT (min/day) = total chewing time.
The number of eating, rumination and idleness periods was counted using the number of activity sequences observed on the notes spreadsheet. Mean daily duration of these activity periods was calculated by dividing total duration of each activity (eating, rumination and idle, in min/day) by its respective number of discrete periods.
A completely randomized experimental design was used with repeated measurements over time. All statistical procedures were performed using SAS (Statistical Analysis System) and the results were interpreted by comparison of means by bilateral Dunnett test (α = 0.05).
Results and Discussion
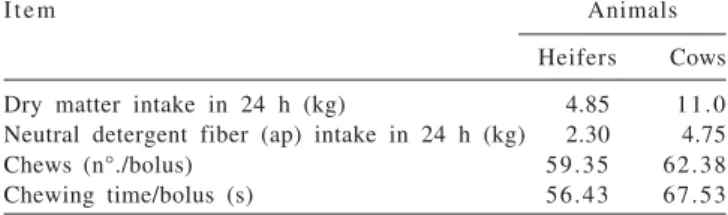
Interval effects were not observed (P>0.05) for heifers or lactating cows for daily DM intake, number of chews per bolus and chewing time per bolus (Table 4) and for time spent eating, ruminating and idling (Tables 5 and 6), what indicates the possibility of using an observation longer than 5 min in bovine studies.
Item Animals
Heifers Cows
Dry matter intake in 24 h (kg) 4.85 11.0 Neutral detergent fiber (ap) intake in 24 h (kg) 2.30 4.75
Chews (n°./bolus) 59.35 62.38
Chewing time/bolus (s) 56.43 67.53
The results observed for eating, rumination and idle activities for the different intervals tested are also in accordance with Silva et al. (2004), who evaluated 5-, 10-, 15-, 25- and 30-min intervals on crossbred heifers in pasture, and did not observe significant differences between the intervals either, and recommended a 30-min interval.
The search for intervals between observations that provide accurate behavior responses is quite old. In a study conducted by Gary et al. (1970), the authors evaluated the behavior of cattle submitted to continuous observation (no interval) and 10-, 15-, 30- and 45-min intervals. They
concluded that a 45-min interval could be used to evaluate and estimate animals’ pasturing time. The indication of intervals between observations for the study of ruminants’ eating behavior presents variation among the several studies in literature; however, they are within the maximum limit of 45 min reported by Gary et al. (1970).
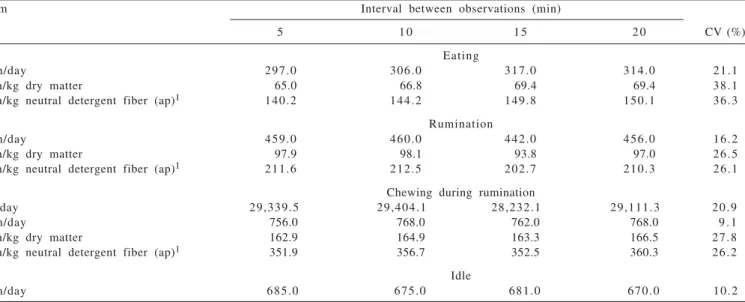
The feed and rumination efficiencies on heifers (Table 7) and lactating cows (Table 8) were not significantly affected (P>0.05) by the intervals studied. The absence of significant effect of intervals on these variables results from similarity observed for eating and rumination in 24 hours, since the
Item Interval between observations (min)
5 1 0 1 5 2 0 CV (%)
Eating
Min/day 297.0 306.0 317.0 314.0 21.1
Min/kg dry matter 65.0 66.8 69.4 69.4 38.1
Min/kg neutral detergent fiber (ap)1 140.2 144.2 149.8 150.1 36.3
Rumination
Min/day 459.0 460.0 442.0 456.0 16.2
Min/kg dry matter 97.9 98.1 93.8 97.0 26.5
Min/kg neutral detergent fiber (ap)1 211.6 212.5 202.7 210.3 26.1
Chewing during rumination
N°/day 29,339.5 29,404.1 28,232.1 29,111.3 20.9
Min/day 756.0 768.0 762.0 768.0 9 . 1
Min/kg dry matter 162.9 164.9 163.3 166.5 27.8
Min/kg neutral detergent fiber (ap)1 351.9 356.7 352.5 360.3 26.2
Idle
Min/day 685.0 675.0 681.0 670.0 10.2
Means on the same row, followed by an asterisk (*) differ from control (5 min) by Dunnett test (α = 0.05). ¹ With corrections for ash and protein; CV = coefficients of variation.
Table 5 - Means and coefficients of variation of eating, rumination, chewing and idle activities as a function of different time intervals between observations for heifers
Item Interval between observations (min)
5 1 0 1 5 2 0 CV (%)
Eating
Min/day 354.0 362.0 342.0 365.0 22.0
Min/kg dry matter 32.3 33.1 31.4 33.3 20.1
Min/kg neutral detergent fiber (ap)1 73.5 75.1 71.3 75.8 20.4
Rumination
Min/day 462.0 464.0 475.0 464.0 15.4
Min/kg dry matter 42.5 42.8 44.1 43.0 19.3
Min/kg neutral detergent fiber (ap)1 96.6 97.3 100.1 97.6 19.0
Chewing
Nº/day 25,656.3 25,819.2 26,482.0 25,813.2 18.9
Min/day 816.0 828.0 816.0 828.0 13.5
Min/kg dry matter 74.9 75.9 75.5 76.4 14.9 Min/kg neutral detergent fiber (ap)1 170.1 172.4 171.4 173.4 14.8
Idle
Min/day 624.0 614.0 623.0 611.0 18.0
Means on the same row, followed by an asterisk (*) differ from control (5 min) by Dunnett test (α = 0.05). 1 With corrections for ash and protein; CV = coefficients of variation.
efficiencies were obtained from them. The results observed in this study for eating and rumination efficiency are consistent with those reported by Silva et al. (2006), who evaluated intervals of up to 30 min to estimate the eating behavior of post-weaning Holstein calves, and similarly, found no differences for these variables.
The number of periods and the average time spent per period of eating, rumination and idle for 10-, 15- and 20-min intervals, however, were different (P<0.05) from those obtained for the 5-min interval. In this study, a 5-min interval was the more adequate to evaluate the eating behavior, because it allowed detecting a higher number of activities, which reflected in accurate values of numbers of periods of eating, rumination and idleness (Tables 7 and 8).
Accordingly, though intervals longer than 5 min may be used to obtain eating, rumination and idle activities in 24 hours, the complete evaluation of ruminants’ eating behavior involving the discretization of these activities by the number and the average time spent per period of activity, requires the use of a 5-min interval, since sophistic results are obtained when using intervals longer than 5 minutes (Tables 7 and 8), as it was demonstrated. These data may be supported by the reports of Dutilleul (1997), who stated that the interval choice affects the observer’s perception, and if it is inadequate to the evaluation system, it can compromise the interpretation of the results.
The results verified in this study, indicating a 5-min interval for the evaluation of eating behavior, are in agreement with Fischer et al. (2000), who, when studying 5-, 7- and 10-min intervals, also concluded that the 5-min interval was the most appropriate in relation to the other intervals, because it allowed detecting higher number of activities. The authors commented that 5-min intervals present another advantage: allowing the visual monitoring of ruminants in experimental conditions, when data recording electronic devices are not available.
Other results presented in literature, as those observed by Silva et al. (2004) and Carvalho et al. (2007), who tested intervals up to 30 min for eating behavior study of heifers and sheep, respectively, also indicated a 5-min interval as the most appropriate to obtain the estimations of behavioral activities. Like in the present study, the observation loss due to using intervals larger than 5 minutes in these studies also implied on inferior number of eating, rumination and idle periods, consequently resulting in longer time spent per period of these activities. On the other hand, the study conducted by Silva et al. (2006) with post-weaning Holstein calves indicated the possibility of using intervals of up to 10 min. Despite the divergence from the results found in the present study, which indicated 5-min interval, it can be assumed higher reliability when using a 5-min interval, since it is closer to continuous observation (no intervals).
Item Interval between observations (min)
5 1 0 1 5 20 CV (%)
Eating efficiency
g Dry matter/h 1,045.1 1,019.2 992.9 1,029.3 39.2
g Neutral detergent fiber (ap)1/h 483.4 471.7 459.1 477.7 41.1
Rumination efficiency
Boluses (n°./day) 504.5 505.1 487.3 499.3 26.0
g Dry matter/bolus 10.4 10.3 10.8 10.6 34.8
g Neutral detergent fiber (ap)1/bolus 4.8 4.7 5.0 4.9 35.7
g Dry matter/h 651.4 646.1 678.4 667.8 25.2
g Neutral detergent fiber (ap)1/h 301.1 299.1 313.2 309.3 26.0
Number of periods (n°./day)
Eating 19.5 13.9* 10.5* 8.0* 22.7
Rumination 25.7 19.9* 16.5* 14.5* 14.0
Idle 35.2 27.3* 21.5* 17.6* 12.8
Time spent per period (min)
Eating 15.6 22.8* 31.0* 40.7* 23.4
Rumination 18.2 23.4* 27.1* 31.9* 19.1
Idle 19.6 25.0* 32.0* 38.7 15.2
Mean intake per period of eating (kg)
Dry matter 0.26 0.37 0.52* 0.67* 24.2
Neutral detergent fiber (ap)1 0.12 0.17 0.24* 0.31* 23.1
Means on the same row, followed by an asterisk (*) differ from control (5 min) by Dunnett test (α = 0.05). 1 With corrections for ash and protein; CV = coefficient of variation.
However, before using a certain interval, it is recommended to search reliable intervals previously tested and presented in literature.
The mean intake of DM and NDFap per period of eating at the heifers’ evaluation indicated that a 10-min interval between observations could be used, since it provided similar means (P>0.05) to the 5-min interval. However, once the interval to be adopted should be accurate for obtaining all the behavior variables, the possibility of obtaining an isolated estimation when using a determined interval does not match the evaluation system, and should not be recommended. For the lactating cows, the result for the variable intake per period of activity followed the behavior observed for number and average time spent per period, indicating a 5-min interval.
Conclusions
The intervals between observations of 10, 15 and 20 minutes, on the evaluation of the ingestive behavior of heifers and lactating cows, lead to biased estimations of behavior. Five-minute intervals between observations is recommended for the study of ingestive behavior in cattle, because the use of this interval leads to reliable behavior information when compared with longer intervals.
References
ALBRIGHT, J.L. Feeding behavior of dairy catle. Journal of Dair y Science, v.76, n.2, p.485-498, 1993.
BÜRGER, P.J.; PEREIRA, J.C.; QUEIROZ, A.C. et al. Comportamento ingestivo em bezerros holandeses alimentados com dietas contendo diferentes níveis de concentrado. Revista Brasileira de Zootecnia, v.29, n.1, p.236-242, 2000. CARDOSO, A.R.; CARVALHO, S.; GALVANI, D.B. et al.
Comportamento ingestivo de cordeiros alimentados com dietas contendo diferentes níveis de fibra em detergente neutro.
Ciência Rural, v.36, n.2, p.604-609, 2006.
CARVALHO, G.G.P.; PIRES, A.J.V.; SILVA, R.R. et al. Aspectos metodológicos do comportamento ingestivo de ovinos alimentados com capim-elefante amonizado e subprodutos agroindustriais. Revista Brasileira de Zootecnia, v.36, n.4, p.1105-1112, 2007.
DUTILLEUL, P. Incorporating scale in study design: data analysis. In: PETERSON, D.L.; PARKER, V.T. (Eds.) Ecological scale: theory and application. New York: Columbia University Press, 1997. p.1-77.
FISCHER, V.; DUTILLEUL, P.; DESWYSEN, A.G. et al. aplicação de probabilidades de transição de estado dependentes do tempo n a a n á l i s e q u a n t i t a t i v a d o c o m p o r t a m e n t o i n g e s t i v o d e ovinos. parte I. Revista Brasileira de Zootecnia, v.29, n.6, p.1811-1820, 2000.
GARY, L.A.; SHERRITT, G.W.; HALE, E.B. Behavior of charolais cattle on pasture. J o u r n a l o f D a i r y S c i e n c e, v.30, n.2, p.303-306, 1970.
HALL, M.B. Challenges with nonfiber carbohydrate methods.
Journal of Animal Science, v.81, n.12, p.3226-3232, 2003. LICITRA, G.; HERNANDEZ, T.M.; VAN SOEST, P.J. Standardization of procedures for nitrogen fracionation of ruminant feed. Animal Feed Science Technological, v.57, n4, p.347-358, 1996. Table 8 - Eating and rumination efficiencies, mean number and time spent per period of eating, rumination and idle activities, dry matter
and neutral detergent fiber (ap)1 intakes per period of eating in different intervals between observations for lactating cows
Item Interval between observations (min)
5 1 0 1 5 2 0 CV (%)
Eating efficiency
g Dry matter/h 1,906.4 1,864.0 1,985.9 1,879.4 18.3
g Neutral detergent fiber (ap)1/h 840.3 820.8 874.9 828.5 18.7
Rumination efficiency
Boluses (nº/day) 413.6 415.4 424.7 413.9 17.0
g Dry matter /bolus 27.2 26.9 26.7 27.2 21.7
g Neutral detergent fiber (ap)1/bolus 12.0 11.9 11.7 12.0 21.2
g Dry matter /h 1,446.7 1,436.2 1,424.1 1,454.1 19.3
g Neutral detergent fiber (ap)1/h 636.7 632.5 626.8 640.0 19.1
Number of periods (n°./day)
Eating 17.5 12.7* 10.6* 9.1* 19.5
Rumination 19.6 16.0* 13.8* 13.4* 14.9
Idle 30.3 22.2* 19.3* 16.4* 12.4
Time spent per period (min)
Eating 21.0 29.6* 32.6* 40.8* 27.4
Rumination 24.0 29.3* 34.8* 34.9* 16.0
Idle 20.8 28.0* 32.5* 37.0* 21.6
Mean intake per period of eating (kg)
Dry matter 0.65 0.89* 1.05* 1.23* 21.7
Neutral detergent fiber (ap)1 0.29 0.39* 0.46* 0.54* 22.1
MENDONÇA, S.S.; CAMPOS, J.M.S.; VALADARES FILHO, S.C. et al. Comportamento ingestivo de vacas leiteiras alimentadas com dietas à base de cana-de-açúcar ou silagem de milho. Revista Brasileira de Zootecnia, v.33, n.3, p.723-728, 2004. MERTENS, D.R. Gravimetric determination of amylase-treated
neutral detergent fiber in feeds with refluxing in beakers or crucibles: collaborative study. Journal of AOAC International, v.85, p.1217-1240, 2002.
MOORE, J.A.; POORE, M.H.; SWINGLER, R.S. Influence of roughage source on kinetics of degestion and passage, and on calculated extends of ruminal digestion in beef steers fed 65% concentrate diets. J o u r n a l o f D a i r y S c i e n c e, v.68, n.12, p.3412-3420, 1990.
NATIONAL RESEARCH COUNCIL - NRC. Nutrient requirements of dairy cattle. 7.ed. Washington: National Academy Press, 2001. 450p.
PAULINO, M.F.; DETMANN, E.; VALADARES FILHO. S.C. Suplementação animal em pasto: energética ou protéica? In: SIMPÓSIO SOBRE MANEJO ESTRATÉGICO DA PASTAGEM, 3., 2006, Viçosa, MG. Anais... Viçosa, MG: SIMFOR, 2006. p.359-392.
QUEIROZ, A.C.; NEVES, J.S.; MIRANDA, L.F. et al. Efeito do nível de fibra e da fonte de proteína sobre o comportamento alimentar de novilhas mestiças holandês-zebu. A rq u i v o Brasileiro de Medicina Veterinária e Zootecnia, v.53, n.1, p.84-88, 2001.
SALLA, L.E.; FISCHER, V.; FERREIRA, E.X. et al. Comportamento ingestivo de vacas Jersey alimentadas com dietas contendo diferentes fontes de gordura nos primeiros 100 dias de lactação.
Revista Brasileira de Zootecnia, v.32, n.3, p.683-689, 2003. SILVA, D.J.; QUEIROZ, A.C. Análise de alimentos: métodos
químicos e biológicos. Viçosa, MG: UFV, 2002. 235p. SILVA, R.R.; MAGALHÃES, A.F.; CARVALHO, G.G.P. et al.
Comportamento ingestivo de novilhas mestiças de holandês suplementadas em pastejo de brachiaria decumbes. Aspectos metodológicos. Revista Electrónica de Veterinaria, v.5,
n.10, p.1-7, 2004.
SILVA, R.R.; SILVA, F.F.; CARVALHO, G.G.P. et al. Avaliação do comportamento ingestivo de novilhas ¾ holandês x zebu alimentadas com silagem de capim-elefante acrescida de 10% de farelo de mandioca: aspectos metodológicos. C i ê n c i a Animal Brasileira, v.6, n.3, p.173-177, 2005.
SILVA, R.R.; SILVA, F.F.; PRADO, I.N. Metodologia para o estudo do comportamento de bezerros confinados na fase de pós-aleitamento. Archivos Latinoamericanos de Producción Animal, v.14, n.4, p.135-138, 2006.
SNIFFEN, C.J.; O’CONNOR, D.J.; Van SOEST, P.J. et al. A net carbohydrate and protein system for evaluating cattle diets: carbohydrate and protein availability. Journal of Animal Science, v.70, n.12, p.3562-3577, 1992.