1
A robust computational solution for automated quantification of a
specific binding ratio based on [
123I]FP-CIT SPECT images
Francisco P. M. Oliveira*, Diogo Borges Faria#, Durval Campos Costa+, João Manuel R. S. Tavares*
*
Instituto de Engenharia e Mecânica e Gestão Industrial, Faculdade de Engenharia, Universidade do Porto, Portugal
#
HPP Medicina Molecular, SA., Faculdade de Engenharia, Universidade do Porto, Portugal, Portugal
+
HPP Medicina Molecular, SA., Fundação Champalimaud, Portugal
Corresponding author:
Prof. João Manuel R. S. Tavares
Faculdade de Engenharia da Universidade do Porto (FEUP) Departamento de Engenharia Mecânica (DEMec)
Rua Dr. Roberto Frias, s/n, 4200-465 PORTO - PORTUGAL Tel: +315 22 5081487, Fax: +315 22 5081445
Email: tavares@fe.up.pt, Url: www.fe.up.pt/~tavares
2
A robust computational solution for automated quantification of a
specific binding ratio based on [
123I]FP-CIT SPECT images
Abstract
Aim The purpose of the current paper is to present a computational solution to accurately quantify a specific to a non-specific uptake ratio in [123I]FP-CIT single photon emission computed tomography (SPECT) images and simultaneously measure the spatial dimensions of the basal ganglia, commonly known as basal nuclei. A statistical analysis based on a reference dataset selected by the user is also automatically performed.
Methods The quantification of the specific to non-specific uptake ratio here is based on regions of interest defined after the registration of the image under study with a template image. The computational solution was tested on a dataset of 38 [123I]FP-CIT SPECT images: 28 images were from patients with Parkinson’s disease and the remainder from normal patients, and the automated quantification was compared with three widely known semi-automated quantification methods.
Results The results have revealed a high correlation coefficient between the automated method developed and three widely known semi-automated methods used for comparison (r ≥ 0.975). The solution also showed an excellent robustness against different positions of the patient, as an almost perfect agreement between the specific to non-specific uptake ratio was found (ICC = 1.000). The mean processing time was around 6 seconds per study using a common pc notebook.
3
Conclusions The solution developed can be very useful for clinicians to evaluate [123I]FP-CIT SPECT images due to its accuracy, robustness and speed. Also, the comparison between case studies and the follow-up of patients can be done more accurately and proficiently since the intra- and inter-observer variability of the semi-automated calculation does not exist in semi-automated solutions. The determination of the basal ganglia dimensions and the automatic comparison with the values of the population selected as reference is also important for professionals in this area.
Key words: Parkinson’s disease; DaTSCAN; basal ganglia analysis; image registration; image segmentation.
4
1. Introduction
Movement disorders are caused by the degeneration of nigrostriatal neurons, and Parkinson’s disease is characterized by a progressive degeneration of nigrostriatal dopaminergic neurons. Studies of dopaminergic and benzodiazepine systems can be image-based with the use of [123I] neuroligands. Presynaptic nigrostriatal terminal functions are evaluated by the presence of dopamine transporters (DAT), which can be studied with several cocaine analogue molecules labelled with [123I], such as [123I]CIT, [123I]altropane and [123I]FP-CIT. Imaging of postsynaptic dopamine receptors has been focused on D2-like, benzamide derivatives, such as [123I]IBZM and [123I]BF.1 [123 I]FP-CIT is a widely used radiopharmaceutical to evaluate the presence of dopamine transporters in the putamen and caudate nucleus. It is commercially available as DaTSCAN (GE Healthcare, UK).
Imaging of the dopamine transporter with SPECT is the most widely used Nuclear Medicine technique for routine assessment of patients with suspected degenerative Parkinsonism.2 With this technique, the reduction of dopamine transporters can be observed in patients with Parkinson’s disease and also in patients with dementia with Lewy bodies.3 Based on a voxel-wise comparison using the Statistical Parametric Mapping Tool, Scherfler and co-workers 4 showed differences between the dopamine transporter among patients with idiopathic Parkinson’s disease, patients in the early stages of the Parkinson-variant of multiple system atrophy (MSA-P) and a control group. Catafau and Tolosa 5 showed the importance of the dopamine transporter SPECT images for the diagnosis of clinically uncertain Parkinsonian syndromes. Further information on the diagnosis of Parkinson’s disease can be found, for example, in the works of Varrone and Halldin 2, and Tolosa, Wenning and Poewe 6.
5
The reduction of [123I]FP-CIT nigrostriatal uptake confirms Parkinson’s disease and discards other diseases, such as essential tremor or drug-induced Parkinsonism. Usually, these kinds of studies are qualitatively evaluated by visual inspection by nuclear medicine physicians. Several quantification methods have been developed to aid visual inspection and to improve the success of the final diagnoses.7 Absolute quantification methods can be invasive and demand the minimization of common error sources, such as attenuation correction, scattering, patient movements, partial volume effects, sensitivity, and low spatial resolutions.8-9 Furthermore, absolute quantification methods involve radiopharmaceutical kinetic modelling and arterial blood sampling, which are somehow not appropriated to a busy nuclear medicine unit.
Semi-quantitative methods use dedicated computers and software solutions to analyze the information obtained with the main purpose of classifying the patients according to different uptake patterns in the structures of interest.7 These methods can help to improve the diagnosis accuracy and to evaluate the response to therapies more efficiently.
The normal semi-quantitative methods use specific to non-specific uptake ratios – striatum uptake relative to the background, and regions of interest (ROIs) are used to calculate these uptake ratios. Usually, the ROIs are defined by outlining the caudate and putamen, and a large ROI is defined by outlining the background of the non-specific uptake. The ratio obtained is related to the availability of dopamine transporters. The positioning of the ROIs can be done manually or semi-automatically by an expert, as in the pioneer work of Costa and co-workers 10, or automatically; for instance, based on the anatomic information presented in magnetic resonance (MR) images or in functional SPECT images.
6
The main goal of this paper is to present a fully automated methodology to help clinicians in the analysis of DaTSCAN SPECT images. The software solution developed does the automated quantification of the specific to non-specific uptake ratio, which is directly related to the binding potentials,1 and also a 3D dimensional analysis of the basal ganglia region. Additionally, useful features are integrated into the solution, including the computations of the z-scores of each measure relative to a reference dataset, and the building of a voxel-by-voxel z-score map of the case under evaluation comparative to a reference dataset, which can be of a normal or of a specific population. The software solution accepts 3D images stored in common file formats (DICOM, NIfTI, Analyse, etc.) with different pixel spacing and slice thickness from different gamma cameras.
The automated calculation of specific to non-specific uptake ratio is similar to the semi-automated procedure carried out in many medical institutions, which is based on the placement of three regular ROIs. Although some research has been done on the development of fully or semi-automated methodologies for the computation of specific to non-specific uptake ratios of [123I]IBZM or DaTSCAN SPECT images and their comparison,11-20 the computational solution proposed in this work is considerably different from them due its additional features and because it is fully automated.
2. Material and methods
2.1 Dataset
The data of 38 subjects (62 ± 10 years), 16 males and 22 females, randomly chosen from HPP-Medicina Molecular (Portugal) patients, was used as an experimental dataset. The patients underwent [123I]FP-CIT SPECT studies, with administered activities
7
ranging from 148 to 185 MBq, after thyroid blocking with potassium iodide solution. Images were obtained 3.5 to 4 hours post injection.
The images were acquired using 3 different cameras: Infinia, Millenium MPR and Millenium MG (GE Healthcare). A 128×128 matrix was used, with a radius of rotation inferior to 15 cm, 360º circular orbit, 128 projections and 30 seconds per view. The SPECT data was reconstructed using a Xeleris Workstation (GE Healthcare) by back projection filtering with Hann’s filter, with a critical frequency of 1.0, and corrected for attenuation by Chang’s method (µ equal to 0.11/cm, and elliptic fitting with separate contours for each slice). The images were then exported in the standard DICOM protocol.
Based on the clinical history and visual inspection of the images by experienced Nuclear Medicine physicians, 28 patients were classified with signs of dopaminergic degeneration, and the remaining 10 were classified as normal.
2.2 Automated quantification and analysis
The fully automated computational solution developed can be divided into the following four main steps: (1) registration, i.e. alignment, of the 3D DaTSCAN SPECT image under study with a pre-built template 3D DaTSCAN image; (2) computation of the binding potential index (BPI) for both left and right basal ganglia, based on pre-defined volumetric regions; (3) segmentation of both basal ganglia and consequent computation of related 3D geometric dimensions; (4) statistical analysis having a user-defined dataset as reference. These steps are further detailed in the next sections.
2.2.1 Template DaTSCAN SPECT image
To define the template DaTSCAN SPECT image to be used in the registration step, a normal image was selected, and then it was semi-automatically registered according to
8
Talairach and Tournoux’s atlas. Then, a set of normal images, including images from different sources, was chosen and each of these images was registered with the image registered in the previous step. All registered images were then normalized to the same intensity scale, taking into account the maximum count. Finally, a mean normal image was built based on all the registered images, and adopted as the template image.
In the experimental results reported here, a voxel size of 4.42×4.42×4.42 mm3 was used for the template image; however, a different spacing could be adopted. It should be noted that the template DaTSCAN SPECT image just needs to be built once, and is used to register all DaTSCAN SPECT images, independently of the patients under study or the image acquisition parameters.
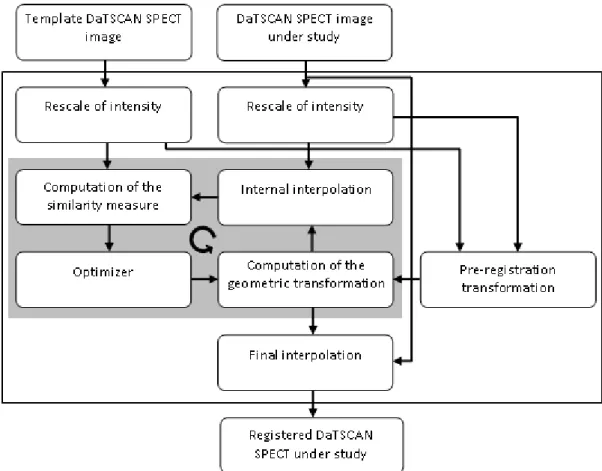
2.2.2 Image registration
The accuracy and robustness of the image registration step are crucial for the success of the computational solution. The key steps of the registration algorithm used are depicted in Figure 1.
Initially, the intensities of both images are rescaled according to the following transformation:
2.5 max , , , , ' I z y x I z y x I (1)where I' represents the intensity of the rescaled image, I the intensity of the original image, i.e., the counts associated to each voxel, and Imax is the maximum intensity in the image that is being rescaled, namely, the maximum count, presented in I. This rescaling is applied independently to both images, and so, after the rescaling, both template and target images have the same maximum intensity.
9
The aim of this rescaling step is to increase the influence of the basal ganglia, which is associated to the highest counts, and to decrease the influence of other regions, which are associated to lower counts. A value higher than 1 (one) in the exponent value in Equation 1 reduces the intensity in the non basal ganglia regions relatively to the intensity of this region. However, that exponent cannot be very high; otherwise, the registration would fail when the differences between the intensity in the basal ganglia and the other regions of the head are very low. The experimental results have shown that the exponent value of 2.5 is appropriate for the optimization algorithm and similarity measure used in the image registration process. Note that the template pre-built template 3D DaTSCAN image needs only to be intensity rescaled once since its rescaling is independent of the image under study.
Afterwards, an initial translational pre-registration step, based on the first order moments of the two rescaled images, is carried out. Then, Powell’s method 21 is used as the multidimensional optimization algorithm, adopting a three level multi-resolution strategy. The golden section method is integrated into Powell’s method for the line minimization. The goal of this optimization is to search for the geometric transformation that minimizes the sum of the squared differences (SSD) among the intensity values of the voxels of both input images, since it is assumed that the lower the SSD the better the alignment. A rigid geometric transformation, which includes three translational and three rotational components, is used as the geometric transformation model. During this optimization process, the images are resampled using linear interpolation.
The iterative optimization algorithm stops when no significant improvement in the similarity measure can be achieved. Finally, by applying the optimal geometric transformation found, and using the Welch windowed sinc interpolation with a window
10
radius equal to 4, which was found experimentally, the image under study is registered with the template image.22
In the reconstruction of the registered images, the same voxel spacing and image origin are always used. As such, all registered images have the same coordinate system, and the basal ganglia are placed according to identical spatial positions and orientations. Hence, the registration attained is independent of the image voxel spacing, since the registration process is based on the physical coordinates of the images.
Figure 1: Diagram of the algorithm used to register the DaTSCAN SPECT images.
2.2.3 Computation of specific uptake ratios
The fully automated software solution developed does the computation of the BPI based on the placement of three ROIs, as proposed by Costa and co-workers.23 It follows the same steps as many semi-automated software solutions. For instance, in the software
11
available on the XelerisTM Functional Imaging Workstation version 1.1452 (GE Medical Systems) used in this work for comparison, the quantification process can be divided in the following main steps: (1) first, the observer does the semi-automated orientation of the volumetric image; (2) then, based on the signal presented on the transaxial slices, the observer selects the slices that contain the basal ganglia, which are then added to build a thick slice (2D image); (3) after that, the observer places three regular rectangular ROIs with similar area on the slice built, one on the left basal ganglia, another on the right basal ganglia and a last one on the parieto-occipital posterior region that includes gray and white matter; (4) finally, each BPI (left and right) is calculated according to:
BK BK BG
BPI (2)
where BG is the mean counts per pixel in the ROI that contains the basal ganglia and BK the mean counts per pixel within the ROI containing the parieto-occipital region, which is used as reference. The dimension of the ROIs on the basal ganglia is approximately 44×62 mm2 and on the parieto-occipital region is around 70×39 mm2. As referred, the automated computation of the BPI is similar to the semi-automated method described above but in this case the process is totally automated: (1) first, using the registration algorithm, the DaTSCAN image under study is geometrically registered with the template DaTSCAN image; (2) then, three volumetric ROIs are defined on the registered 3D image, and the total signal contained in each ROI is calculated and normalized by the number of voxels of each region; (3) finally, both BPI are computed using Equation 2. In the software implementation done, the transaxial sections of the 3D ROIs have approximately the same dimension as the ROIs used in the semi-automated
12
methodology described above, and about 49 mm of thickness along the inferior-superior direction.
The computational solution developed was also compared with the widely known Three Box and Two Box methods available in the commercial software package QuantiSPECT version 1.0 (GE Healthcare).
The Three Box method available in the QuantiSPECT is similar to the semi-automated method described above. The only significant difference is that in the QuantiSPECT the dimension of the ROI over the parieto-occipital posterior region is defined by the user. This Three Box method computes the BPI as defined above.
The Two Box method was developed by Tossici-Bolt and co-workers.24 To apply this method, the user needs to make the same initial steps as in the other two semi-automated methods described above, i.e. align the DaTSCAN image, build a summed image based on the slices selected by the user, and place separately two large ROIs over the striatum. In this case, the ROIs over the striatum are trapezoidal. A reference region is automatically defined by the software as the whole of the brain parenchyma excluding the regions inside the two ROIs over the striatum. The output of this software is the specific binding ratio (SBR) computed as:
ROI r ROI s r s V c Ct V c c SBR 1 , (3)
where cs is the count concentration in the striatum due to the specific binding only, c r
is the count concentration in a reference region due to the non-specific binding, V is s
the volume of the striatum, CtROI is the total counts in the ROI over the striatum, and
ROI
V is the volume of the ROI over the striatum. Note that the SBR equation used by Tossici-Bolt and co-workers 24 is related with the BPI by SBRBPIVROI Vs,
13
considering that the reference regions used in both equations have identical mean counts and all counts associated to the striatum are inside respective ROIs. Since in this work the ROI over the striatum has a VROI 132.7ml and Tossici-Bolt and co-workers
24 used a Vs 11.2 ml, we can estimate that SBR11.8BPI.
To differentiate the semi-automated method available on the XelerisTM Functional Imaging Workstation from the Three Box method available in the QuantiSPECT software package, in the rest of this work we refer to the first one as Three ROI method. The main differences between the automated method and the semi-automated methods used in this work for comparison are described in Table 1.
Table 1: Differences between the semi-automated quantification methods and the
automated quantification solution presented in this work.
Semi-automated methods Automated
The observer semi-automatically reoriented the DaTSCAN image based on his experience and knowledge.
All images are registered based on a unique and stable criterion.
The observer selects only the slices that visually seem to contain the basal ganglia. Thus, the slices selected depend on the observer criterion and on the image conditions. Even if the observer always selects the same number of slices, the same physical region is not always defined due to the discrete nature of the images and the different thicknesses of the slices.
The physical dimensions of the 3D ROIs are constant, since all registered images are resampled with equal voxel spacing, and the same number of slices is always selected.
Two 2D ROIs are placed over the striatum where the observer thinks is most appropriate to contain all striatum.
For the Three ROI and Three Box methods, the observer also needs to place another 2D ROI on the reference region. For the Two Box method, the reference region is automatically defined by the software.
The three 3D ROIs are always placed in the same physical positions. The optimal locations for the 3D ROIs are defined based on the template DaTSCAN image. For all images, even when acquired using different gamma cameras with distinct resolutions, the 3D ROIs have always the same physical dimensions and constant number of voxels, since the images are registered and resampled with the same spatial resolution.
14 2.2.4 Basal ganglia segmentation
To complement the analysis of the basal ganglia, in addition to the automated BPI calculation, the computational solution is able to segment this structure in the image under study, i.e. extract the basal ganglia region from the input image, and compute useful geometric measures that can be used to characterize the segmented structure. It should be noted that the segmentation process is based on a functional image, and consequently, the region extracted might not correspond to the anatomical region of the basal ganglia; this is especially true for patients with Parkinson’s disease.
The segmentation process is based on an intensity threshold, and only voxels with intensity higher than a threshold value are considered as belonging to the basal ganglia. The main difficulty of this method is the definition of the optimal threshold value to be used. In the solution developed, the following equation is used to define that value:
p I BK I threshold max max (4)
where Imax represents the maximum counts in the image and BK the mean counts in the parieto-occipital posterior region. As such, this equation guarantees that the image segmentation is invariant against linear intensity rescaling; i.e., the segmented image remains identical even if the image intensity values are multiplied by a constant factor (>0). Besides, the threshold value is automatically adjusted according to the maximum intensity presented in the input image and the mean intensity value in the parieto-occipital posterior region. Since BKImax, the threshold is always a value higher than
BK and lower than Imax for 0 p1. In the experiments performed a p value equal to 0.4 led to good visual results in all DaTSCAN images, except when the striatal uptake was almost equal to the uptake on the parieto-occipital posterior region.
15
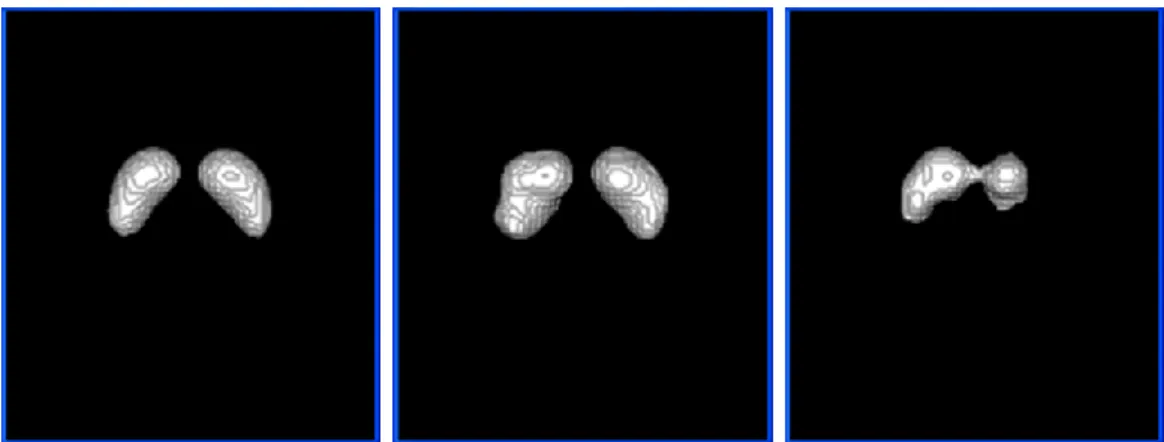
In the segmentation process, a voxel spacing of approximately 1 mm is considered to assure the smoothness of the volumetric region extracted. Figure 2 presents three examples of the segmentation results obtained by the solution developed.
After the segmentation process, the total volume of each basal ganglia and correspondent width, length and thickness (inferior-superior) are automatically calculated. The orientation adopted to compute the width, length and thickness is based on the template image, Figure 3.
Figure 2: 3D views of segmented basal ganglia: on the left, the basal ganglia of the mean DaTSCAN
image of the normal population; in the middle, the basal ganglia of a normal patient (case under study); on the left, the basal ganglia of a patient with vascular Parkinsonism (case under study).
Figure 3: Width, length and thickness on both sides of the basal ganglia segmented from a DaTSCAN
16 2.2.5 Automated statistical analysis
The computational solution developed automatically carries out a statistical analysis on the image under study relative to a dataset of images used as reference. If the statistics of the reference dataset are already available, then they are used in the comparison; otherwise, the computational solution computes the associated statistics.
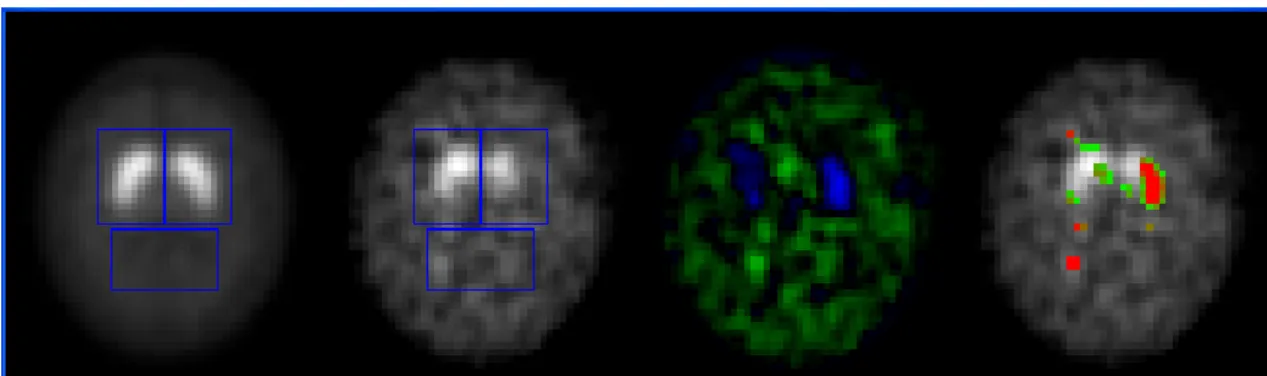
From the reference dataset, the computational solution computes the mean and standard deviation images, and the mean and standard deviation of the BPI and dimensions of the basal ganglia region. Based on these mean and standard deviation images, a voxel-by-voxel map is defined for the image under study according to a z-score scale. The z-score mapping of the DaTSCAN SPECT image shown on the right side of Figure 2 is visible in Figure 4.
Figure 4: Example of the results obtained by the computational solution: From left to right, a slice of the
mean DaTSCAN image built, based on the dataset of a normal population used as reference; correspondent slice of the registered DaTSCAN image under study; image representing the intensity differences of the two latter slices; and finally, the visual representation of the z-score map relatively to the mean and standard deviation of the reference dataset, i.e., the z-scores are represented over the image under study, only z-scores higher than 2 are depicted and the red colour means a z-score superior to 5. (The blue rectangles represent the ROIs used.)
2.3 Validation of the methodology
17
(1) First, a visual evaluation of the image registration, ROI placement, and basal ganglia segmentation was performed by two expert observers.
(2) Second, a set of 4 normal DaTSCAN images and 4 abnormal DaTSCAN images were randomly chosen to assess the robustness of the methodology against different patient positions. Afterwards, the DaTSCAN images were successively rotated 10 degrees around each axis and then processed by the computational solution. To evaluate the agreement between the original and rotated DaTSCAN SPECT images, the intraclass correlation coefficient (ICC) was computed among the four trials: the original and the three rotated. It should be noted that each rotation also included implicitly a considerable geometric shift, since the rotations were applied relative to the origin point. (3) Finally, the BPI and SBR semi-automatically computed were compared with the BPI automatically computed. For the three semi-automated methods, the image orientation, slices selection, and ROIs placement was performed by two expert observers. The correlation between the values obtained by the automated solution and the values obtained by the observers was assessed using the Pearson’s linear correlation coefficient (r) and the ICC.
2.4 Implementation
The computational solution was fully implemented in C++ and tested on a notebook PC with an Intel I7-2670QM microprocessor, 6 GB of RAM, and running Microsoft Windows 7. Techniques of image processing and visualization were implemented with the help of the following free open source toolkits: CImg, Insight Toolkit (ITK) and Visualization Toolkit (VTK).
18
3. Results
The computational methodology was visually evaluated by the expert observers using the whole experimental dataset defined. For each DaTSCAN SPECT image under study, the observers assessed the quality of registration, the placement of the volumetric ROIs, and the basal ganglia segmentation. Both observers agreed that the computational solution was highly effective in all cases.
A very high consistency was obtained for the subset of patients in different positions. ICCs of 1.000, 1.000, 0.996, 1.000 and 1.000 were reached for the BPI, volume, width, length and thickness of the basal ganglia region, respectively. The very high ICC obtained means that there was an almost perfect agreement between the values obtained with the patients in the different positions.
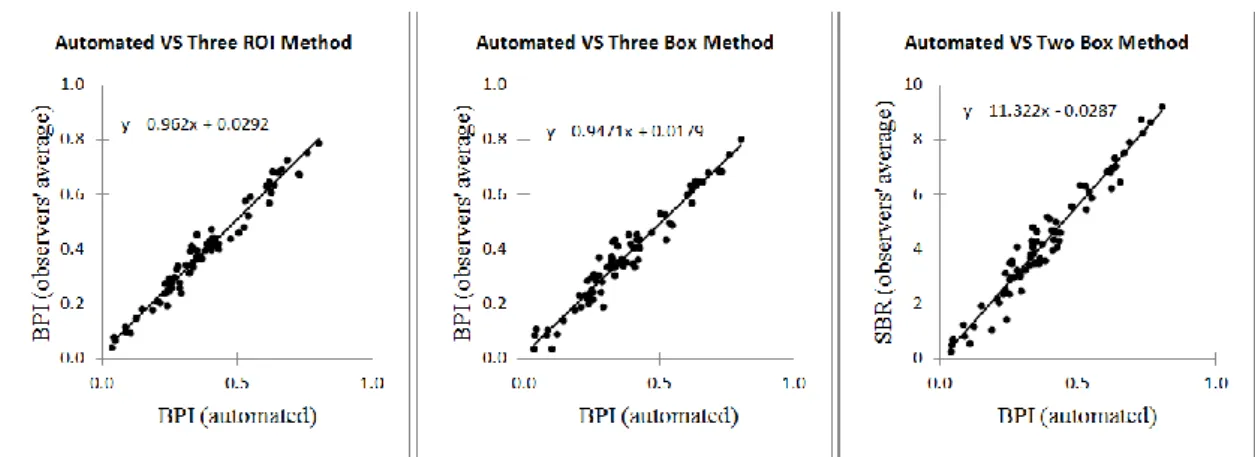
Table 2 shows the Pearson’s linear correlation coefficient among the BPI values obtained using the automated method and the BPI and SBR obtained by the observers using the semi-automated methods. The scatter diagrams in Figure 5 depict the correlation between the automated method and the semi-automated methods.
Since the automated solution presented and the semi-automated Three ROI and Three Box methods compute the same BPI, the ICCs were also computed to test the absolute agreement among them. The ICC between the BPI automatically obtained and the average BPI obtained from the two observers were 0.980 and 0.974 for the Three ROI method and Three Box method, respectively.
For the computation of the BPI or SBR using the semi-automated Three ROIs, Three Box, or Two Box methods, an experienced observer usually needs 3 to 5 minutes. On another hand, the automated computational solution only needs around 6 seconds for the
19
complete process, i.e. image registration, quantification of the BPI, image segmentation and dimensional analysis, statistical analysis, and images visualization.
Table 2: Pearson’s linear correlation coefficients (r) between the BPI computed using
the automated method presented and the BPI and SBR computed using the semi-automated Three ROIs, Three Box, and Two Box methods.
Three ROI method (BPI) Three Box method (BPI) Two Box method (SBR) Observer 1 Observer 2 Observers' average Observer 1 Observer 2 Observers' average Observer 1 Observer 2 Observers' average Automated method (BPI) 0.962 0.981 0.983 0.974 0.968 0.975 0.974 0.974 0.975
Figure 5: Scatter representation of the correlation between the BPI calculated by the computational
solution and the BPI and SBR obtained from the observers using the semi-automated Three ROI, Three Box and Two Box methods.
4. Discussion
In the image registration process, a rigid geometric transformation was adopted mainly because the intention was to simulate the semi-automated methods adopted for the computation of the BPI. Some authors have used geometric transformations with scaling; however, DaTSCAN SPECT images do not have sufficient information to guarantee a robust and accurate non-rigid registration of all possible images. Therefore
20
such an approach must be used with care when only SPECT images are available, especially when images with very low BPI are to be analysed. When the SPECT image is accompanied with an anatomical image acquired by X-ray, computed tomography or magnetic resonance, then non-rigid geometric transformations could be used for the computation of the BPI; but, for the quantification of the basal ganglia dimensions, a rigid geometric transformation will always be a good option.
The results show an excellent robustness of the solution developed against different positions of the patients. In fact, an almost perfect agreement between the values obtained with the patient in distinct positions was found, which can be confirmed by the very high ICC obtained.
A very high correlation was found between the automated method and the three semi-automated methods (Table 2). These results show clearly that the semi-semi-automated methods can be replaced by the automated method presented in this work. The highest correlation was obtained between the mean values from the two observers and the BPI value from the computational solution.
Although there are small differences between the semi-automated Three ROI and Three Box methods relatively to the automated method, a high agreement was found between the BPI values obtained by the two observers using the Three ROI and Three Box methods and the BPI obtained using the automated method (ICCs = 0.980 and 0.974, respectively).
On the right scatter graph in Figure 5 can be observed that the SBR can be estimated from the BPI by multiplying the BPI by approximately 11.322. This value is very close from the value 11.8 estimated in Section 2.2.3. The tiny difference was expected since the automated method and Two Box method use different ROIs, especially the ROIs used as reference. Since there was also found a very high correlation between the BPI
21
computed using the automated method and the SBR computed using the Two Box method (Table 2), it can be concluded that the Two Box method can be replaced by the automated method.
We opted to measure the dimensions of each basal ganglia (width, length, and thickness) in the same three perpendicular directions for all DaTSCAN images. This option was chosen since, mainly for patients with Parkinson’s disease, the shape of the region with the radioactive signal represented in the SPECT image varies considerably. Thus, by fixing the directions according to each measure, the comparison of dimensions of two basal ganglia becomes feasible. This is even more important in the follow-up of patients.
In the experiments performed the threshold level used on the segmentation of the basal ganglia varies accordingly the counts on the striatum and on the parieto-occipital posterior region. Although the solution presented has leaved to good visual segmentation results on almost all DaTSCAN images, we think that using a fixed threshold level for all images will be possibly a better choice for patients comparison and follow-up.
In this work, DaTSCAN SPECT images from different gamma cameras and with distinct spatial resolutions were used in the evaluation of the proposed solution; and for all of them, the results were extremely consistent, which once again shows the reliability of the computational solution developed. Besides the dataset addressed in the results here, the computational solution was also successfully tested on DaTSCAN SPECT images acquired from other imaging centres using other cameras, with and without signal filtering.
Although in the examples presented in this work the DaTSCAN exams were only compared with a dataset of normal DaTSCAN, any dataset of DaTSCAN SPECT
22
images can be considered as a reference for statistical comparison. Thus, a DaTSCAN image of a patient can be easily compared with any particular population. A future work project will be the assembly of big datasets representing different populations, for instance: healthy subjects, patients with idiopathic Parkinson's disease, patients with vascular Parkinson's disease and patients with essential benign tremors. Consequently, a DaTSCAN exam could be compared with the exams of different populations, and therefore, increase the confidence and the information available for the doctor to make the diagnosis.
The segmented basal ganglia region and its dimension can be used to assist the physician in the analysis of doubtful clinical cases. This could be done by visualising the shape of the basal ganglia region and by comparing the length of the basal ganglia (Figure 3) with the mean length of the normal population.
The methodology presented was tested on DaTSCAN SPECT images, but we think it could also be successfully applied to quantify the availability of dopamine receptors based, for instance, in [123I]IBZM SPECT images. Possibly, this will be a future task.
5. Conclusions
To conclude, the computational solution developed revealed high accuracy and robustness for the analysis of normal and abnormal DaTSCAN SPECT images. Therefore, it can assist in the quantification of the BPI and SBR, under the supervision of an expert. We also think that the z-score image and the 3D visualization of the segmented basal ganglia region and its quantification are of considerable value for medical diagnoses. Finally, the automatic comparison with the values of the population selected as reference can be helpful for the professionals in this area.
23
Since the computational solution developed accepts 3D images stored in several file formats with different pixel spacing and slice thickness from different gamma cameras, it can be easily used by research groups and integrated in other software solutions.
Acknowledgements
This work was partially done in the scope of the project “Methodologies to Analyze Organs from Complex Medical Images – Applications to Female Pelvic Cavity”, with reference PTDC/EEA-CRO/103320/2008, financially supported by Fundação para a Ciência e a Tecnologia (FCT), in Portugal.
The first author would like to thank Fundação Calouste Gulbenkian, in Portugal, for his PhD grant.
References
1. Tatsch K, Poepperl G. Quantitative approaches to dopaminergic brain imaging. Q J Nucl Med Mol Imaging 2012;56(1):27-38.
2. Varrone A, Halldin C. New developments of dopaminergic imaging in Parkinson's disease. Q J Nucl Med Mol Imaging 2012;56(1):68-82.
3. O’Brien JT, Colloby S, Fenwick J, Williams ED, Firbank M, Burn D, et al. Dopamine transporter loss visualized with FP-CIT SPECT in the differential diagnosis of dementia with Lewy bodies. Arch Neurol 2004;61(6):919-25.
4. Scherfler C, Seppi K, Donnemiller E, Goebel G, Brenneis C, Virgolini I, et al. Voxel-wise analysis of [123I]b-CIT SPECT differentiates the Parkinson variant of multiple system atrophy from idiopathic Parkinson’s disease. Brain 2005;128:1605-12. 5. Catafau AM, Tolosa E. Impact of dopamine transporter SPECT using 123I-Ioflupane
on diagnosis and management of patients with clinically uncertain Parkinsonian syndromes. Mov Disord 2004;19(10):1175-82.
6. Tolosa E, Wenning G, Poewe W. The diagnosis of Parkinson’s disease. Lancet Neurol 2006;5:75-86.
7. Badiavas K, Molyvda E, Iakovou I, Tsolaki M, Psarrakos K, Karatzas N. SPECT imaging evaluation in movement disorders: far beyond visual assessment. Eur J Nucl Med Mol Imaging 2011;38(4):764-73.
8. Zaidi H, Fakhri GE. Is absolute quantification of dopaminergic neurotransmission studies with 123I SPECT ready for clinical use? Eur J Nucl Med Mol Imaging 2008;35(7):1330-33.
24
9. Ritt P, Vija H, Hornegger J, Kuwert T. Absolute quantification in SPECT. Eur J Nucl Med Mol Imaging 2011;38 (Suppl 1):S69-S77.
10. Costa DC, Verhoeff NPLG, Cullum ID, Ell PJ, Syed GMS, Barrett J, et al. In vivo characterisation of 3-iodo-6-methoxybenzamide 123I in humans. Eur J Nucl Med Mol Imaging 1990;16(11):813-16.
11. Radau PE, Linke R, Slomka PJ, Tatsch K. Optimization of automated quantification of 123I-IBZM uptake in the striatum applied to Parkinsonism. J Nucl Med 2000;41:220-27.
12. Pöpperl G, Radau P, Linke R, Hahn K, Tatsch K. Diagnostic performance of a 3-D automated quantification method of dopamine D2 receptor SPECT studies in the differential diagnosis of parkinsonism. Nucl Med Commun 2005;26:39-43.
13. Mirzaei S, Zakavi R, Rodrigues M, Schwarzgruber T, Brücke T, Bakala J, et al. Fully automated 3D basal ganglia activity measurement in dopamine transporter scintigraphy (Spectalyzer). Ann Nucl Med 2010;24:295-300.
14. Habraken JBA, Booij J, Slomka P, Sokole EB, Royen EAv. Quantification and visualization of defects of the functional dopaminergic system using an automatic algorithm. J Nucl Med 1999;40:1091-97.
15. Jensen PS, Ziebell M, Skouboe G, Khalid U, Nijs Rd, Thomsen G, et al. Validation of a method for accurate and highly reproducible quantification of brain dopamine transporter SPECT studies. J Nucl Med Technol 2011;39:271-78.
16. Calvini P, Rodriguez G, Inguglia F, Mignone A, Guerra UP, Nobili F. The basal ganglia matching tools package for striatal uptake semi-quantification: description and validation. Eur J Nucl Med Mol Imaging 2007;34:1240-53.
17. Zubal IG, Early M, Yuan O, Jennings D, Marek K, Seibyl JP. Optimized, automated striatal uptake analysis applied to SPECT brain scans of Parkinson’s disease patients. J Nucl Med 2007;48:857-64.
18. Buchert R, Berding G, Wilke F, Martin B, Borczyskowski Dv, Mester J, et al. IBZM tool: a fully automated expert system for the evaluation of IBZM SPECT studies. Eur J Nucl Med Mol Imaging 2006;33(9):1073-83.
19. Koch W, Radau PE, Hamann C, Tatsch K. Clinical testing of an optimized software solution for an automated, observer-independent evaluation of dopamine transporter SPECT studies. J Nucl Med 2005;46(7):1109-18.
20. Morton RJ, Guy MJ, Clauss R, Hinton PJ, Marshall CA, Clarke EA. Comparison of different methods of DatSCAN quantification. Nucl Med Commun 2005;26(12):1139-46.
21. Press WH, Teukolsky SA, Vetterling WT, Flannery BP. Numerical Recipes: The Art of Scientific Computing. Third ed. New York: Cambridge University Press, 2007.
22. Taylor C, Colchester A, editors. Quantitative comparison of sinc-approximating kernels for medical image interpolation. Proceedings of the Medical Image Computing and Computer-Assisted Intervention; 1999 September 19-22; Cambridge, UK. Springer-Verlag.
23. Costa DC, Walker Z, Dizdarevic S, Ionnides C. Striatal binding of FP-CIT: a simple method to separate Parkinson’s disease patients and normal controls. Eur J Nucl Med Mol Imaging 1989;25:1069.
24. Tossici-Bolt L, Hoffmann SMA, Kemp PM, Mehta RL, Fleming JS. Quantification of [123I]FP-CIT SPECT brain images: an accurate technique for measurement of the specific binding ratio. Eur J Nucl Med Mol Imaging 2006;33(12):1491-99.