i i
“main” — 2018/9/19 — 22:09 — page 135 — #1
i i
Revista Brasileira de Geof´ısica (2018) 36(2): 135-148 © 2018 Sociedade Brasileira de Geof´ısica ISSN 0102-261X
www.scielo.br/rbg
DETECTION OF SEEPAGE SLICKS IN CANTARELL COMPLEX (GULF OF MEXICO)
USING POLARIMETRIC SAR DATA OF RADARSAT-2
Sarah Barr´on Torres
1, Luiz Bevilacqua
2, Fernando Pellon de Miranda
3and Carlos Henrique Beisl
3ABSTRACT.The occurrence of oil seeps on the sea surface from active petroleum systems has been extensively documented by radar imaging using SAR (Synthetic Aperture Radar). Polarimetry is consolidating in the oil industry as a sophisticated technique for the study of marine seeps. The Cantarell Complex, located in the Gulf of Mexico, is currently the most prolific natural seep site in the world. This paper aims to add to the discussion on the physical properties of seepage slicks from full polarimetric data (quad-pol) from RADARSAT-2 satellite. The fact that the research was based on two images (ID#02 and ID#04) acquired at the same place and with the same mode of operation but with a time lapse between acquisitions and different incidence angles allowed to evaluate the influence of the imaging geometry on target signatures. To this end, samples of four classes (sea, offshore platform, oil and false targets) were collected. The data of the samples were afterwards shown in graphs and plotted in the classification plan of Cloude & Pottier – entropy (H)vs.alpha angle (¯α) – for backscattering mechanism analysis. Such elements made it possible to certify that (i) the sea is a Bragg type surface regardless the incidence angle, (ii) platforms have double-bounce scattering, but small incidence angles are inadequate for their characterization, (iii) false targets (associated in ID#02 to regions of little wind) are moderately random/quasi deterministic surfaces, and (iv) oil behaves either as a Bragg (19.0◦–22.7◦incidence angle range) or as a random/anisotropic surface (33.7◦–36.7◦incidence angle range).
Keywords:H-¯α diagram, incidence angle, radar imaging, marine seeps.
RESUMO.A ocorrˆencia de exsudac¸˜oes de ´oleo na superf´ıcie do mar a partir de sistemas petrol´ıferos ativos vem sendo extensivamente documentada por imageamento utilizando sistemas SAR (Synthetic Aperture Radar). A polarimetria est´a se consolidando na ind´ustria do petr´oleo como uma t´ecnica sofisticada para o estudo deseeps
marinhos. O Complexo de Cantarell, situado no Golfo do M´exico, ´e atualmente o local de exsudac¸˜ao natural de ´oleo mais prol´ıfico do globo terrestre. Este trabalho visou contribuir com a discuss˜ao acerca das propriedades f´ısicas de escapes de ´oleo a partir dos dados polarim´etricos completos (quad-pol) do sat´elite RADARSAT-2. O fato da pesquisa valer-se de duas imagens (ID#02 e ID#04) adquiridas no mesmo local e modo de operac¸˜ao, mas com intervalo entre as aquisic¸˜oes e diferentes ˆangulos de incidˆencia, possibilitou avaliar a influˆencia da geometria de imageamento na assinatura dos alvos. Com esse prop´osito, foram geradas amostras de quatro classes (mar, plataforma, ´oleo e falso alvo), que tiveram os dados posteriormente relacionados em gr´aficos e no plano de classificac¸˜ao de Cloude & Pottier – entropia (H)vs.ˆangulo alfa (¯α) – para an´alise do mecanismo de espalhamento. Tais elementos permitiram atestar que (i) o mar ´e uma superf´ıcie do tipoBraggindependente do ˆangulo de incidˆencia, (ii) as plataformas tˆem espalhamentodouble-bounce, mas baixos ˆangulos s˜ao inadequados para sua caracterizac¸˜ao, (iii) falsos alvos (associados em ID#02 a regi˜oes de baixo vento) s˜ao superf´ıcies moderadamente aleat´orias/quase determin´ısticas, e (iv) o ´oleo comporta-se ou comoBragg(19,0◦–22,7◦), ou como uma superf´ıcie aleat´oria/anisotr´opica (33,7◦–36,7◦).
Palavras-chave: diagramaH-¯α, ˆangulo de incidˆencia, imagem de radar,seepsmarinhos.
1Universidade Federal do Rio de Janeiro, Laborat´orio de Sensoriamento Remoto por Radar Aplicado `a Ind´ustria do Petr´oleo, LabSAR, Centro de Tecnologia, Bloco I, sala I-114, Cidade Universit´aria, 21941-972 Rio de Janeiro, RJ, Brazil. Phone: +55(21) 3938-8433/99922-4504 – E-mail: sarah.barron89@gmail.com
2Universidade Federal do Rio de Janeiro, Instituto Alberto Luiz Coimbra de P´os-Graduac¸˜ao e Pesquisa de Engenharia, COPPE, Centro de Tecnologia, Bloco B, sala 101, Cidade Universit´aria, 21945-970 Rio de Janeiro, RJ, Brazil. Phone: +55(21) 2562-8461 – E-mail: bevilacqua@coc.ufrj.br
3Universidade Federal do Rio de Janeiro, Laborat´orio de Sensoriamento Remoto por Radar Aplicado `a Ind´ustria do Petr´oleo, LabSAR, Centro de Tecnologia, Bloco I, sala I-114, Cidade Universit´aria, 21941-972 Rio de Janeiro, RJ, Brazil. Phone: +55(21) 3938-8433 – E-mails: pellon@labsar.coppe.ufrj.br;
INTRODUCTION
The oil industry is in growing activity, still being considered the major source of primary energy in most parts of the world (IEA, 2015). Multidisciplinary scientific development promotes the reduction of exploratory risks, reducing the companies’ costs and making the operation capable of ensuring the return of in-vestments in the long term. The occurrence of oil on the sea sur-face infers two alternatives, either leakage from active petroleum systems resulting in features usually called seepage slicks, or spills (including accidents in platforms and operation problems among others).
The acknowledged existence of natural oil seep in the Gulf of Mexico makes the region of great economic and environ-mental interest. Mexico is the tenth largest oil exporter in the world (IEA, 2015). The Cantarell Complex, located in the Bay of Campeche, is currently the most prolific natural seep site in the world. Remote sensing is an essential tool in this exploratory scenario.
Synthetic Aperture Radar (SAR) orbital systems have stood out in the survey and monitoring of natural resources. Some of their most important attributes are the independence of solar illumination, little influence of the atmosphere during imaging (Migliaccio et al., 2012) and the detection of responses indica-tives of the targets’ electrical and geometrical properties. Po-larimetric SAR systems allow full characterization (quad-pol) of the electromagnetic wave from the targets, because they regis-ter the signature of the object scatregis-tering on the surface, keeping the measures of amplitude and phase collected at the reception (Zhang et al., 2011).
The purpose of this research was to aid, using polarimet-ric images, in the recognition and characterization of sea surface slicks. From the precepts of the literature, an analysis was found, based on the classification by Cloude & Pottier (1997), in ac-cordance with their theory of decomposition of scattering mech-anisms, that confronts the parameters entropy (H) and alpha an-gle (¯α) in a simple diagram divided into nine different zones. In this respect, Tian et al. (2010), Zhang et al. (2011), Staples & Touzi (2014) and Skrunes et al. (2014), usingH, ¯α and, some-times a third parameter, anisotropy (A), could discriminate oil-free portions of the sea surface from areas covered by oil.
The objective of this paper is to describe the physical prop-erties of the oil seeps in the Cantarell Complex to distinguish them from the surrounding medium, from information available in RADARSAT-2 satellite data obtained by SAR sensor. It also aim at (i) assessing the performance of the polarimetric classifica-tion technique based on Cloude & Pottier scattering mechanism
decomposition theory (1997); (ii) comparing the results with values in the literature and selecting the parameters that better describe the targets of interest; and (iii) analyzing the influence of the imaging geometry (changes in the incidence angle and look azimuth) on the polarimetric signature of oil scattering on the sea surface.
STUDY AREA
It is 134 km2oil region that comprises several exploration fields
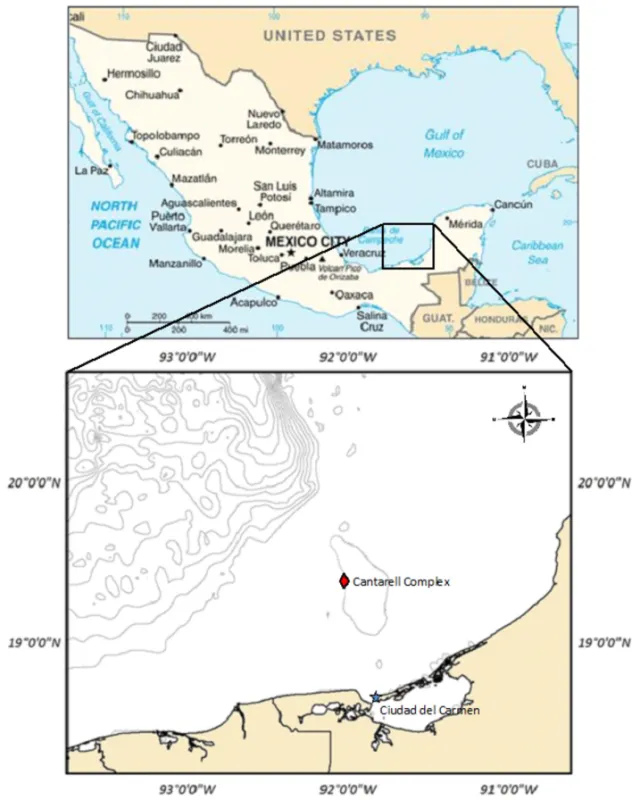
(CNH, 2013), corresponding to the Cantarell Complex, located approximately 80 km northeast from Ciudad del Carmen, in the Bay of Campeche, inserted in the Mexican portion of the Gulf of Mexico (Fig. 1).
Cantarell was discovered in 1976 and its exploitation was conducted until recently as a monopoly of state-owned PEMEX (Petr´oleos Mexicanos). In 2004, the production volume of the Complex represented about 59% of the national total (PEMEX, 2005), when Mexico achieved record production, but from then on there was a decline. In any case, Cantarell remains one of the world’s greatest oil provinces, and the maintenance of the natural oil seep attracts both, economic and scientific interest.
GEOLOGIC CONTEXT
The stratigraphy of the Campeche Sound, in the Bay of Campeche, where the Cantarell Complex occurs, is formed mainly by carbon-ates and marine terrigens from Jurassic to Cenozoic ages, which cover older Jurassic evaporitic sequences at its base.
The oil is stored mainly in a carbonate breccia in the Cretaceous-Tertiary (K/T) boundary in structural trapping with a thickness of up to 300 m (Ibarra, 2009). The density of this es-sentially heavy oil varies from 10 to 25◦API; which is believed to be due to the early expulsion from the source rock and not to biodegradation.
The tectonic evolution comprises three major events that define four structural styles, which are, from the oldest to the most recent, originated by: (i) extension efforts, (ii) compres-sion efforts, (iii) transpressive efforts and (iv) late extencompres-sion event (Flores Ibarra et al., 2013).
Theoretical Revision
Performing a polarimetric SAR data decomposition involves ob-taining information on the scattering mechanism, allowing to separate the different contributions of the interaction process with the target of the incident electromagnetic pulse (ESA, 2015). The technique of Cloude & Pottier (1997) is among the most cited in the literature for application when the targets of interest
i i
“main” — 2018/9/19 — 22:09 — page 137 — #3
i i
TORRES SB, BEVILACQUA L, MIRANDA FP & BEISL CH
137
Figure 1 – Localization map of the study area (Source: Power Engineering, 2015). The red lozenge represents the Cantarell Complex.
are non-deterministic (or extensive), i.e., targets with dimensions significantly larger that the area of illumination of the radar beam. The oil slicks studied, as well as other features of the real world, are included in this type, because they are scattered in dy-namics environments and subject to changes in space and time. In the present study, the aforementioned model was used in the analysis of polarimetric data (quad-pol) from RADARSAT-2.
The theory of decomposition by eigenvalues and eigenvec-tors of the coherency matrix (T3) of Cloude & Pottier (1997) three parameters are used to facilitate polarimetric SAR data analysis (Lee & Pottier, 2009):
• Entropy (H) – measures the degree of randomness where:
– H = 0, scattering controlled by a pure or punctual target, in which the signal is fully polarized; – 0 < H < 1, final scattering mechanism
re-sults from the combination of three pure targets, and each eigenvector is weighted by the corresponding eigenvalue;
– H = 1, scattering due to the combination of the three pure targets, indicating the presence of well-distributed targets.
• Mean alpha angle (¯α) – is related to the type of mean scattering mechanism, in which:
– ¯α → 0, surface scattering, Bragg type, producing rough surfaces;
– ¯α → 45◦, volumetric-type scattering;
– ¯α → 90◦, double-bounce-type scattering, gener-ated by a dihedral reflector.
• Anisotropy (A) – it complements entropy. It provides information of the relative importance of two of the scat-tering mechanisms.
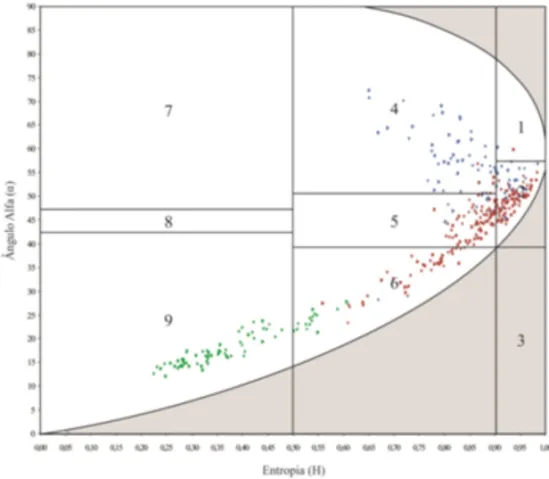
Entropy (H) and mean alpha angle (¯α) are criteria that per-mit to characterize the scattering of a medium; thus, they com-pose a binary diagram that allows classifying the targets into nine randomly divided zones (Fig. 2). Details of this segmentation are given in Cloude & Pottier (1997).
• Zone 1: high entropy – multiple scattering.
Double-bounce mechanism whereH > 0.90, observed in well-structured surfaces at the sea, like oil platforms and ships;
• Zone 2: high entropy – volume scattering.
Volumetric scattering, given by ¯α, in environment of H > 0.90, comprising single scattering irradiated from a cloud of acicular anisotropic particles or multiple scatter-ing from a cloud of low loss symmetric particles. This can be produced by some types of surfaces with highly random anisotropic scattering elements;
• Zone 3: high entropy – surface scattering.
This zone is considered not valid because it is impos-sible to distinguish surface scattering in environment of H > 0.90;
• Zone 4: medium entropy – multiple scattering.
Dihedral scattering in environment of medium entropy, in which the double-bounce mechanism occurs in theP and L bands because of their higher penetration. This zone can also be related to urban areas in the presence of dense scatter arrangements that can generate moderate entropy and low order of dominant multiple scattering;
• Zone 5: medium entropy – volume scattering.
Moderate entropy associated with a predominance of dipole type scattering. The increase of entropyH is due to a central statistical distribution of the orientation angle.
• Zone 6: medium entropy – surface scattering.
It reflects entropy increase due to roughness increase be-cause of, for example, effects of wave propagation at the sea surface;
• Zone 7: low entropy – multiple scattering events. Domain of low entropy associated with even bounce and double-bounce mechanisms, such as those generated by isolated dielectric scatters and metallic dihedrons; • Zone 8: low entropy – dipole modelled scattering.
Strong correlated mechanisms occur, which have a large amplitude imbalance betweenShhandSvv. An isolated dipole scatter could account for this behavior, as well as the scattering could derive from low wind speeds or sea states and no wave breaking.
• Zone 9: low entropy – surface scattering.
Modeled by Bragg type surface scattering and specular reflection, which do not involve 180◦ phase inversion betweenShhandSvv.
METHODOLOGY
The study method was organized in stages. The first stage con-sisted in the acquisition of previous and relevant information on the subject, through literature review, deepening the knowledge of radar sensor and concepts of polarimetry.
RADARSAT-2 satellite images were selected for the study (Figs. 3 to 6) – obtained in Fine Quad-Pol mode of operation, in the Bay of Campeche, near the Cantarell Complex. Of the four images that were avaiable, two pairs of sequenced acquisition, two with different incidence angle in which the targets aimed were better positioned (Table 1) were chosen. The first, in descending orbit, with spatial resolution of 13.50 m, was acquired on Septem-ber 20, 2009, in the FQ2W mode of operation, with incidence angle varying in the range from 19.0◦to 22.7◦. The second im-age, ascending, spatial resolution of 8.70 m, from March 1, 2011, FQ15W mode of operation, comprises the range from 33.7◦ to 36.7◦of incidence angle.
RADARSAT-2 data preprocessing consisted on the geomet-ric/radiometric correction using the SNAP (Sentinel Application Platform) software, adequate for polarimetric images. After the polarimetric treatment, the raw data was submitted to calibration procedures, multilooking, generation of coherency matrix (T3), Speckle filtering in the Refined Lee mode andH-A-α type de-composition, in that sequence, to improve visual interpretation and obtain information on the target scattering process.
i i
“main” — 2018/9/19 — 22:09 — page 139 — #5
i i
TORRES SB, BEVILACQUA L, MIRANDA FP & BEISL CH
139
Figure 2 –H-¯α classification plan with its nine allowable zones (Source: ESA, 2015).
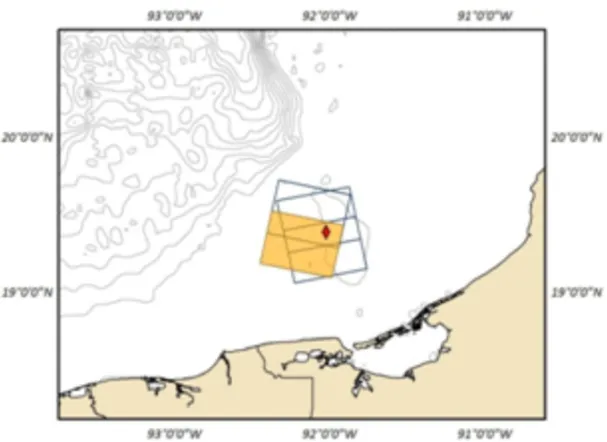
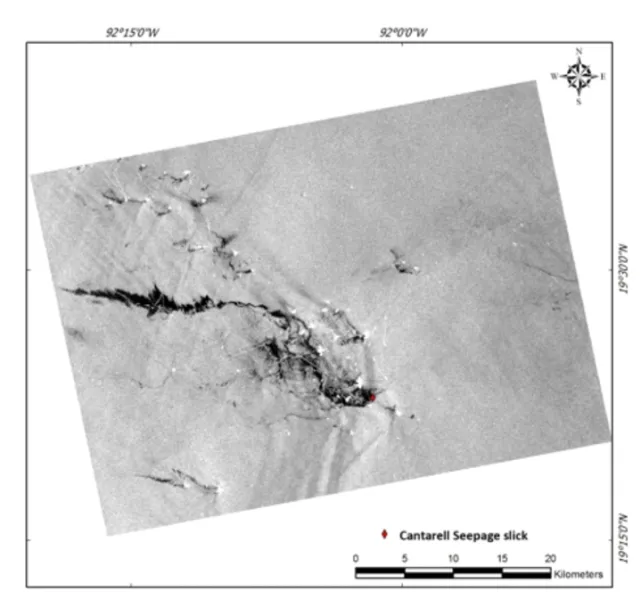
Figure 3 – Location map of RADARSAT-2 satellite polarimetric image ID#02 (FQ2W acquisition mode). The red lozenge
indicates the position of Cantarell oil seep.
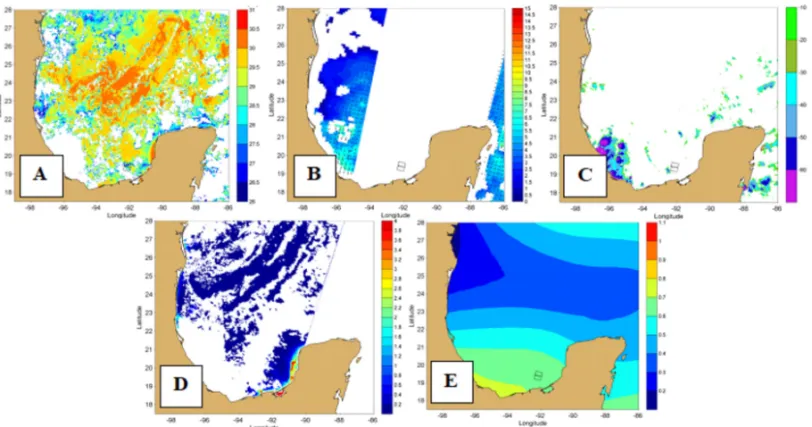
The orbital meteo-oceanographic maps available – sea sur-face temperature (SST), wind field, cloud top temperature (CTT), chlorophyll-a concentration, and significant wave height – were used as support for interpretation (Figs. 7 and 8) in an attempt to eliminate false targets, as reported in Miranda et al. (2004).
Georeferenced versions of ID#02 and ID#04 were prepared
to export them aiming at sample generation, sized 3×3 pixels, in ArcGIS software, of four targets (oil, platform, sea and false target), in amount enough to obtain the most representative geo-graphic distribution of each class in the images (Table 2). Again in SNAP, the samples from the preprocessing decomposition product, i.e., the coherency matrix (T3) with Speckle removal
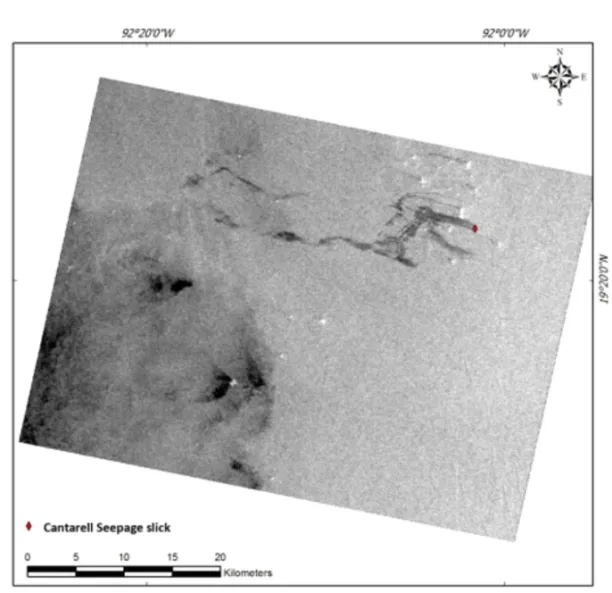
Figure 4 – RADARSAT-2 image with VV type polarization in ID#02, FQ2W, acquired on September 20, 2009, at 12:11:39 GMT
(Source: LabSAR, 2016).
Table 1 – Selected images and location specifications, acquisition mode, spatial resolution, window size, incidence angle, acquisition date and time.
ID# Location Acquisition
Spatial Window Incidence Date Acquisition Mode Resolution Size Angle Range (month, day, Time
(meters) (km× km) (◦) year) (*) 02 Cantarell FQ2W 13.50 50×25 19.0–22.7 Sep 20, 2009 12:11:39 04 Cantarell FQ15W 8.70 50×25 33.7–36.7 March 1, 2011 00:16:08
*GMT – Greenwich Mean Time.
employing Refined Lee filter were analyzed. The samples were imported as masks that allowed obtaining the Cloude & Pottier diagrams (1997) through a tool of the software itself. Data ex-traction took place in two moments. First, the values of row, col-umn, incidence angle and backscattering coefficient (shown as a function of intensityHH, HV , V V – converted into dB) of the central pixel of the individual samples were acquired.
Then, with the values mentioned in the previous paragraph known, the entropy (H) and alpha angle (¯α) were determined,
calculated as a mean of the nine pixels (3×3 samples). With this data set, a database to visualize the registers in a dynamics manner and combine them into illustrative schemes according to the need for analysis/interpretation was created.
The SAR images, maps and software programs used in the project were acquired or produced by the Laboratory of Radar Re-mote Sensing applied to the Oil Industry (LabSAR), linked to the Laboratory of Computational Methods in Engineering (LAMCE), of COPPE/UFRJ, that has developed researches on oil seepage
i i
“main” — 2018/9/19 — 22:09 — page 141 — #7
i i
TORRES SB, BEVILACQUA L, MIRANDA FP & BEISL CH
141
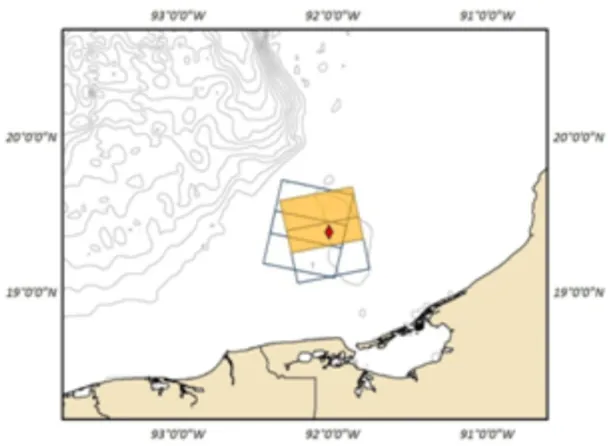
Figure 5 – Location map of RADARSAT-2 satellite polarimetric image ID#04 (FQ15W acquisition mode). The red lozenge
indicates the position of Cantarell oil seep.
Table 2 – Amount of samples collected by class (oil, platform, sea and false target) for each image used.
ID# Incidence Class No. of ID# Incidence Class No. of
Angle Samples Angle Samples
02 19.0◦–22.7◦ Oil 200 04 33.7◦–36.7◦ Oil 200 Platform 75 Platform 75 Sea 75 Sea 75
False Target 75 False Target* X
*This class is not present in ID#04 image.
phenomenon in offshore petroleum systems for over ten years (e.g., Carvalho et al., 2016).
RESULTS
The preparation of the Cloude & Pottier diagrams (1997), that relate entropy (H) and alpha angle (¯α) (Figs. 9 and 10), repre-sents the final stage and that of highest contribution of this study. Differences in sea, platform, oil and false target behavior are note-worthy with regard to the different ranges occupied by the sam-ples’ values and to the correspondence for one or more of the nine allowable zones outlined in the mentioned diagrams.
It is through this classification plan that the characterization of the target scattering mechanisms is obtained, since for images covering approximately the same geographic area and with an
acquisition time gap, similarly to ID#02 and ID#04, disparate re-sponses are observed, that are the object of this discussion.
Figures 11 and 12 show a comparative picture of the data already presented individually, confronting the relevant targets and promoting a general visualization. Such results contribute to the discussion on the influence of imaging geometry on the polarimetric response of the objects.
The variablesH and ¯α were also statistically characterized, and the mean and standard deviation were determined (Table 3).
DISCUSSION
The interpretations of the Cloude & Pottier diagrams (1997) (Figs. 9-12) show heterogeneous responses for the samples from one image to the other, thus, the following aspects can be put
Figure 6 – RADARSAT-2 image with VV type polarization in ID#04, FQ15W, acquired on March 1, 2011, at 00:16:08 GMT
(Source: LabSAR, 2016).
Table 3 – Mean entropy (H) and alpha angle (¯α) measures of the targets and their respective standard deviations.
Image Class H¯ SH ¯α (◦) Sα ID#02 Oil 0.18897352 0.04609508 6.53 2.06 Platform 0.72161024 0.11996884 34.54 10.32 Sea 0.10080295 0.01710645 3.96 0.86 False Target 0.34103733 0.11879855 13.26 6.12 ID#04 Oil 0.86893012 0.08179045 44.37 6.70 Platform 0.84876591 0.07927618 56.06 7.06 Sea 0.38064091 0.10032235 18.28 3.93 forward:
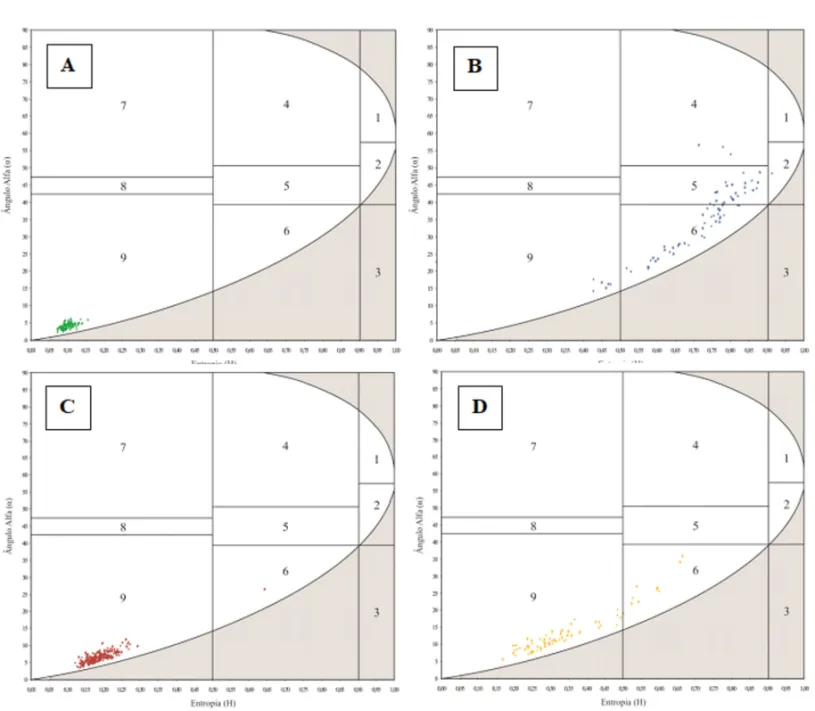
i. The sea, in ID#02, is clearly a Bragg type surface, Z9 – low entropy and small alpha angle –; this is due, in part, to the small imaging incidence angle, with less power to distinguish target roughness.
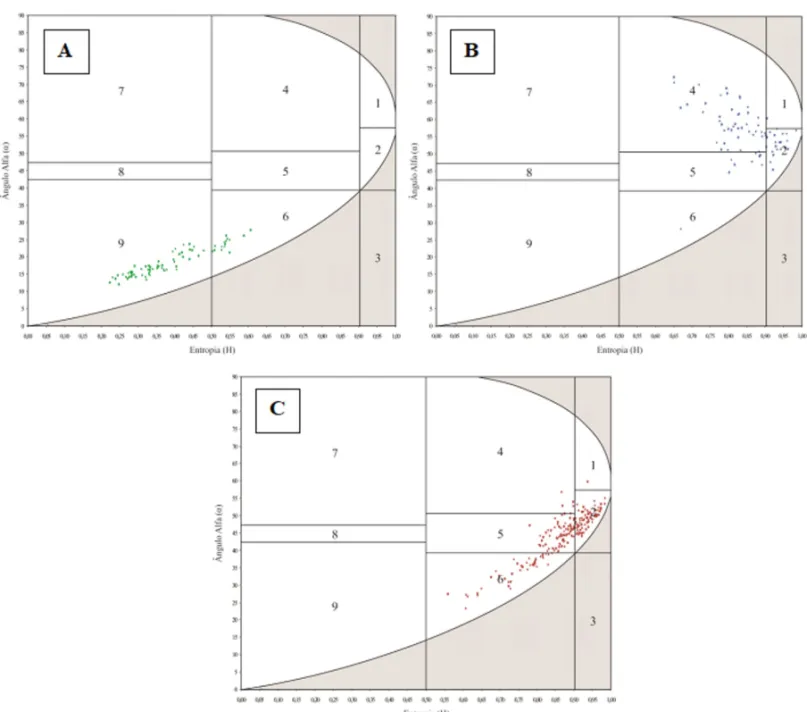
In ID#04, there is greater data dispersion (higher standard deviation), but still around the mean, tending to Bragg type surface scattering, Z9.
ii. Concerning the platforms, ID#02 does not provide a good characterization, because the range of incidence an-gle is not appropriate for observation and the standard de-viation of the samples is large. Here, the platforms would compose Z5 – medium entropy and medium alpha angle – and Z6.
In ID#04, a more uniform concentration of the samples is observed in the field Z4 – medium entropy and large alpha angle –, where multiple scattering mechanisms
i i
“main” — 2018/9/19 — 22:09 — page 143 — #9
i i
TORRES SB, BEVILACQUA L, MIRANDA FP & BEISL CH
143
Figure 7 – ID#02 maps, (A) Sea Surface Temperature (SST) (◦C); (B) Wind Field (m/s); (C) Cloud Top Temperature (CTT) (◦C); (D) Chlorophyll-a Concentration (mg/m3) and (E) Significant Wave Height (meters).
Figure 8 – ID#04 maps, (A) Cloud Top Temperature (CTT) (◦C); (B) Wind Field (m/s); (C) Wind Field in accordance to GFS (m/s); and (D) Significant Wave Height (meters).
Figure 9 –H-¯α diagrams for each target class selected in the ID#02 image, where A = sea, B = platform, C = oil, D = false target. The range of the incidence angle is
from 19.0◦to 22.7◦.
predominate, effects of the propagation of double-bounce reflection.
iii. False targets were only specified in ID#02; they refer to portions of the image that are misunderstood as oil slick, but, are in fact associated with areas with low wind – speed below 3 m/s, which cause the attenuation of the energy by the surface, reflecting darker shades of gray. In theH-¯α diagrams, this class can be seen in Z9 and Z6, once the standard deviation is high.
iv. Concerning the oil, it did not affect the Bragg surface in the range 19-22,7◦, ID#02, staying in Z9. The dispersion of the points is noticeably small, but the standard
devia-tion calculated does not reflect this behavior, because an outlier, positioned in Z6, which has much higher entropy and higher alpha angle than the rest of the group. Although it is a surface with a very smooth texture, and that low entropy and small alpha angle are expected, it is plausible to impute part of this response to the small imaging incidence angle.
ID#04 is quite different from the first image; the oil occu-pies mostly Z2 – high entropy and medium alpha angle –, Z5 and Z6, and isolated points in Z1 – high entropy and large alpha angle – and Z4. In short, within the range of incidence angle from 33.7 to 36.7◦, the randomness is significant.
i i
“main” — 2018/9/19 — 22:09 — page 145 — #11
i i
TORRES SB, BEVILACQUA L, MIRANDA FP & BEISL CH
145
Figure 10 –H-¯α diagrams for each of the target classes selected in the ID#04 image, where A = sea, B = platform, C = oil. The range of the incidence angle is from
33.7◦to 36.7◦.
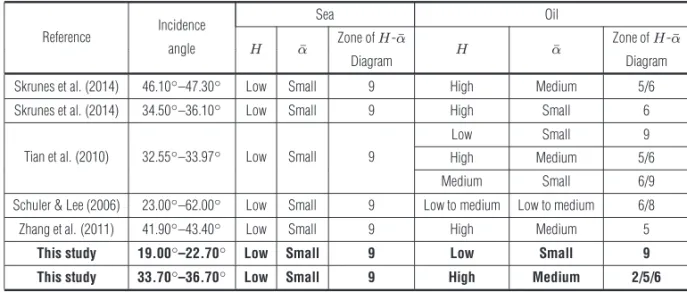
Table 4 proposes a way to visualize the results reported by some authors of the behavior of oil and sea targets according to the polarimetric characteristics presented by them. The qualita-tive designations associated to entropy (H) and alpha angle (¯α), such as low, medium, high, were mostly established based on the measured numbers available, with the exception of some visual estimates made from the color scale in maps found in the liter-ature. The Zone column of theH-¯α diagram corresponds to an approximation of what would be found graphically, if the refer-ence values of the mentioned authors were plotted, since it is still uncommon to find publications that represent theH-¯α plan as in Figure 2, although the Cloude & Pottier classification (1997) has been considerably used.
Staples & Touzi (2014) argue that, for small incidence an-gles, of less than 30◦, sea and oil show similarH values but, as the incidence angle increases, the entropy of the oil increases, while that of the sea remains essentially constant. It is important to highlight that this does not happen when incidence angle and alpha angle are associated.
As can be seen, except for one of the three types of oil de-scribed by Tian et al. (2010), all authors follow the relationship above for entropy and incidence angle, including those mentioned in this paper. Although there are no comparative cases for low in-cidence angles, such as that of ID#02 imagethe result obtained for ID#04 image is what was expected, according to the theory and the literature.
Figure 11 –H-¯α diagram comparing all targets in ID#02 image, where green = sea, blue = platform, red = oil,
yellow = false target.
i i
“main” — 2018/9/19 — 22:09 — page 147 — #13
i i
TORRES SB, BEVILACQUA L, MIRANDA FP & BEISL CH
147
Table 4 – Behavior of the sea and oil targets under different incidence angles by different authors according to the polarimetric characteristics
H and ¯α qualitatively characterized, and the resulting estimated zone of the Cloude & Pottier classification plan (1997).
Reference Incidence
Sea Oil
angle H α¯ Zone ofH-¯α H ¯α Zone ofH-¯α
Diagram Diagram
Skrunes et al. (2014) 46.10◦–47.30◦ Low Small 9 High Medium 5/6
Skrunes et al. (2014) 34.50◦–36.10◦ Low Small 9 High Small 6
Tian et al. (2010) 32.55◦–33.97◦ Low Small 9
Low Small 9
High Medium 5/6
Medium Small 6/9
Schuler & Lee (2006) 23.00◦–62.00◦ Low Small 9 Low to medium Low to medium 6/8
Zhang et al. (2011) 41.90◦–43.40◦ Low Small 9 High Medium 5
This study 19.00◦–22.70◦ Low Small 9 Low Small 9
This study 33.70◦–36.70◦ Low Small 9 High Medium 2/5/6
CONCLUSION
Given four classes of interest (sea, platform, false target and oil), the entropy (H)vs.alpha angle (¯α) diagrams of Cloude & Pot-tier (1997) and the analysis of the influence of the different imag-ing incidence angles, the followimag-ing conclusions in relation to their scattering mechanisms arose:
i. The sea is a Bragg type scattering surface, regardless the incidence angle under which it is observed;
ii. In the platforms, small incidence angles (ID#02) proved to be inadequate to characterize the polarimetric signature. Larger angles (ID#04), in turn, are representative of the double-bounce mechanism (although large platform com-plexes respond in a more random manner);
iii. False targets (regions with little wind), only identified in ID#02, respond as moderately random/quasi determinis-tic surfaces of surface scattering;
iv. The oil, for small incidence angles (ID#02), is similar to the sea, responding with a Bragg type surface. The crease in entropy is concomitant with the increase in in-cidence angle (ID#04); alpha angle also increases, but in a less expressive proportion, describing a random and/ or anisotropic surface.
The results presented here, are in accordance with the findings of authors such as Skrunes et al. (2014) and Tian et al. (2010), where the incidence angle and the polarimet-ric characteristics are similar.
The objective of this study was successfully achieved, con-tributing to future discussions/researches on the use of SAR
polarimetry for characterizing targets in marine environment. It is suggested to assess other polarimetric classification techniques based on target scattering mechanisms, among them Freeman & Durden (1998) and Van Zyl (1989), as well as approaches asso-ciated with compact polarimetry.
ACKNOWLEDGEMENTS
To COPPE, for the history of scientific encouragement through different academic Master’s and Doctor’s degree programs and faculty; to LabSAR because of the structure, team, software pro-grams and data made available; and to CNPq for providing the scholarship that allowed full-time dedication to the activities of this project.
REFERENCES
CARVALHO GA, MINNETT PJ, MIRANDA FP, LANDAU L, MOREIRA F & BEISL CH. 2016. The Use of a RADARSAT-derived Long-term Dataset to Investigate the Sea Surface Expressions of Human-related Oil spills and Naturally Occurring Oil Seeps in Campeche Bay, Gulf of Mexico. Cana-dian Journal of Remote Sensing [ISSN 1712-798X], 42(3): 307–321. CLOUDE SR & POTTIER E. 1997. An Entropy Based Classification Scheme for Land Applications of Polarimetric SAR. IEEE Transactions on Geoscience and Remote Sensing, 35(1): 68–78.
CNH – Comisi´on Nacional de Hidrocarburos. 2013. Dictamen T´ecnico del Proyecto de Explotaci´on Cantarell (Modificaci´on Sustantiva). SENER, Secretar´ıa de Energ´ıa, Estados Unidos Mexicanos (July).
ESA – European Space Agency. 2015. SENTINEL-1 Toolbox (S1TBX) – Polarimetric Tutorial. (March). Available on: <https://sentinel.esa.int/ web/sentinel/toolboxes>. Access on: August 28, 2017.
FLORES IBARRA K, MATA CASTILLO C & N´APOLES VALENZUELA JI. 2013. Sonda de Campeche. Available on:<http://es.slideshare.net/ ivannapoles1/sonda-de-campeche>. Access on: August 28, 2017. FREEMAN A & DURDEN SLA. 1998. A Three-Component Scattering Model for Polarimetric SAR Data. IEEE Transactions on Geoscience and Remote Sensing, 36(3): 963–973.
IBARRA RM. 2009. Dolomitizaci´on y generaci´on de porosidad vugular en la brecha K/T del Campo Cantarell, Zona Marina – Campeche. PhD Thesis, Universidad Nacional Autonoma de Mexico.
IEA – International Energy Agency. 2015. Key World Energy Statistics. France, 77 pp.
LabSAR – Laborat´orio de Sensoriamento Remoto por Radar Aplicado `a Ind´ustria do Petr´oleo. 2016. 3rd Final Report. Novas Tecnologias para o Sensoriamento Remoto de Exsudac¸˜oes de ´Oleo na Superf´ıcie Marinha, UFRJ, Brazil.
LEE SE & POTTIER E. 2009. Polarimetric radar imaging: from basics to applications. CRC Press: Taylor & Francis Group, 398 pp.
MIGLIACCIO M, NUNZIATA F, BROWN CE, HOLT B, LI X, PICHEL W & SHIMADA M. 2012. Polarimetric Synthetic Aperture Radar utilized to Track Oil Spills. Eos, 93(16): 161–163.
MIRANDA FP, MARM ´OL AMQ, PEDROSO EC, BEISL CH, MEDRANO L & WELGAN P. 2004. Analysis of RADARSAT-1 data for offshore monitor-ing activities in the Cantarell Complex, Gulf of Mexico, usmonitor-ing the unsu-pervised semivariogram textural classifier (USTC). Canadian Journal of Remote Sensing, 30: 424–436.
PEMEX – Petr´oleos Mexicanos. 2005. Boletines de Prensa. Preci-siones respecto al comportamiento del complejo Cantarell. Available
on: <http://web.archive.org/web/20070629162437/http://www.pemex. com/index.cfm?action=content§ionID=8&catID=40&subcatID =3672>. Access on: August 28, 2017.
POWER ENGINEERING. 2015. Mexico sets 25% pollution cut by 2030 for climate talks. 03/30/2015. Available on: <http://www.power- eng.com/articles/2015/03/mexico-sets-25-pollution-cut-by-2030-for-climate-talks.html>. Access on: September 3, 2017.
SCHULER DL & LEE JS. 2006. Mapping ocean surface features using biogenic slick-fields and SAR polarimetric decomposition techniques. IEE Proceedings – Radar, Sonar and Navigation, 153(3): 260–270. SKRUNES S, BREKKE C & ELTOFT T. 2014. Characterization of Marine Surface Slicks by Radarsat-2 Multipolarization Features. IEEE Transac-tions on Geoscience and Remote Sensing, 52(9): 5302–5319. STAPLES G & TOUZI R. 2014. The Application of RADARSAT-2 Quad-Polarized Data for Oil Slick Characterization. In: International Oil Spill Conference, Savannah, Georgia, pp. 2242–2252.
TIAN W, SHAO Y, YUAN J, WANG S & LIU Y. 2010. An Experiment for Oil Spill Recognition using RADARSAT-2 Image. In: Proceedings of International Geoscience and Remote Sensing Symposium (IGARSS), Honolulu, Hawaii, USA, pp. 2761–2764.
VAN ZYL JJ. 1989. Unsupervised classification of scattering mecha-nisms using radar polarimetry data. IEEE Trans. Geosci. Remote Sens., 27: 36–45.
ZHANG B, PERRIE W, LI X & PICHEL WG. 2011. Mapping sea surface oil slicks using RADARSAT-2 quad-polarization SAR image. Geophysi-cal Research Letters, 38: L10602.
Recebido em 21 novembro, 2017 / Aceito em 30 maio, 2018 Received on November 21, 2017 / Accepted on May 30, 2018