Gonçalo Machado Monteiro Ferreira Gonçalves
Licenciado em Ciências da Engenharia Civil
Influence of materials’ hygroscopicity in the control of
relative humidity and temperature of old buildings
Dissertação para obtenção do Grau de Mestre em
Engenharia Civil – Perfil de Construção
Orientador: Doutor Fernando M. A. Henriques, Professor Catedrático da Faculdade
de Ciências e Tecnologia da Universidade Nova de Lisboa
Júri:
Presidente: Professor Doutor Rodrigo M. Gonçalves Arguente: Professor Doutor Luís G. C. Baltazar
Vogal: Professor Doutor Fernando M. A. Henriques
[Influence of materials’ hygroscopicity in the control of relative humidity and temperature of old buildings]
Copyright © Gonçalo Machado Monteiro Ferreira Gonçalves, Faculdade de Ciências e Tecnologia, Universidade Nova de Lisboa.
Acknowledgments
First of all, I would like to thank to all people in general, who I crossed with in my academic route, and are not mentioned bellow, because, somehow, they helped me to finish this important part of my academic education.
Secondly, I would like to thank to Faculdade de Ciências e Tecnologia and to Nova University of Lisbon (FCT-UNL) for giving me the opportunity to, not only graduate myself and improve my scientific knowledge, but also for allowing me to know many important friends and to experience some remarkable moments.
I would like to thank to Fraunhofer Institut fur Bauphysic for making me available a student licence of
sotware Wufi Plus, that allowed me to make all hygrothermal simulations of the present work and
without it I would not have the chance to do it.
I would like to thank to all people who works in Department of Civil Engineer (DEC), from all teachers to all employees that contribute to, every day, increase the good name of the Department and improve the quality of civil engineers of FCT.
I want to thank to my advisor, professor Doctor Fernando Henriques, for have shown to be available to guide me in this last part of the course.
To doctoral researcher Hugo Silva and Engineer Vitor Silva, I would like to truly thank you for having supported me every day and for always shown to be patient and friends. Without you I would not be able to complete this last stage of my graduation.
I have a special thanks to my colleagues and friends, that made this academic route in an unforgettable journey, in special to Rui Ribeiro, João Nobre and Filipe Rodrigues, for have been my closest partners in this long stage of our academic life.
For always supported me, encouraged me to keep focus on my goals and for our special friendship, I would like to deeply thank you, Loubna Kerfah.
I
Abstract
The comfort of buildings indoor environment and materials durability are severally affected by peaks of temperature and relative humidity (RH) in interior of buildings and therefore they should be controlled and damped.
The presence of people inside buildings as well as artificial illumination and all kind of equipment cause a releasing of moisture to environment, which originates an increment of its relative humidity. The occupants, artificial illumination and equipment also originate a temperature raising depending the occupants’ activity and the quantity and power of illumination and equipment.
In order to reach an interior environment with values of relative humidity and temperature that ensure acceptable conditions to human health and materials longevity, it is important to install measures to control them. These measures can be active or passive if, respectively, they intend to remediate the unacceptable values of RH or temperature or if those acceptable values are achieved by installing coating materials capable of control both parameters during all seasons. If the materials are able to control temperature and relative humidity of indoor, so they contribute to improving thermal and hygroscopic inertia of buildings.
Old buildings are characterized by having high thermal inertia and this means that its interior environment has a significant gap in relation to the exterior one, with regard to temperature. However, the temperature also affects relative humidity once both have an inverse relation of proportionality. This makes that it is important to damp relative humidity of old buildings indoor that would not have those values if it did not have high thermal inertia. This fact makes that be important to control relative humidity and temperature of old buildings indoor, preferably using passive measures, to preserve some very important works of art, books or documents, in case of being a museum or an archive. To control temperature and relative humidity of interior environment it is necessary to choose the best coating materials that can provide to buildings higher hygroscopic and thermal inertia. For that, it is indispensable to make correct materials characterization in order to discover their real behavior and, with base on those characteristics obtained experimentally, they could be properly chosen to be applied in buildings. In consequence of that, in the present dissertation, the materials behavior at different ranges of RH was analyzed as well as the time of exposition to those controlled environments. For that, it was chosen to make the tests of adsorption/desorption isotherm, Moisture Buffering Value (MBV), moisture permeability, thermal conductivity and response time. Additionally, the response of materials to certain interior environment was determined, by making a hygrothermal simulation in transient regime, with recourse to software Wufi Plus.
III
Resumo
O conforto do ambiente interior de edifícios e a durabilidade dos materiais podem ser seriamente afectados pelos picos de temperatura e humidade relativa (HR) no interior dos edifícios e, como tal, devem ser controlados e amortecidos.
A presença de pessoas no interior dos edifícios, bem como a iluminação artificial e qualquer tipo de equipamentos, provoca a libertação de vapor de água para o ambiente, que origina o aumento da sua humidade relativa. Os ocupantes, iluminação artificial e os equipamentos também originam o aumento da temperatura, dependendo da actividade das pessoas e da quantidade e potência da iluminação e equipamentos.
De modo a se alcançar condições de ambiente interior com valores de humidade relativa e temperatura que garantam condições aceitáveis para a saúde humana e durabilidade dos materiais, é importante implementar medidas para os controlar. Estas medidas podem ser activas ou passivas se, respectivamente, pretendem remediar valores inaceitáveis de HR ou temperatura ou, se esses valores aceitáveis são alcançados através da instalação de materiais de revestimento capazes de controlar ambos os parâmetros, durante todas as estações do ano. Se os materiais são capazes de controlar a temperatura e humidade relativa do interior, então, eles contribuem para o aumento da inércia térmica e higroscópica dos edifícios.
Os edifícios antigos são caracterizados por terem forte inércia térmica e isso significa que o ambiente interior tem um desfasamento significativo face ao ambiente exterior, no que toca à temperatura. No entanto, a temperatura também afecta a humidade relativa, uma vez que ambos têm uma relação de proporcionalidade inversa. Isto faz com que seja importante amortecer a humidade relativa do interior de edifícios antigos, que não teria esses valores se o edifício não tivesse forte inércia térmica. Este facto faz com que seja importante controlar a humidade relativa e temperatura do interior de edifícios antigos, usando preferencialmente métodos passivos, para preservar algumas obras de arte, livros ou documentos importantes, no caso de se tratar de um museu ou arquivo.
Para controlar a temperatura e humidade relativa do ambiente interior, é necessário escolher os melhores materiais de revestimento, capazes de fornecer ao edifício maior inércia higroscópica e térmica. Para tal, é indispensável realizar-se uma correcta caracterização dos materiais, de forma a descobrir o seu comportamento, o mais real possível, e, com base nessas características obtidas experimentalmente, possam ser devidamente escolhidos para serem aplicados nos edifícios. Como tal, na presente dissertação, foi analisado o comportamento dos materiais em diferentes gamas de humidade relativa, bem como o tempo de exposição dos mesmos nesses ambientes controlados. Assim, foram realizados ensaios de curvas higroscópicas, Moisture Buffering Value (MBV), permeabilidade ao vapor de água, condutibilidade térmica e tempo de reposta. Adicionalmente, foi determinada a resposta dos materiais a um certo ambiente interior, realizando uma simulação higrotérmica, em regime transiente, com recuso ao software Wufi Plus.
V
Contents
Chapter 1: Introduction ... 1
1.1. Foreword ... 1
1.2. Objectives and scope ... 2
1.3. Dissertation outline ... 3
Chapter 2: Hygrothermal performance of buildings ... 5
2.1. Moist air ... 5
2.2. Hygroscopicity ... 7
2.2.1. Moisture transfer ... 7
2.2.2. Moisture Permeability ... 12
2.2.3. Moisture Buffering Value (MBV) ... 15
2.3. Hygrothermal behavior of buildings ... 17
2.3.1. Thermal and hygric inertia ... 17
2.3.2. Condensations ... 20
2.3.3. Consequences of condensations and extreme values of relative humidity ... 21
2.3.4. Processes to lower relative humidity and their consequences ... 23
2.3.5. Influence of hygroscopic materials in temperature, relative humidity and air quality ... 26
Chapter 3: Methods ... 31
3.1. General considerations ... 31
3.2. Materials ... 31
3.3. Hygroscopic characterization ... 35
3.3.1. Equipment ... 36
3.3.2. Adsorption/Desorption Isotherm ... 41
3.3.3. Moisture Permeability ... 43
3.3.4. Thermal Conductivity ... 52
3.3.5. Moisture Buffering Value (MBV) ... 54
3.3.6. Experiment of classroom ... 59
3.3.7. Response Time ... 61
3.3.8. Use of materials ... 63
Chapter 4: Analysis of results ... 65
4.1. General considerations ... 65
4.2. Adsorption/Desorption Isotherm ... 65
4.3. Moisture Permeability ... 69
4.4. Thermal Conductivity ... 74
4.5. Moisture Buffering Value (MBV) ... 76
4.5.1. MBV at 33% - 75% RH ... 76
4.5.2. Influence of MBV interval ... 78
4.5.3. Classification of MBV ... 81
4.6. Experiment of classroom ... 82
4.6.1. Response of materials ... 82
4.6.2. Relative humidity of environment ... 88
4.7. Response Time ... 89
VI
Chapter 5: Numerical Analysis ... 95
5.1. General considerations ... 95
5.1. Adsorption/Desorption Isotherm ... 95
5.1.1. Adsorption/desorption equations ... 95
5.1.2. Specific moisture capacity ξ ... 102
5.2. Moisture Permeability ... 104
5.3. Thermal Conductivity ... 109
5.4. Moisture Buffering Value (MBV) ... 112
5.4.1. Ideal MBV ... 112
5.4.2. Penetration depth ... 113
5.5. Response time ... 115
Chapter 6: Hygrothermal Simulation ... 121
6.1. General considerations ... 121
6.2. Wufi Plus ... 121
6.3. Verification of MBV of studied materials ... 122
6.4. Sensivity study ... 125
6.4.1. Building characterization ... 125
6.4.2. Study’s procedure ... 127
6.4.3. Analysis of results ... 129
6.5. Influence of studied materials in interior climate ... 138
6.5.1. Materials’ characterization ... 139
6.5.2. Analysis of results ... 141
Chapter 7: Conclusions ... 145
7.1. Final conclusions ... 145
VII
List of Figures
Figure 2.1 – Air constitution ... 5
Figure 2.2 – Example of psychrometric diagram ... 7
Figure 2.3 – Relation between pores’ radius and relative humidity in which occurs interstitial condensation (Kelvin Law) ... 8
Figure 2.4 – Generical model of a material’s sorption isotherm ... 9
Figure 2.5 – Different shapes of sorption isotherms ... 10
Figure 2.6 - Adsorption phenomenon in their various phases and domains ... 10
Figure 2.7 – Ink bottle type pores ... 11
Figure 2.8 – Desorption process in a ink bottle type pore ... 11
Figure 2.9 – Hysteresis phenomenon ... 12
Figure 2.10 – Comparation between mean adsorption/desorption isotherm with hysteresis isotherm . 12 Figure 2.11 – Mathematical function proposed to moisture permeability ... 14
Figure 2.12 – Separation of moisture flux in vapor and liquid form ... 14
Figure 2.13 – Influence of temperature in viscosity and surface tension of water ... 15
Figure 2.14 – Penetration depth ... 16
Figure 2.15 – Thermal inertia ... 18
Figure 2.16 – Psychrometric diagram with an example of condensation phenomenon ... 20
Figure 2.17 – Example of Glaser method for interior condensations ... 21
Figure 2.18 – Conditions to development of dust mites ... 22
Figure 2.19 – Conditions to development of Aspergillus Versicolor ... 22
Figure 2.20 – Relative humidity conditons to the development of problems to human health ... 23
Figure 2.21 – Air exchange rate to avoid mold in a room with 200 m3 ... 25
Figure 2.22 – Evaporation and relative humidity in Lisbon ... 26
Figure 2.23 – Effective moisture penetration depth of wood ... 27
Figure 2.24 – Effective moisture penetration depth of cellulose panel ... 27
Figure 2.25 – Impact of temperatue and relative humidity on the perceived air quality PAQ ... 29
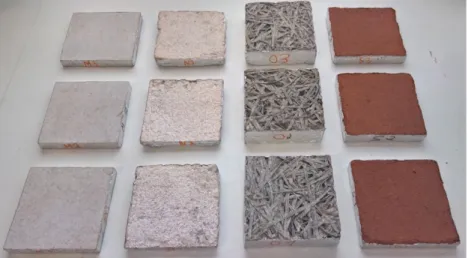
Figure 3.1 – Finished stucco’s samples (EA) ... 32
Figure 3.2 – Recycled cellulose board’s samples (M) ... 32
Figure 3.3 – Projected cellulose coating’s samples (N) ... 33
Figure 3.4 – Natural hydraulic lime mortar’s samples (NHL) ... 33
Figure 3.5 – Wood wool cement board’s composition ... 34
Figure 3.6 – Wood wool cement board’s samples (O) ... 34
Figure 3.7 – Clayish earth plaster’s samples (S) ... 35
Figure 3.8 – Climatic chamber ... 36
Figure 3.9 – Isothermal chambers ... 37
Figure 3.10 – Sketch of isothermal chambers ... 38
Figure 3.11 – Sensors used to control relative humidity and temperature ... 38
Figure 3.12 – KERN PLJ 1200-3A scale ... 39
Figure 3.13 – Adam AFP 720 L scale ... 39
Figure 3.14 – Anemometer ... 40
Figure 3.15 – Thermal conductivity equipment - ISOMET 2104 ... 41
Figure 3.16 – Isothermal chamber C2 ... 42
Figure 3.17 – Comparison between expected and real values of relative humidity inside isothermal chamber C2 ... 42
VIII
Figure 3.19 – Water bath used to melt the mix of beeswax and colophony resin ... 46
Figure 3.20 – Tapes used on moisture permeability experimental trial ... 47
Figure 3.21 – Glass ring covering ... 47
Figure 3.22 – Example of the system already covered ... 47
Figure 3.23 – All samples for moisture permeability’s experimental trials ... 48
Figure 3.24 – Example of a complete cup system ... 48
Figure 3.25 – Exemplification of whieghing system ... 49
Figure 3.26 – Cup’s system sketch with its dimensions ... 49
Figure 3.27 – Comparison between expected and real values of realtive humidity inside isothermal chamber C1 ... 50
Figure 3.28 – Saturated solution placed into trays ... 51
Figure 3.29 – Isothermal chamber C1 ... 52
Figure 3.30 – Thermal conductiviy measurment ... 53
Figure 3.31 – Example of RH variation for MBV ... 55
Figure 3.32 – Comparison between theoretical and practical cycles of RH and temperature of climatic chamber ... 56
Figure 3.33 – MBV classification ... 57
Figure 3.34 – Samples’ covering with aluminum tape ... 58
Figure 3.35 – Samples used on experimental trials of MBV, adsorption/desorption isotherm, thermal conductivity and response time ... 58
Figure 3.36 – All samples used on experiment of classroom ... 60
Figure 3.37 – Classroom ... 61
Figure 4.1 – Adsorption and desorption isotherm of recycled cellulose board (M) ... 67
Figure 4.2 - Adsorption and desorption isotherm of projected cellulose coating (N) ... 68
Figure 4.3 – Adsorption and desorption isotherms of wood wool cement board (O) ... 68
Figure 4.4 – Adsorption and desorption isotherms of clayish earth plaster (S) ... 68
Figure 4.5 – All materials’ adsorption/desorption isotherms ... 69
Figure 4.6 – Moisture permeability and moisture resistance factor of recycled cellulose board (M) ... 70
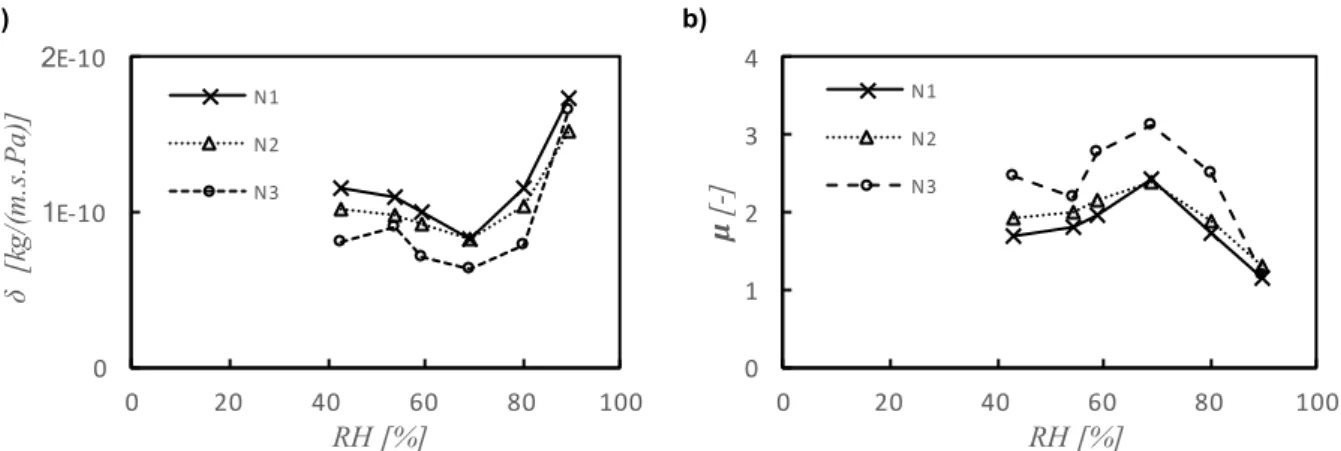
Figure 4.7 – Moisture permeability and moisture resistance factor of projected cellulose coating (N) . 71 Figure 4.8 – Moisture permeability and moisture resistance factor of clayish earth plaster (S) ... 71
Figure 4.9 – All materials’ moisture permeability ... 71
Figure 4.10 – Moisture resistance factor and equivalent air layer thickness of all materials ... 72
Figure 4.11 – Flux division of moisture permeability, for all materials ... 74
Figure 4.12 – Thermal conductivity of all materials ... 75
Figure 4.13 – Thermal conductivity of all materials ... 76
Figure 4.14 – MBV of all materials, at the range of 33%-75% of RH ... 77
Figure 4.15 – MBV of all materials ... 78
Figure 4.16 –MBV of all materials at all RH ranges ... 79
Figure 4.17 – Classification of MBV of all materials ... 82
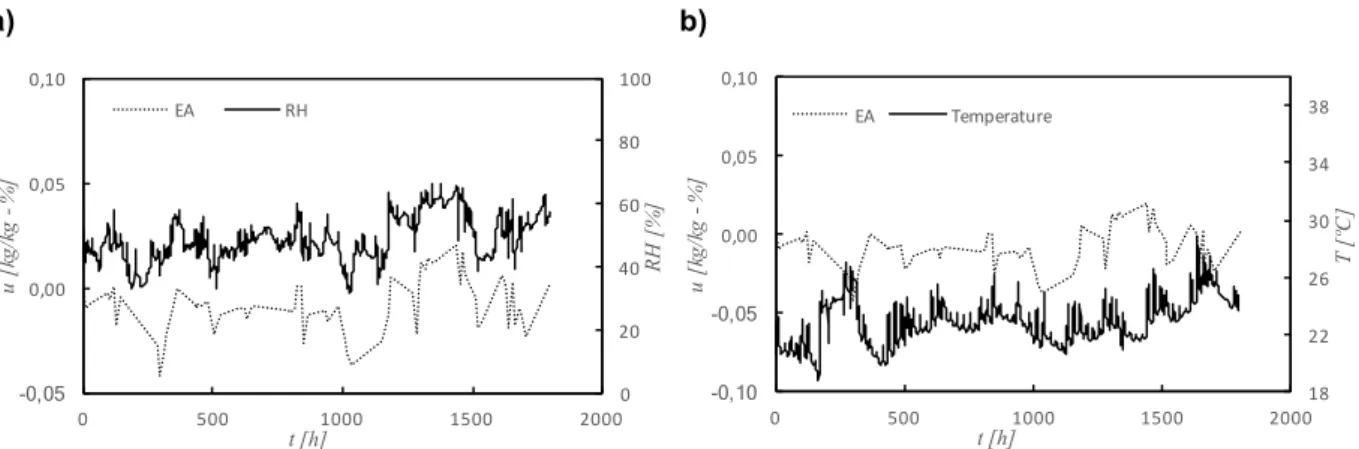
Figure 4.18 – Variations of moisture content of finished stucco (EA) and classroom’s relative humidity and temperature ... 83
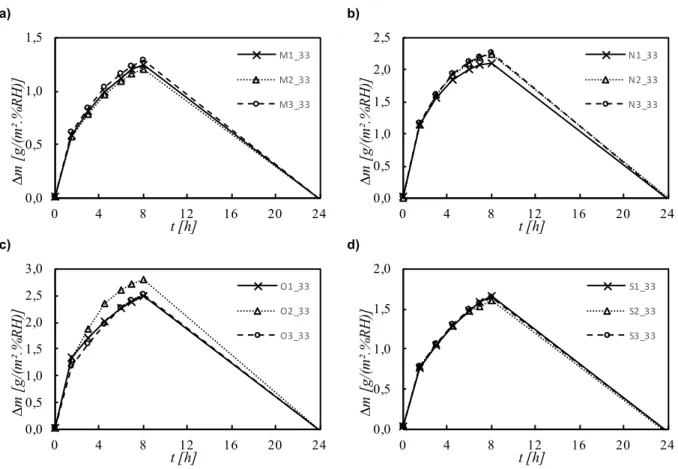
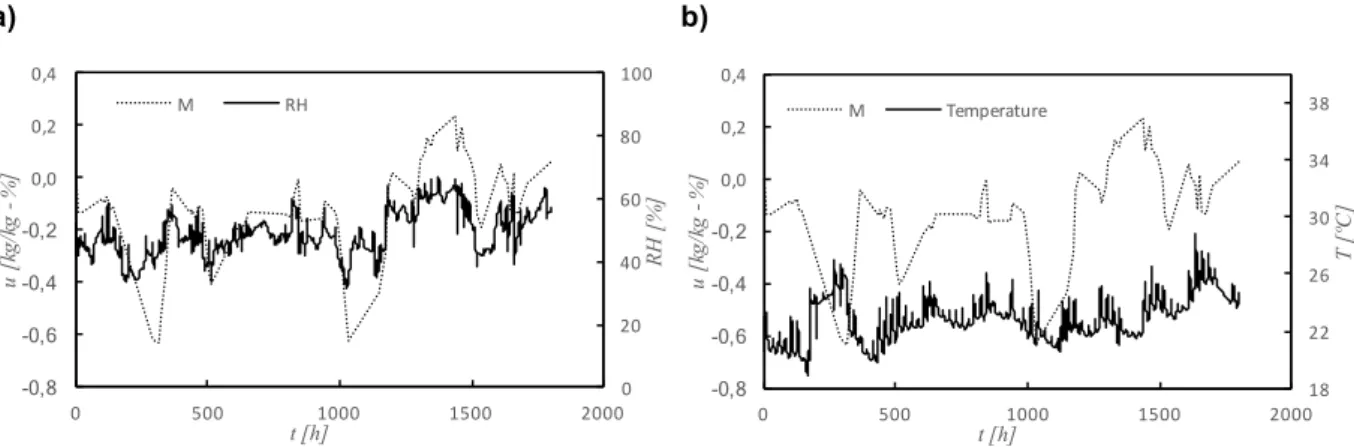
Figure 4.19 – Variations of moisture content of recycled cellulose board (M) and classroom’s relative humidity and temperature ... 84
Figure 4.20 – Variations of moisture content of projected cellulose coating (N) and classroom’s relative humidity and temperature ... 84
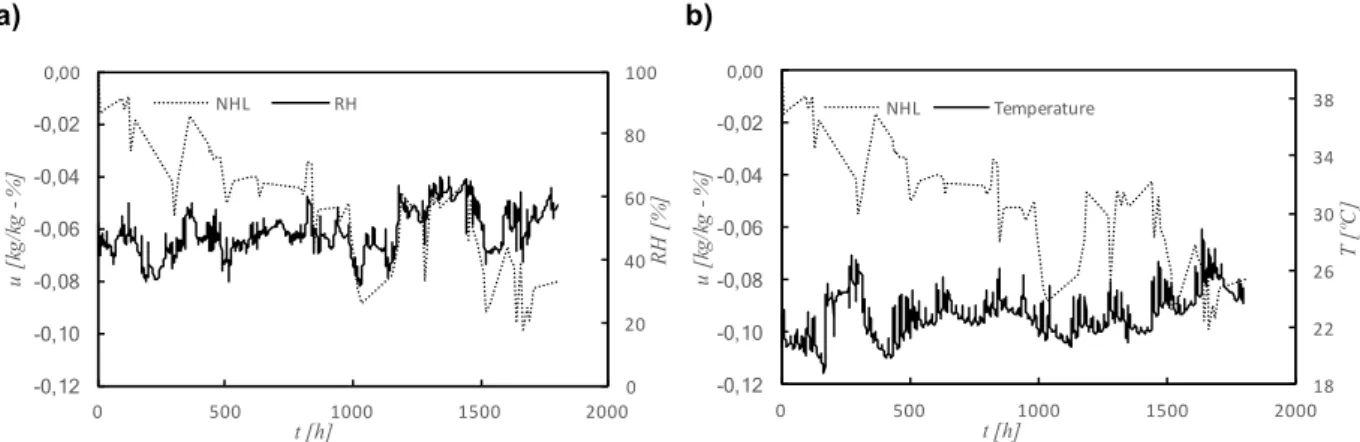
Figure 4.21 – Variations of moisture content of natural hydraulic lime mortar (NHL) and classroom’s relative humidity and temperature ... 85
Figure 4.22 – Variations of moisture content of clayish earth plaster (S) and classroom’s relative humidity and temperature ... 86
Figure 4.23 – Correlation between material moisture content and temperature of classroom, for all materials ... 86
IX
Figure 4.25 – Correlation between relative humidity and temperature of classroom ... 88
Figure 4.26 – Correlation between relative humidity and moisture content in air of classroom ... 89
Figure 4.27 – Response time of all materials ... 90
Figure 4.28 – Comparison between moisture content changes of all materials in first 9 hours of response time test ... 92
Figure 5.1 – All non-linear regressions of moisture content of recycled cellulose board (M) ... 98
Figure 5.2 – All non-linear regressions of moisture content of projected cellulose coating (N) ... 99
Figure 5.3 – All non-linear regressions of moisture content of wood wool cement board (O) ... 100
Figure 5.4 – All non-linear regressions of moisture content of clayish earth plaster (S) ... 101
Figure 5.5 – Specific moisture capacity of all materials ... 103
Figure 5.6 – Specific moisture capacity of all materials together ... 104
Figure 5.7 – All non-linear regressions of moisture permeability of recycled cellulose board (M) ... 106
Figure 5.8 – All non-linear regressions of moisture permeability of projected cellulose coating (N) ... 107
Figure 5.9 – All non-linear regressions of moisture permeability of clayish earth plaster (S) ... 108
Figure 5.10 – All non-linear regressions of thermal conductivity of recycled cellulose board (M) ... 110
Figure 5.11 – All non-linear regressions of thermal conductivity of projected cellulose coating (N) ... 110
Figure 5.12 – All non-linear regressions of thermal conductity of wood wool cement board (O) ... 111
Figure 5.13 – All non-linear regressions of thermal conductivity of clayish earth plaster (S) ... 111
Figure 5.14 – Variation of penetration depth with relative humidity, of all materials ... 114
Figure 5.15 – All equations of sorption kinetic applied to response time test, for recycled cellulose board (M) ... 118
Figure 5.16 – All equations of sorption kinetic applied to response time test, for projected cellulose coating (N) ... 118
Figure 5.17 – All equations of sorption kinetic applied to response time test, for wood wool cement board (O) ... 119
Figure 5.18 - All equations of sorption kinetic applied to response time test, for clayish earth plaster (S) ... 119
Figure 6.1 – Indoor and outdoor climate parameters considered by Wufi Plus ... 122
Figure 6.2 – Variation of MBV with moisture resistance factor, for wood wool cement board (O) ... 123
Figure 6.3 – Comparison between MBV obtained from tests and Wufi Plus, of all materials ... 124
Figure 6.4 – Temperature and relative humidity of exterior climate of Lisbon ... 125
Figure 6.5 – Building used to sensivity study ... 126
Figure 6.6 – Tree diagram of sensivity study ... 128
Figure 6.7 – Soprtion isotherms of sensivity study ... 129
Figure 6.8 – Variation of RHS with MBV and air exchange rate, at fixed values of thermal conductivity ... 131
Figure 6.9 – Variation of RHS with thermal conductivity and air exchange rate, at fixed values of MBV ... 132
Figure 6.10 – Variation of RHS with thermal conductivity and MBV, at fixed values of air exchange rate ... 133
Figure 6.11 – Variation of TS with MBV and air exchange rate, at fixed values of thermal conductivity ... 134
Figure 6.12 – Variation of TS with thermal conductivity and air exchange rate, at fixed values of MBV ... 135
Figure 6.13 – Variation of TS with thermal conductivity and MBV, at fixed values of air exchange rate ... 136
Figure 6.14 – Moisture resistance factor used on Wufi Plus, of all materials ... 139
Figure 6.15 – Adsorption isotherms used on Wufi Plus, of all materials ... 140
Figure 6.16 – Thermal conductivity depending of RH used on Wufi Plus, of all materials ... 141
XI
List of Tables
Table 2-1 – Adsorption forms ... 9
Table 2-2 – Effective moisture penetration depth of various materials ... 28
Table 3-1 – Moisture permeability samples’ dimensions ... 45
Table 3-2 – Salt saturated solutions ... 49
Table 3-3 – Combinations of relative humidity inside and outside cup to moisture permeability tests .. 50
Table 3-4 – Thermal conductivity probes’ selection ... 53
Table 3-5 – Thickness of samples ... 57
Table 3-6 – RH range used in MBV trials ... 58
Table 3-7 – Dimension of samples used in experiment of classroom ... 60
Table 3-8 – Time interval of successive weighing of response time test ... 62
Table 3-9 – Use of materials ... 63
Table 4-1 – Density and porosity ... 65
Table 4-2 – Moisture content of adsorption/desorption isotherm in u [kg/kg - %] ... 66
Table 4-3 – Moisture content of adsorption/desorption isotherm in w [kg/m3] ... 66
Table 4-4 – Moisture permeability values of all materials ... 69
Table 4-5 – Moisture resistance factor of all materials, at all ranges of relative humidity ... 70
Table 4-6 – Equivalent air layer thickness of all materials, at all ranges of relative humidity ... 72
Table 4-7 – Flux division of all materials ... 73
Table 4-8 – Thermal conductivity of all materials ... 75
Table 4-9 – MBV of all materials of all relative humidity ranges ... 78
Table 4-10 – MBV of all RH ranges for all materials ... 80
Table 4-11 – Comparison of MBV between different RH ranges ... 81
Table 4-12 – Adsorption/desorption velocity of all materials ... 90
Table 5-1 – Equations of moisture content ... 96
Table 5-2 – Coefficients of all adsorption/desorption equations, for all materials ... 96
Table 5-3 - Coefficient of determination (R2) of all adsorption/desorption equations, for all materials 101 Table 5-4 – Equations of moisture permeability ... 104
Table 5-5 – Coefficients of all equations of moisture permeability, for all materials ... 105
Table 5-6 – Coefficient of determination (R2) of all moisture permeability equations, for all materials108 Table 5-7 – Equations of thermal conductivity ... 109
Table 5-8 – Coefficients of all equations of thermal conductivity, for all materials ... 109
Table 5-9 – Coefficient of determination (R2) of all thermal conductivity equation, for all materials .... 112
Table 5-10 – Ideal MBV ... 113
Table 5-11 – Comparison between ideal and practical MBV of Ramos, N. ... 113
Table 5-12 – Penetration depth at 54% of relative humidity, for all materials ... 115
Table 5-13 – All equations of sorption kinetic equations ... 116
Table 5-14 – Coefficients of all equations of sorption kinetic for all materials ... 117
Table 6-1 – MBV obtained from experimental trials and Wufi Plus ... 124
Table 6-2 – Dimensions of all elements of the building used to sensivity study ... 126
Table 6-3 – Main characteristics of building’s opaque elements ... 126
Table 6-4 – Description of sensivity study’s graphs ... 130
Table 6-5 – Relative humidity and temperature results of all simulations of sensivity study ... 136
Table 6-6 – Daily hygroscopic inertia index and hygric capacity of sensivity study ... 138
Table 6-7 – Classes of hygroscopic inertia ... 138
XII
XIII
List of Acronyms, Materials and Symbols
Symbol Description Units
A Area m²
b Thermal effusivity J/(m².K.√s)
bm Moisture effusivity kg/(m².Pa.√s)
cρ Specific heat capacity J/(kg.K)
d thickness m
dH Active thickness of adsorption m
dp,1% Penetration depth m
Dw Moisture diffusivity m²/s
Eg Quantity of energy generated W
Ein Quantity of energy transferred to an element W
Eout Quantity of energy transferred from an element W
Est Stored energy W
G Flux of moisture kg/(m².s)
g Moisture flow rate kg/(m².s)
Ih,d Daily hygroscopic inertia index g/(m³.%RH)
MBV Moisture Buffering Value g/(m².%RH)
mdry Dry mass kg
mw Mass of water kg
Pᵥ Partial pressure of moisture in air Pa
Pν,máx Maximum pressure of moisture in air Pa
r Pore’s radius m³
XIV
R² Coefficient of determination -
RH, 𝝓 Relative humidity %
RHS Relative Humidity Stabilization -
Rse Exterior surface's thermal resistance (m².⁰C)/W
Rsi Interior surface's thermal resistance (m².⁰C)/W
RT Thermal resistance (m².⁰C)/W
Rᵥ Water vapor specific constant J/(kg.K)
sd Equivalent air layer thickness m
T Temperature ⁰C
t Time h
tp Time of relative humidity oscillations h
Ts Dew point temperature ⁰C
TS Temperature Stabilization -
u Moisture content kg/kg
U Heat transfer coefficient W/(m².⁰C)
uh Critical moisture content kg/kg
umáx Maximum moisture content kg/kg
V Volume m³
vv Air velocity m/s
w Moisture content kg/m³
W Moisture permeance kg/(m².Pa.s)
wcr Critical moisture content kg/m³
wsat Saturation moisture content kg/m³
Z Moisture resistance (m².s.Pa)/kg
δ Moisture permeability kg/(m.s.Pa)
δa Moisture permeability of air kg/(m.s.Pa)
θ Contact angle ⁰
XV
µ Moisture resistance factor -
µ Damping factor -
𝝂 Moisture content in air kg/m³
𝝂s Saturation limit kg/m³
ξ Specific moisture capacity kg/kg
ρ Density kg/m³
ρdry Dry density kg/m³
ρw Water's density kg/m³
σ Fluid's surface tension N/m
ϕ Delaying factor -
Acronyms Description
BS British Standard
DEC Departamento de Engenharia Civil EN European Standard
FCT Faculdade de Ciências e Tecnologia HAM Heat, Air and Moisture
ISO International Organization for Standardization JIS Japanese Industrial Standard
NP Norma Portuguesa PAQ Perceived Air Quality
PD Percentage of Dissatisfied People
XVI Materials Description
EA Finished stucco
M Recycled cellulose board N Projected cellulose coating NHL Natural hydraulic lime mortar
1
Chapter 1:
Introduction
1.1. Foreword
In the course of the time, buildings tend to be increasingly more waterproof (including the state of water vapor). This is a consequence of using more insulations and walls/floor/ceiling coatings that have almost zero porosity, which do not allow them to adsorb or release any moisture.
The capacity to adsorb moisture makes possible to control interior environment. This behavior of hygroscopic materials allows to control and damp some peaks of relative humidity, adsorbing moisture when RH of interior air is high and releasing moisture when there is lower RH on interior environment. It is important control the fluctuations of relative humidity and its highest values in order to avoid several problems of occupants and to the building itself. Moisture buffering capacity of coating materials makes possible to control the interior environment and, as consequence, to improve the quality of interior air. The improvement of the quality of air provides better comfort for all occupants and their own health. These coating materials with moisture buffering capacity also extend the materials durability, since they are no longer exposed to extremely high or low relative humidity, which deteriorate them over time.
2
1.2. Objectives and scope
The present dissertation belongs to Master in Civil Engineer – Construction Profile of Faculdade de Ciências e Tecnologia – Nova University of Lisbon. The present work looks to characterize the influence of hygroscopicity of coating materials in interior relative humidity (RH) and temperature (T). First of all, it has to be made a literature review to understand which developments already exist in the area, what set a starting point to be possible to achieve new knowledge.
To better understand the potential of materials to control relative humidity of buildings indoor, it is necessary to know the hygroscopic properties of coating materials. For that, were chosen to make four experimental trials, which perfectly allows to know the hygroscopic behavior of materials. Those tests are Adsorption/Desorption Isotherm, Experiment of classroom, Moisture Permeability and Moisture Buffering Value (MBV).
The choice of materials with good moisture buffering capacity depends how faster they have to respond to fluctuations of relative humidity. In other words, it is important to define the velocity of response that materials have to have to damp and control the RH and temperature inside. Materials with fast adsorption/desorption are good for short cycles of relative humidity changes, as well as materials with slow response are good to long cycles of RH variation. Therefore, was chosen to make a Response Time experimental trial.
To clearly understand the thermal potential of coating materials to control the inside temperature of a building, it was chosen to make a Thermal Conductivity test. However, this test is not the conventional one, since it is made by varying the relative humidity and, as so, the moisture content of samples. Since experimental trials only allow to know the hygrothermal behavior of a few levels of relative humidity or materials moisture content, it is necessary to know their behavior at any RH or moisture content. Therefore, it is indispensable to propose equations that fit as better as possible to the values of experimental tests and making possible to know the hygrothermal behavior of studied materials at any range of relative humidity or moisture content.
Finally, it is necessary to know how coating materials respond to indoor climate, in transient regime. For that, it was chosen to use Wufi Plus software, which is a software that makes hygrothermal
3
1.3. Dissertation outline
For better understanding the methodology of the present work and their results, following will be explained in what consists each chapter.
The main divisions are made in seven chapters:
o Chapter 1 is made of a presentation of dissertation, giving a general idea of the
studied subjects, as well as its objective and scope;
o Chapter 2 includes a literature review of the previous works, and also includes the
essential concepts and physical equations of Heat, Air and Moisture (HAM) behavior of buildings;
o Chapter 3 is a chapter that describes the used materials, as well as all chosen
experimental trials;
o Chapter 4 presents the analysis of results of tests made in chapter 3;
o Chapter 5 includes the numerical analysis made for all hygrothermal properties of
materials, comparing equations proposed by other works with equations achieved in the present work;
o Chapter 6 contains hygrothermal simulations of a sensivity study with and without
some studied materials in the present dissertation, made with software Wufi Plus,
describing the building’s dimensions adopted and the obtained results. In this chapter there also made a verification of MBV obtained experimentally;
o Chapter 7 is the last one, which includes both the main conclusions and proposals to
futures works.
5
Chapter 2:
Hygrothermal performance of buildings
2.1. Moist air
Water has three different forms in which it can be present in anywhere. Those forms are the liquid one, more known as “water”, vapor form, known as “water vapor” and the solid form, called “ice”. Solid form of water is the one which has the biggest dimensions and vapor form is the one which has the smallest, since each molecule has a diameter of 0.28 nm, approximately. So, this is the reason to why some materials are waterproof, but they are not tight to water vapor. When there is solidification (transition from liquid to solid state), its volume increases, approximately, nine to ten per cent.
Air is composed by water vapor and various other gases, where the main component is Azote (N), followed by Oxygen (O2) and a small quantity of other gases like Carbon Dioxide (CO2), Sulfur Dioxide
(SO2), among others, as it can be seen in Figure 2.1.
Figure 2.1 – Air constitution
If dry air is assumed as an ideal gas, its partial pressure Pv [Pa] can be represented by the following
equation [1]:
𝑃
%= 𝑅
%∗ 𝑇 + 273,15 ∗ 𝜈
(2-1)where Rv is the water vapor specific constant [J/(kg.K)] (which takes a constant value of 461,4
J/(kg.K)), T is the air temperature [ºC] and n is moisture content of the air [kg/m3]. 78%
21% 1%
6
Partial pressure of moisture in air represents the pressure that moisture would have if it fulfils all the volume occupied by the mass of air that is being analyzed. As it is easy to understand by Equation(2-1), partial pressure of moisture is proportional to temperature and moisture content in air. The maximum pressure water vapor in air Pv,sat [Pa] is achieved when the air becomes saturated and it
is exponentially proportional to temperature, as described in Equation(2-2) and Equation(2-3).
𝑃
%,234= 610,5 ∗ 𝑒
89,:;<∗=
:>9,>?=
𝑖𝑓 𝑇 > 0 °𝐶
(2-2)𝑃
%,234= 610,5 ∗ 𝑒
:8,E9F∗=
:;F,F?=
𝑖𝑓 𝑇 ≤ 0 °𝐶
(2-3)Both water vapor pressure (partial and saturated) can be related by Equation(2-4), originating Relative Humidity (RH) [%]. When RH is equal to one-hundred per cent it means that the air is saturated and, beyond that point, condensation will start.
𝑅𝐻 =
𝑃
%𝑃
%,234∗ 100 =
𝜈
𝜈
2∗ 100
(2-4)As it possible to see in Equation(2-4), RH can be expressed in terms of moisture content in air n and
saturation limit ns [kg/m3], which represents the maximum moisture concentration allowed in the air, at
a certain temperature. The ns is calculated by Equation(2-5) and Equation(2-6) [2]:
𝜈
2= 0,6257 ∗
1,098 +
100
𝑇
E,K:
𝑇 + 273,15
𝑖𝑓 0°𝐶 ≤ 𝑇 ≤ 30℃
(2-5)
𝜈
2= 0,01016 ∗
1,486 +
100
𝑇
8:,>
𝑇 + 273,15
𝑖𝑓 − 20℃ ≤ 𝑇 < 0℃
(2-6)
The use of a psychrometric diagram is an easy way to correlate partial pressure of water vapor, moisture content in air, temperature and relative humidity (Figure 2.2). This diagram allows to understand the effect of temperature and water vapor concentration (or partial pressure) in RH. The psychrometric diagram allows to see that relative humidity takes lower values with the increasing of temperature, because this increment origin also an increment of saturation limit (as it is easy to understand by Equation(2-5) and Equation(2-6)).
To represent the phenomenon of condensation in terms of temperatures, it was created the concept of dew-point temperature Ts [ºC]. This temperature represents the temperature that, from there beyond,
starts condensation, as described by Equation(2-7).
𝑇
2=
237,3 ∗ (ln 𝜙 +
17,269 ∗ 𝑇
237,3 + 𝑇
)
17,269 − (ln 𝜙 +
17,269 ∗ 𝑇
237,3 + 𝑇
)
7
Figure 2.2 – Example of psychrometric diagram
2.2. Hygroscopicity
2.2.1. Moisture transfer
Any material applied in buildings has a certain quantity of moisture, that varies with the moisture content and relative humidity of environment.
Moisture content u [kg/kg] of a material is the quantity of water (in any state) mw [kg] related with the
material’s dry mass mdry [kg] by the following equation [3]:
𝑢 =
𝑚
W− 𝑚
XYZ𝑚
XYZ (2-8)Moisture content may also be represented as the quantity of water inside a cubic meter of the respective material. This moisture content w [kg/m3] can be achieved by the following two equations:
𝑤 = 𝜌
XYZ∗ 𝑢
(2-9)where ρdry is the dry density of material, in kg/m3.
0 200 400 600 800 1000 1200 1400 1600 1800 2000 2200 2400 2600 0 2 4 6 8 10 12 14 16 18 20
-10 -5 0 5 10 15 20 25 30
Pa rt ia l p re ss u re P v [P a ] Mo is tu re c o n te n t in a ir ! *1 0 ¯³ [ k g /m ³]
8
𝑤 =
𝑚
W− 𝑚
XYZ𝑉
(2-10)where V is the volume of the sample which is being tested, in m3.
The moisture content of any material can vary between zero and a maximum value, which is particular to each material. The zero value of moisture is, however, impossible to achieve at real cases, being only reached at laboratory domain. Between the zero and maximum moisture content values, there is yet two important values of moisture content, which are the critical moisture content wcr [kg/m3] and
the saturation moisture content wsat [kg/m3]. The saturation moisture content is the value on which the
material is considered full of moisture. However, even when this saturation value is reached at approximately 98% of relative humidity inside the material, there is still some air bubbles which avoid that the material be all filled with water. Therefore, it is considered that it is impossible to achieve values of relative humidity above 98%. Values between 98% and 100% can only be reached with a vacuum process, before material initiate the moisture adsorption process. The critical moisture content is the value that separates the vapor diffusion and the liquid transfer of moisture, that is, it is the value until there is only vapor transfer of moisture and none on liquid form. Therefore, this value beyond, starts interstitial condensation, which is related with pores’ radius [1] [4] [5].
The adsorption of moisture is related with pores’ radius by Kelvin Law (Equation(2-11)), where it is easy to understand that relative humidity inside pores increases exponentially with the decreasing of pores’ radius.
𝑅𝐻 = 𝑒
(^:∗_∗`ab c
Y∗de∗f∗=) (2-11)
where σ is the surface tension of the fluid [N/m], θ is the contact angle [º], r is the radius of pores [m], ρw is water density [kg/m3], R is the gases constant [J/(kg.K)] and T is temperature [ºC].
Considering a base case with 20 ºC (which implies a certain value of fluid’s surface tension), density of water equals to one thousand kg/m3 and a contact angle of water of 0 º, therefore, the relation between the pores’ radius and the relative humidity inside them is explained by Figure 2.3. This figure has a line that shows at which relative humidity occurs interstitial condensation.
Figure 2.3 – Relation between pores’ radius and relative humidity in which occurs interstitial condensation (Kelvin Law)
By Figure 2.3, it is easy to understand that as smaller is the pores’ radius, as faster occurs condensation in those pores (at lower relative humidity). In other words, as smaller is the radius of pores, higher are the suction forces exerted by pores and, therefore, faster those material will be saturated.
The adsorption of moisture is divided in different forms, dependent of material’s RH. These different forms are shown in Table 2-1
0 20 40 60 80 100
0,0E+00 1,0E-07 2,0E-07
RH
[
%
]
9
Table 2-1 – Adsorption forms
RH [%] Adsorption form
0-20 Monomolecular adsorption
20-40 Multi-molecular adsorption
40-98 Condensation
Table 2-1, that is represented by Figure 2.4 [6], shows that condensation begins in pores with the lowest dimensions at 40% of RH [1], but there is no concordance with other authors, who said that the beginning of condensation may be around 50% [7] or even 60% [8] [9] [9] of RH. At low RH (0-20%) the adsorption is made in a single layer of moisture and until begins interstitial condensation, the adsorption is made in multiples layers of moisture. When multi-molecular adsorption happens, the curve is more horizontal than in monomolecular phase in consequence of material starts to be full of water vapor, and then its water vapor permeability decreases. However, when the condensation starts (yet at hygroscopic domain), then the liquid flux begins and consequently the moisture permeability increases. At about 98% of relative humidity begins the capillary domain, when it is considered that the mass transfer only occurs at liquid form and, as so, sorption isotherm becomes almost vertical.
Figure 2.4 – Generical model of a material’s sorption isotherm [6]
Where Figure 2.4 has “uh”, is the same value of wcr, explained before. The figure above (Figure 2.4)
10
Figure 2.5 – Different shapes of sorption isotherms [6]
The most common porous materials’ sorption isotherm follows an “S” shape, represented by the type II curve [6] (Figure 2.5). Lagmuir and BET models are the most known models, however in consequence of some of their limitations, were created new models based on these, that better characterize the adsorption behavior of moisture by porous materials, like models of Lykow or Hansen [5].
Figure 2.4 divided the adsorption process in various phases and domains, which can also be represented by Figure 2.6.
Figure 2.6 - Adsorption phenomenon in their various phases and domains [11]
11
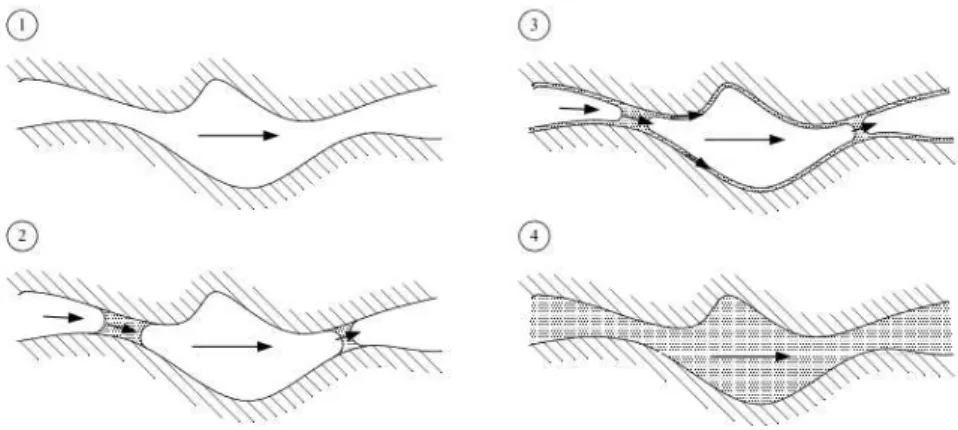
Figure 2.7 – Ink bottle type pores [13]
Ink bottle pores diminish a lot the phenomenon of moisture desorption and originate hysteresis. This happens because the first pore to reach condensation and, as so, a meniscus is the one with D1 diameter of Figure 2.7, and then the same will occur in pore with D2 diameter. However, the interior of ink bottle pores will difficultly be full of moisture, unless the pressure exerted in one of the pore connection is higher than the suction pressure of that pore connection. Those ink bottle pores decrease the desorption process since, if D1 and D2 have different values, some mass transfer will happen between pore with larger radius (D2) to the pore with smaller radius (D1) (Figure 2.8) and, even if there is low pressure to empty larger pores, this pressure may not be low enough to empty the ink bottle pores [14].
Figure 2.8 – Desorption process in a ink bottle type pore [13]
12
Figure 2.9 – Hysteresis phenomenon [6]
Figure 2.10 – Comparation between mean adsorption/desorption isotherm with hysteresis isotherm [15]
2.2.2. Moisture Permeability
13
𝑔 = −𝛿 ∗
𝑑𝑃
𝑑𝑥
(2-12)Permeability of any material to moisture is directly related with its porosity and pores’ radius, since as higher is the porosity, then higher will be its moisture permeability. At the same time, in pores with smaller radius the vapor flux will be reduced, however their interstitial condensation begins at lower relative humidity, then they will have more liquid flux, increasing the global moisture permeability. The absence of an international standard usually originated very distinguish values of moisture permeability of materials, never producing results within ± 5% of accuracy [16], even if the
environment condition would be similar, although the procedure would not be the same, like the air velocity, test’s duration, scale’s precision, beyond many other conditions. Because of that, latter in time, it was developed an ISO standard [17], which produce more reliable results of moisture permeability.
The moisture permeability values had a lot of uncertainty since the permeability was considered to vary in linear way with relative humidity (RH), which is not true. Therefore, there is a necessity to understand the real behavior of moisture permeability, with RH variation, looking for the most realistic values of moisture permeability [18]. There are two different zones of RH, in which moisture permeability vary in diverse forms [18] [19]:
• Low relative humidity “dry” zone: small variations of moisture permeability in function of RH;
• High relative humidity “wet” zone: significant increase of moisture permeability with the rise of RH.
To better understand the changes of moisture permeability in function of relative humidity, it was proposed a mathematical function (Equation(2-13)) [19], that showed a good fit to the majority of materials, which originated the graph represented by Figure 2.11.
𝛿 = 𝐴 ∗ 𝑒
m∗n+ 𝐶
(2-13)where A, B and C are constants and Φ is relative humidity [%].
To continue previous works, four different equations (of various authors) were studied to understand which one has the best fit [20]. Equation(2-13) revealed to be a very good regression of the experimental trials made in [20], however, the best regression to all studied materials was Equation(2-14) [14] [15].
𝛿 = 𝐴 + 𝐵 ∗ 𝜙
p (2-14)The moisture permeability can be related with other parameters, such as moisture resistance factor µ [-] and equivalent air layer thickness sd [m], which is the fictitious thickness of air which has the same
moisture permeability of the analyzed material, that are more common in numerical and computational simulations. Moisture resistance factor is calculated by Equation(2-15) and equivalent air layer thickness is achieved by Equation(2-16).
𝜇 =
𝛿
3𝛿
(2-15)14
where d [m] is the thickness of sample and δa is moisture permeability of air.
To better understand how it is possible to divide the moisture flux in their vapor and liquid forms, it was proposed a separation of total flux in vapor and liquid [22], which, after some mathematical equations and demonstrations, originated the flux division of Figure 2.12.
Figure 2.11 – Mathematical function proposed to moisture permeability [19]
Figure 2.12 – Separation of moisture flux in vapor and liquid form [22]
As it is possible to see in Figure 2.12, the liquid flow of moisture starts for 60% of RH that is the level where the interstitial condensation begins. The liquid flux increases exponentially from 60% of RH beyond, since more pores start to have condensation of water vapor [22] [23]. Figure 2.12 shows that vapor flow slightly decreases with the increasing of relative humidity, since there is less space to moisture, in vapor form, located in pore surfaces. However, it is a good approximation if vapor flow is considered constant at all relative humidity levels, according to Galbraith, G. et al. [24]. From various
works [22] [23] [25], it was possible to correlate the vapor flow with pressure gradient, in which the vapor flux decreases with the increment of gradient of pressure. However the same does not verify with liquid flux, because it is independent of gradient of pressure [22] [23] [25].
15
Figure 2.13 – Influence of temperature in viscosity and surface tension of water [26]
The international standard ISO 12572 [17] is the one used to determine the water vapor transmission properties. This standard contemplates the correction of water vapor permeance W [kg/(m2.Pa.s)] to high permeable materials, which has an equivalent thickness air layer below 0,2 m. This correction is made considering the air between the sample and the salt solution under it (cup test). However, the air above the sample is not considering in the present standard, which can change significantly the results from moisture permeability experimental trial. Therefore, the moisture permeance can also be rectified, considering the air above the sample, which may produce better results [27] [28] [29]. It is important to retain that the values of moisture permeance of a single material may not correspond with its values when applied. In other words, if there is a compound building solution, it should have any type of joints, that there are more permeable to moisture. As so, the moisture diffusion resistance of the global solution is notably lower than the pure material’s one, even applied at the same thickness [30]. This fact may improve the building’s solution evaporation, but it increases the infiltration of moisture from outside.
Experimental trials made by ISO standard [17] are more reliable when they are made to current materials of construction (plasters, gypsum board, plywood, beyond other materials). Although, Svennberg, K. and Wadso, L. developed a new test, made for highly permeable and lightweight materials [31], which is an test that avoids the problem of the interior surface resistance, as well as it is a really quick method.
ISO 12572 [17] may not be the perfect standard to very moisture tight materials [32], which make that there are a need of further developments to these type of materials.
2.2.3. Moisture Buffering Value (MBV)
Most of methods used to determine the material behavior to moisture adsorption and desorption are usually made at steady-state. Therefore, outcome the necessity of characterize the dynamic behavior of coating materials, determining its capacity to buffer relative humidity of a certain enclosure.
16
Padfield, T. [34] developed a chamber which is capable of measure the buffering capacity of materials, by exposing them to high and low relative humidity cycles. At constant temperature, the cycles of relative humidity are around 10% and 90%, achieved by condensation of water (simulating the air renovation of an enclosure) and evaporation of water (simulating the internal gains of moisture by people, lights, equipment, etc.), respectively. In this work, the concept of penetration depth was used. A big limitation of the proposal method is that until the trial may begin, the equilibrium must be reached, what can take a year or two to achieve it.
Further work improved the concept of penetration depth of moisture, where it is defined as the value where the amplitude of relative humidity in a certain profundity of the element is equal or lower to 1% [35]. The present concept is easier to understand by Figure 2.14, where the dot line represents RH variations. As better is the material’s buffering capacity, higher will be its penetration depth, what makes this concept a good parameter to highlight the materials with best moisture buffering capacity.
Figure 2.14 – Penetration depth [35]
In 2001, it was made one of the first tests in a room [36], where the materials were situated into the interior elements and then, their moisture buffering capacity was quantified. These results boosted the works made by NORDTEST, which started to make a first workshop in 2003 composed by thirty Nordic and international academics in order to define the best measurements to adopt in the quantification of moisture buffering capacity of materials and constructive systems [37]. In this workshop, the experts were divided in five different working groups, each one working in different scope. The results obtained in [37] originated a final report in which there were made round robin tests, with the main objective of assess the quality of the proposed test method to quantify the moisture buffering capacity of materials and systems [38]. To measure moisture buffering capacity or potential of materials and systems, this NORDTEST report defined four concepts capable to define material’s capacity of buffering moisture. These concepts are moisture effusivity, penetration depth, Ideal Moisture Buffering Value (MBV) and Practical MBV. After conclusion of round robin tests, it was defined the ideal experimental trial, which allows anyone to replicate the present test.
Moisture Buffering Value is a value that describes the capability of materials to control peaks of indoor relative humidity. That it, as higher is MBV, better is the ability of materials to adsorb moisture of environment when it is high, and release moisture when there is low relative humidity indoor. As so, the concept of MBV is good indicative of materials potential to buffering humidity and control its peaks, when those are applied in construction with the same thickness [39].
17
An inverse approach was made by Dubois, S. and Lebeau, F., with the main intuit of validate MBV experimental trial of NORDTEST [38], by comparing the adsorption an desorption values with a HAM model [42]. The model was capable to predict the dynamic moisture adsorption, with recourse to a DREAM algorithm. Both results (experimental and predicted) were very similar, what makes that both validate each other.
2.3. Hygrothermal behavior of buildings
Interior environment of buildings is function of weather, of materials which make part of construction system and coating materials, interior furniture, books, carpets, beyond others.
It is important to understand how materials can influence the indoor climate, and how they can control indoor RH and temperature, and the consequences that are inherent to these two main concepts.
2.3.1. Thermal and hygric inertia
Thermal inertia
Thermal inertia is defined by the resistance of a certain material, construction system or building to change its temperature. The thermal inertia is mainly function of conduction flux of heat than the other two fluxes of heat (convective and radiation), since it is the heat flux form that goes through the thickness of the respective body.
Thermal inertia allows to have smaller heating and cooling equipment, since it provides to building lower fluctuations of indoor temperature [43]. Thermal inertia affects strongly the necessity of heating buildings situated in cold climates, because it delays the heat flux of warm stations and increases the temperature of indoor, even the climate of outdoor is cold [44]. The thermal inertia of an element is directly proportional to its stored energy Est [W], which is related with the energy to and from the
element, Ein [W] and Eout [W] respectively, and with the generated energy inside the element Eg [W], by
the following equation:
𝐸
tu+ 𝐸
v− 𝐸
wx4= 𝐸
24 (2-17)Which eventually becomes the General Heat Conduction Equation:
𝜕
𝜕𝑥
𝜆
𝜕𝑇
𝜕𝑥
+
𝜕
𝜕𝑦
𝜆
𝜕𝑇
𝜕𝑦
+
𝜕
𝜕𝑧
𝜆
𝜕𝑇
𝜕𝑧
+ 𝑞
~
= 𝜌𝑐
d𝜕𝑇
𝜕𝑥
(2-18)where λ is thermal conductivity [W/(m.ºC)], q’ is the generated energy, ρ density [kg/m3], cρ is specific
heat capacity [J/(kg.K)] and T is temperature [ºC].
Equation(2-18) can be simplified, considering that there is no internal energy being generated and that the heat flux only occurs in one direction, and therefore it is obtained the following equation:
𝜕
𝜕𝑥
𝜆
𝜕𝑇
𝜕𝑥
+ 𝑞
~
= 𝜌𝑐
d𝜕𝑇
18
Equation(2-19) allows to understand that the stored energy by an element is directly proportional to its thermal conductivity, density and specific heat capacity. Therefore, the thermal inertia of a building also increases with all these three factors, since it is directly related with the amount of energy that can be stored by its building materials or materials inside it.
Thermal inertia of a building is known by its capacity to damp the amplitude of interior temperature µ,
between the maximum and minimum, and to delay the flux of heat j, making that there is a gap
between outside and inside temperatures (Figure 2.15). This gap between both temperature is as bigger as is the thermal inertia of building.
Figure 2.15 – Thermal inertia [45]
Thermal inertia is directly proportional to specific heat capacity cρ, density ρ and thermal conductivity
λ, once both damp and delay factors are also directly proportional to these three quantities (Equation(2-20) and Equation(2-21)). In consequence of that, it is easy to understand that thermal inertia of a building is as higher as it is its global mass.
𝜇 = 𝑒
^8 €∗
•
4∗(€∗d∗‚ƒ) (2-20)
where t is temperature wave time [hours].
𝜑 =
𝑑
2 ∗ 𝜆
∗
𝑡
𝜋
∗ (𝜆 ∗ 𝜌 ∗ 𝑐
d)
(2-21)where d is the thickness of the element [m] and the product of thermal conductivity, density and specific heat capacity originate the concept of admissibility α.
Therefore, it is possible to understand that as higher is the thermal inertia of a building, bigger is the resistance that it offers to change inside’s temperature and, as so, there is higher control of interior temperature by building’s elements.
19
Hygric inertia
With a similar definition of thermal inertia, the hygric inertia is known by the capability of constructive systems, coating materials and all indoor materials in interior of buildings to damp the indoor cycles of relative humidity.
Hygric inertia is function of moisture transfer properties of constructive systems of envelope, since it those constructive systems are much permeable to moisture, then they may not store the desired moisture inside them. The hygric inertia is also function of the materials applied indoor that are capable to adsorb and release moisture.
If the constructive systems of envelope are very tight to moisture, they do not allow the moisture of exterior reaches the interior environment, but they do not also allow that the moisture adsorbed by interior coating transfers to outside. Due to this fact, if moisture cannot be transferred to outside, the good hygroscopic behavior of coating materials is lost in a short period time, since those coating materials remain full of moisture and then they are not capable to adsorb more moisture and control the indoor RH. For that, it is important to establish an optimum point between the moisture tight of constructive systems be good to offer resistance to moisture of outside reaches the interior and also be good to allow that the moisture of indoor coating materials can be transferred to outside.
Itis important to understand how the hygric inertia can damage the thermal inertia of a certain room or building, once the thermal conductivity is much more prejudiced by the increment of moisture than with the increment of temperature [46] [47]. Thermal conductivity varies in linear way with moisture and temperature, in a range between 10 and 40ºC [47] [48], and hygric inertia can affect the thermal comfort of spaces, by dropping the temperature of indoor in 1,5 ºC [49].
The effect of moisture content on thermal conductivity is more relevant in humid climates, but it cannot be despised in drier climates [50]. Also the air exchange rate affects the hygric inertia of a building, since the increment of indoor ventilation originate lower values of hygric inertia [51]
The capability of coating materials to adsorb moisture is function of their porosity and pores’ radius, but the capability of these coating materials to contribute to hygric inertia depends of their active thickness of adsorption dH [m] (Equation(2-22)), which is function of moisture permeability δ, specific
moisture content 𝝃, temperature T and saturation pressure of inside surface psat,si [44].
𝑑
ˆ=
𝛿 ∗ 𝑝
234,2t∗ 𝑇
𝜋 ∗ 𝜉
(2-22)The hygric inertia of some element can be determined by the concept of daily hygroscopic inertia index Ih,d [g/(m3.%RH)] (Equation(2-23)) [29], which is function of MBV of building’s materials, and their
area, as well as of MBV of objects placed inside which can contribute to buffer relative humidity of indoor, like books, furniture, carpets, etc..
𝐼
Œ,X=
𝑀𝐵𝑉
t∗ 𝑆
t+
‘•𝑀𝐵𝑉
w••,• ut
𝑁 ∗ 𝑉 ∗ 𝑇𝐺
(2-23)where S is the surface of material [-], N is the air exchange rate [h-1], V is the volume of room [m3] and TG is the vapor production period [h].
This evaluation of hygric inertia by the concept of Ih,d is an appropriate form to characterize the hygric
inertia of a room and it originates reliable results [52].
20
𝐻𝑦𝑔𝑟𝑖𝑐
‚3•.=
𝑀𝐵𝑉
t∗ 𝑆
t𝑉
(2-24)2.3.2. Condensations
The phenomenon of condensation is characterized by the change of water phase, from vapor state to liquid one.
Condensations may occur at surface, named as superficial condensation, or at the interior of a certain element, named as interior condensation.
Any condensation, superficial or interior, occurs always when the partial pressure of water vapor reaches the saturation pressure of water vapor, which is dependent of temperature. As so, as it is possible to see by Equation(2-4), both pressure can be related with each other, what makes that the condensation starts when relative humidity is equal to 100%.
As it is possible to see in Figure 2.16, relative humidity increases significantly with the reduction of temperature, what shows that for the same partial pressure of water vapor, the saturation pressure increases significantly, which diminishes relative humidity.
With regard to superficial condensations, they are easy to predict, by using a psychrometric diagram or the concept of dew-point temperature. That is, if the inside environment is at a certain temperature (for example, 20ºC), which originates a certain saturation pressure of water vapor, so the air is at around 80% of relative humidity (“A” point of Figure 2.16). If temperature of outside air is significantly lower than 20ºC, and the thermal behavior of construction system is bad enough to originate that its interior surface achieves about 17ºC (“B” point of Figure 2.16), so RH will reach 100% values and, therefore, it will occur superficial condensations.
Figure 2.16 – Psychrometric diagram with an example of condensation phenomenon
For condensations that may occur inside any element (denominated of internal condensations), the most usual approach to aim with it is use Glaser method, which relates the partial and saturation
0 200 400 600 800 1000 1200 1400 1600 1800 2000 2200 2400 2600 0 2 4 6 8 10 12 14 16 18 20
-10 -5 0 5 10 15 20 25 30
Pa rt ia l p re ss u re P v [P a ] Mo is tu re c o n te n t in a ir ! *1 0 ¯³ [ k g /m ³]
Temperature [ºC]
21
pressures of water vapor over the thickness of the element. Knowing the interior and exterior temperatures of surfaces, and also the heat transfer coefficient of the element U [W/(m2.ºC)], it is possible to know the temperatures inside it. From the values of temperature, it is possible to calculate the saturation pressure of water vapor and, considering the equilibrium moisture content of the material in analysis, it is also possible to calculate the partial pressure of water vapor. Therefore, as it is visible in Figure 2.17, every time the partial pressure line stays above the saturation one, then will occur condensations.
The Glaser method is an easy handle method to determine interior condensations of an element, however, it has some limitations that does not allow it to consider some important phenomenon:
• Construction system has to have parallel surfaces between each of their elements;
• Moisture content has a fix value which does not allow to consider the hygric behavior of
materials;
• Moisture permeability has constant values; • Does not consider the effects of thermal inertia; • Makes the analysis in stationary regime.
Figure 2.17 – Example of Glaser method for interior condensations (Adapted from [1])
It is important to retain that, as there are more condensation in an element, its thermal conductivity increases, such as the temperature, which brings down the saturation pressure of water vapor and makes that may occur more interior condensations. This phenomenon continuous to develop more and more, until all element has condensation. This process may stop if there would be an increasing of exterior temperature and, as so, begins the evaporation of moisture inside the element.
2.3.3. Consequences of condensations and extreme values of relative
humidity
22
The problems related with relative humidity are not only about high values of RH, but it is also connected with low values of RH. The comfort zone of relative humidity to humans should be between 30% and 60 % of relative humidity [54]. However, other authors suggest that, for human health, the best interval of RH should be around 10% and 50 %[55]. Extremely low values of relative humidity may cause dryness of eyes or skin, as well as dehydration or fatigue [54].
Extremely high values of RH may originate, not only ideal conditions to development of fungi, mold or bacteria, but also the deterioration of materials [56]. From 45-50% of RH beyond, dust mites can develop and, at 60% of RH, starts the development of mold and fungus [54]. With regard to temperature, it has always the perfect values to micro-organisms development, since they grow in a range of 10-35 ºC [55]. Dust mites can originate health problems to humans, and it has a direct relation with RH and temperature (Figure 2.18) [44].
Figure 2.18 – Conditions to development of dust mites [44]
A scientific review composed by 14 different studies discovered that the main family of fungi present in air is Aspergillus Versicolor, which does not have a proportional growth with temperature and relative
humidity (Figure 2.19) [44].
Figure 2.19 – Conditions to development of Aspergillus Versicolor [44]
![Figure 2.20 – Relative humidity conditons to the development of problems to human health [57]](https://thumb-eu.123doks.com/thumbv2/123dok_br/16588437.738863/45.892.200.695.105.430/figure-relative-humidity-conditons-development-problems-human-health.webp)
![Figure 2.25 – Impact of temperatue and relative humidity on the perceived air quality PAQ [79]](https://thumb-eu.123doks.com/thumbv2/123dok_br/16588437.738863/51.892.189.703.102.460/figure-impact-temperatue-relative-humidity-perceived-quality-paq.webp)