Social Network Analysis for Insurance Fraud
Detection
Nuno C. Garcia
Dissertação para obtenção do Grau de Mestre em
Engenharia Informática
(2
ociclo de estudos)
Orientador: Prof. Doutor Hugo Proença
Acknowledgments
First of all, I would like to thank Professor Hugo, for his support and guidance through this year. This work is fruit of a collaboration between UBI and Deloitte Portugal. I would like to thank Deloitte Portugal, namely Nuno Carvalho, Tiago Durão and Diogo Fernando for the opportunity of developing research on an enterprise environment, and the fortune of being able to learn with the standards of excellence that guide the company. Also, a word of gratitude to all my colleagues with whom I shared this journey.
To all of my friends, for the happiness they bring to my day, giving me strength to go through adversities.
To my family, for the always important harmony and positive feelings.
To my mother, my father and my sister, for the everyday love and wise advises, for never letting me down.
To Vanessa, for the patience, encouragement and love, that made this a pleasant year, full of light and beauty.
Resumo alargado
A detecção de fraude configura um desafio interessante, que não está totalmente resolvido par-ticularmente no que respeita a fraude em seguros automóvel. A fraude no seguro automóvel representa várias centenas de milhões de euros de prejuízo para as companhias seguradoras na Europa, e consequentemente um aumento de preço das apólices cobrado ao consumidor final. A dimensão do mercado segurador e o impacto que a fraude tem nas companhias faz com que a tarefa de detecção de fraude possa transformada em vantagem competitiva, e assim se assuma como uma prioridade no sector. A fraude que provoca danos mais volumosos é a praticada por grupos organizados, que concebem esquemas e contornam o sistema de forma a sistematicamente repetir a actividade fraudulenta.
Esta dissertação aborda o tema da detecção de fraude de uma perpectiva que não será a mais comum nos sistemas hoje em dia utilizados. Em vez de analisar dados de sinistros como números e estatísticas isoladas, tenta perceber as relações entre as entidades que participam nos sinistros e identificar estruturas suspeitas de entre um vasto conjunto de dados.
O conjunto de dados necessário à análise que propomos tem características especiais, como por exemplo ser sensível a divulgação a terceiros por conter dados pessoais e ser normalmente pro-priedade das companhias de seguros ou de estruturas policiais. Por estes motivos, não existem conjuntos de dados públicos que permitam o desenvolvimento de uma investigação neste sen-tido.
Para colmatar este facto, propomos um gerador de grafos aleatório capaz de produzir redes com padrões semelhantes àqueles que seria expectável encontrar em cenários reais. O gerador incor-pora conhecimento descrito na literatura [ŠFB11] sobre características e padrões encontrados em conjuntos de dados relacionados com este tema. Além disso, especialistas de seguros da Deloitte, parceira no desenvolvimento desta dissertação, contribuiram com a sua experiência no campo para que o gerador pudesse representar fielmente a realidade.
No que respeita à detecção de fraude, este trabalho propõe uma abordagem que inclui a classi-ficação de componentes do grafo como fraudulentos ou honestos, através do uso do conhecido classificador SVM (Support Vector Machine). São feitas avaliações de performance com várias vari-ações do método proposto e de parte do método que inspirou a abordagem usada, chamado PRIDIT. Uma das conclusões mais interessantes que estas experiências parecem sugerir é que nem sempre o uso do método PRIDIT garante o aumento de performance desejado.
As contribuições deste trabalho centram-se no desenvlvimento de um gerador de grafos para o contexto de análise de fraude de seguros automóvel, e na avaliação e comparação do uso de SVM na classificação de componentes fraudulentos.
Abstract
Fraud detection configures a very interesting problem yet to solve, particularly when related to automobile insurance claims. In this research we address this challenge from a not so typical "record" perspective of data, but rather from a network point of view, where relations between entities involved in claims are explored to detect organized fraud structures.
First we propose a random data generator, able to generate graphs that resemble realistic patterns evidenced on authentic scenarios, based on insurance authorities statistics and graph features already described in the literature. We show how this graph copes with the requirements on every single step, and how it can be adjustable to different locals.
Secondly, we propose a variation of Subelj approach [ŠFB11], and apply it to the generated graphs. This approach explores the relations between entities, takes advantage of the power of social network analysis metrics and statistical methods such as RIDIT scores and Principal Component Analysis to score each connected component and Support Vector Machines to classify them either fraudulent or honest.
The main contributions of this research is a new approach to generate data regarding automobile insurance claims suitable for social network analysis, and a variation of an approach described on the literature, proving thus not only benchmark results but also new insights regarding fraud detection through graph-based algorithms.
Keywords
Contents
1 Introduction 1
1.1 Motivation and Objectives . . . 1
1.2 Document Organization . . . 2
2 State of the art 5 2.1 Fraud Detection . . . 5
2.2 Social Network Analysis . . . 11
2.2.1 Historical perspective . . . 11
2.2.2 Applications . . . 12
2.2.3 Mathematical foundations and general concepts . . . 13
2.2.4 Related Work . . . 16
2.3 Market Solutions . . . 20
2.3.1 IBM i2 . . . 20
2.3.2 SAS Fraud Framework . . . 21
2.3.3 Deloitte Analytics . . . 22
2.3.4 Others . . . 22
3 Proposed System 25 3.1 Automobile Insurance Claim Graph Generator . . . 26
3.2 Fraud Detection . . . 29
3.2.1 Community Detection . . . 29
3.2.2 Feature Extraction . . . 30
3.2.3 PRIDIT method . . . 30
3.2.4 Classification using Support Vector Machine . . . 31
4 Experiments and Discussion 33 4.1 Dataset Description . . . 33
4.2 Experiments . . . 33
5 Conclusion 39 5.1 Future Work . . . 39
List of Figures
2.1 Four types of networks representing same two collisions - (a) drivers network, (b) participants network, (c) COPTA network and (d) vehicles network. Rounded ver-tices correspond to participants, hexagons correspond to collisions and irregular cornered vertices correspond to vehicles. Solid directed edges represent involment in some collision, solid undirected edges represent drivers (only for the ve-hicles network) and dashed edges represent passengers. Guilt in the collision is
formulated with edge’s direction. (Figure used with author’s authorization) . . . 17
2.2 Four COPTA networks showing same group of collisions. Size of the participants’ vertices correspond to their suspicion score; only participants with score above some threshold, and connecting collisions, are shown on each network. The con-tour was drawn based on the harmonic mean distance to every vertex, weighted by the suspicion scores. (Blue) filled collisions’ vertices in the first network correspond to collisions that happened at night. (Figure used with author’s authorization) . . 18
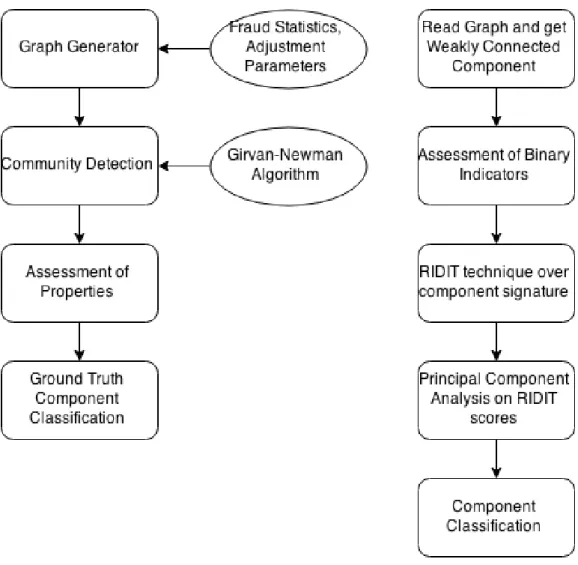
3.1 Schema for the proposed system. . . 25
3.2 The blue component on the left represent the initial component and on the right the two blue components resulting of the Girvan-Newman algorithm . . . 29
4.1 Holistic view of a graph similar to what is used for the experiments. . . 34
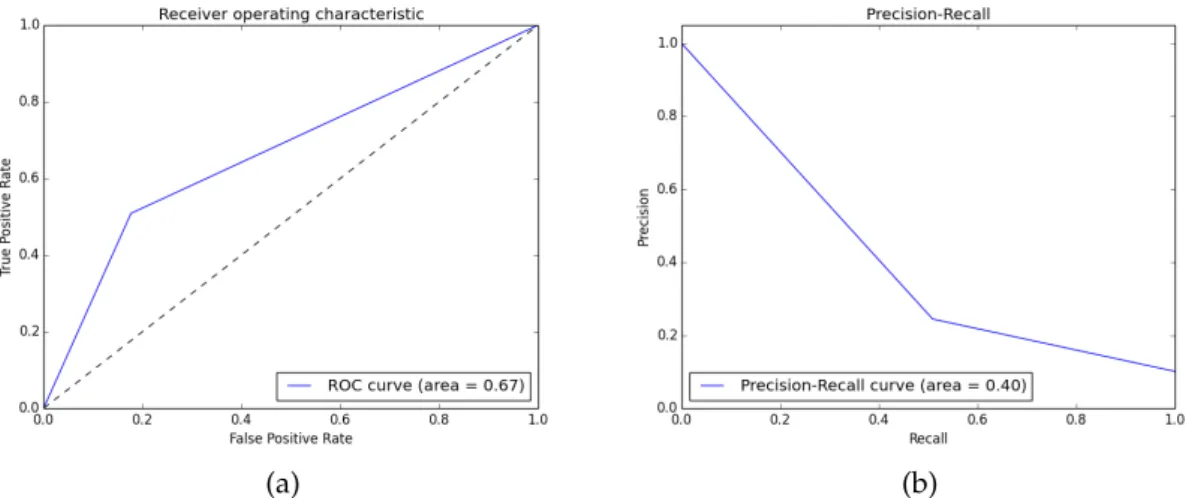
4.2 Results obtained with SVM, grid search optimization for accuracy score ,using the whole data set and real values features. . . 35
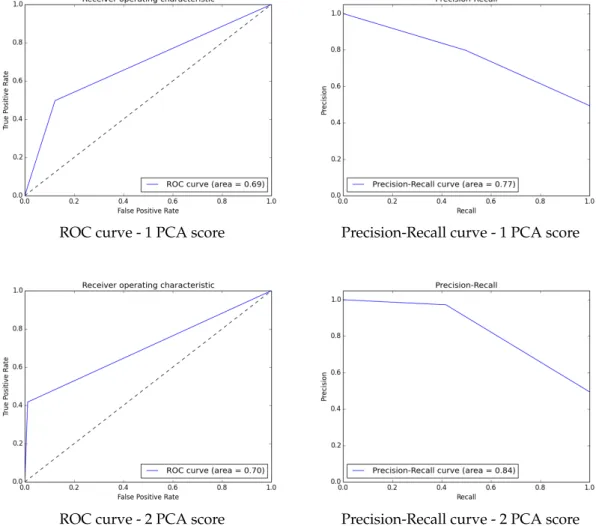
4.3 SVM performance using PRIDIT method. . . 36
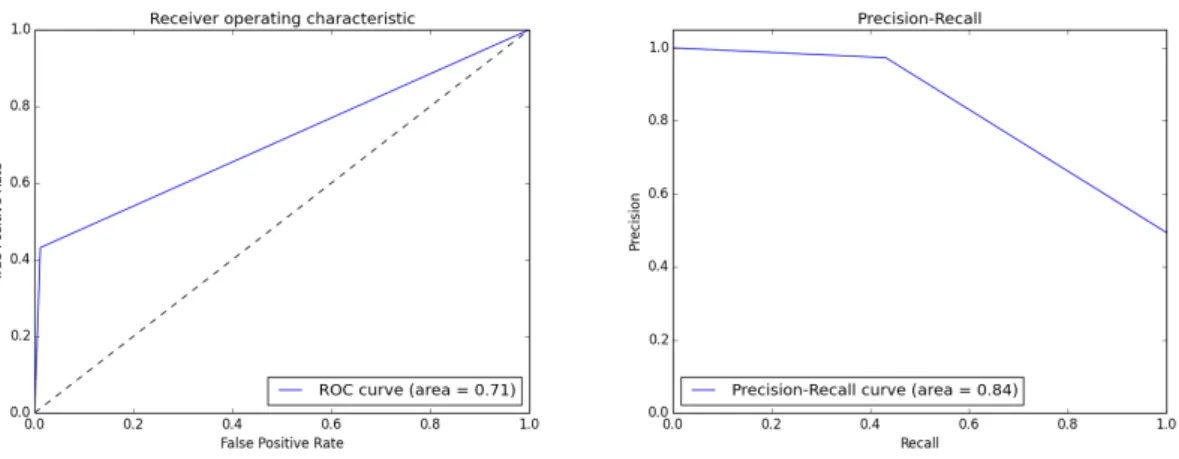
4.4 SVM performance using binary indicators. . . 37
List of Tables
Acronyms
UBI Universidade da Beira Interior EU European Union
OLAF European Anti-Fraud Office (Office Européen de Lutte Antifraude) APS Associação Portuguesa de Seguradores
ABI Association of British Insurers SVM Support Vector Machine PCA Principal Component Analysis
Chapter 1
Introduction
The term fraud refers to "deliberately deceiving someone else with the intent of causing dam-age" [Cor]. Throughout history, there are several records of major fraudulent events, such as bankruptcy, credit card or healthcare fraud, among others, that cause damage in a great variety of domains.
The Fraud Triangle is a model that tries to explain why people commit fraud, consisting in three elements: motives, which for instance can be the lack of money; rationalization, that is the abil-ity to justify the crime as acceptable given the circumstances; and opportunabil-ity, which gives the fraudster the possibility to act in secret [Cre73].
Moreover, fraud can be distinguished in soft and hard fraud. The first one refers to an exagger-ation of the damages reported on one legitimate claim, or when an individual lies about details or conditions in order to lower the policy’s premium or undercover important facts about the claim. In contrast, the hard fraud, instead of deriving from an occasional opportunity, refers to an intentional scheme designed by an individual or, most commonly, a group of individuals, with the objective of collecting the value related to the insurance policy.
One of the main factors that makes fraud so hard to detect is its dynamic nature. Fraudsters tend to break the law in uncountable imaginative ways, following changes in business norms and adapting to legislation in place.
To fight fraud at an european level and protect the financial interests of the European Union (EU), the EU created in 1999 the OLAF, European Anti-Fraud Office. This organism can coordinate and investigate fraud all over EU, as well as cooperate on the development and implementation of anti-fraud legislation, being a very visible sign of how engaged the EU is on this matter over this century.
Regarding the law framework in Portugal, insurance fraud is specifically contemplated on the Penal Code as a crime entitled "swindle against patrimony", punished with fine or imprisonment, depending on the amounts of money involved [Rep13].
Technology has become a very important piece on the investigation of such crimes. With the huge amount of data available to analyse, analytics software systems are the most reasonable way to start looking for suspicious activities. Recently, social network analysis have been applied to many fields with success on clarifying how people interact, bringing new insights to a broad range of problems, including to fraud detection [BCGJ11].
This dissertation addresses the issue of hard fraud on automobile insurance, which consists in any "duplicitous act performed with the intent to obtain an improper payment from an insurer" [Cor]. The present work was developed on enterprise environment, under a protocol established by UBI and Deloitte Portugal, having the co-supervsion of two Deloitte’s professionals besides the professor at UBI.
1.1
Motivation and Objectives
The insurance industry plays a relevant role on national and international economy panorama. According to the Insurance Europe, the european insurance and reinsurance federation, european
insurers generate premium income of almost 1100e billion1, employ nearly 1 million people and invest around 7700e billion in the economy [Ins13].
A 2013 report from the Portuguese Association of Insurers (Associação Portuguesa de Seguradoras APS) estimates 2012’s net income in 539e millions [dS13]. The same report states that in 2012 the total cost borne by policyholders having insurance contracts in the Portuguese market is 11.4e billion, in contrast with the 11.9e billions returned to the society. This fact, allied with the finance and economic situation installed, leverages fraud detection as a great tool to reduce costs and minimize this gap.
It is estimated that 10% of all claims expenditure in Europe is related with fraud, either detected or undetected. To contextualize in numbers, the Association of British Insurers (ABI) states that undiscovered fraud represents 2.2e billion each year, despite the amount of fraud detected from 2010 compared to 2011 increased by 7%. Also, data from Insurance Federation of France related to the year of 2011 shows records of 35042 fraudulent claims, equivalent to 168e millions which would be lost to fraudsters. In Germany, the fraud value per year goes up to 4e billions [Ins13]. Despite the lack of official statistics on fraud in Portugal, there are some studies that point to the raising of fraudulent events in the last years. For instance, Liberty Seguros, that operates in Portugal, revealed that fraud duplicated from 2007 to 2012. Going deeper on the matter, and reporting only to the automobile insurance branch, there was an increase of 112% on fraudulent sinister comparing data from 2007 with 2011 [+].
Analysing carefully these numbers, it can be conclude that this increase can be due to the fact that insurance companies are putting more effort on discovering fraud. Yet, another explanation emerges within the community, stating that this phenomenon is also related to the fragile financial and economical situation the country is experiencing, which drives people to have risky attitudes to win a little more money [+].
Insurance companies are increasingly aware of the damage fraud brings to their business, there-fore they have been particularly engaged in investigate fraud with more sophisticated techniques. Reducing fraud impact on insurance business allows companies to reduce insurance bill to the customer as well. For instance, it is estimated that in the United Kingdom, fraud is responsi-ble for an additional 58e/year on every policy, on average. On top of all this facts, identifying suspicious activity with more efficiency allows companies not to loose time with genuine claims, improving the quality of service and client satisfaction.
It is clear that the fraud problem needs to be address in a more structural way, through education and actions that can increase the awareness to this problem, with the final objective being the change of customers’ mindset, ethics and honesty, acting on the rationalization vertex of the fraud triangle. However, to act on the opportunity vertex, providing tools that allow to identify risks in a short time period is fundamental for the health of the business and can be extremely helpful on the overall fight against fraud.
Given all these statistics, showing the relevance of insurance on the economy and the impact of fraud, and due to the fact that, to a large extent, this is a still an unsolved problem and a relatively little explored field on computer science, the opportunity and pertinence to study this subject seems evident not only to the Deloitte Portugal, but also from a research perspective.
1.2
Document Organization
The rest of this document is organized in as follows:
• Chapter 2 - State of the art - This chapter addresses issues related to fraud detection, outlines the most common methods proposed on the literature to handle fraud detection in a broad range of domains. It also details some aspects related to social network analysis (SNA), gives some historic perspective and describes some selected methods particularly focused on insurance fraud detection using SNA. Finally, it also gives a market overview on the available solutions that could be used for this purpose.
• Chapter 3 - Proposed system - This chapter describes in detail all the phases of the proposed method.
• Chapter 4 - Experiments and results - This chapter describes the dataset, the experiments conducted with the approaches suggested before, compares performances and discusses results.
• Chapter 5 - Conclusions - This chapter outlines the conclusions of the present work, and outlines possible future work.
Chapter 2
State of the art
This chapter begins with a section dedicated to introduce fraud detection and provide a general overview of the most important data mining techniques used for this purpose, based on the Phua et al. survey [PLSG10] and a more specific survey on automobile insurance fraud detection from Viaene et al. [VDBD02]. After this, follows a section on social network analysis, its associated techniques and applications. Finally, it presents a review of the most relevant literature on social network analysis applied specifically to fraud detection.
2.1
Fraud Detection
With the increase of business environment complexity, and the need of cost savings, the ability to identify fraud as early as possible becomes a very important tool among companies from all over industries. To check manually all risk factors and all fraud indicators for every process, is not either cost nor time efficient, justifying the application of automated or semi-automated techniques for fraud detection.
On 1996, on a historical paper, Fayyad et al. [FPSSU96] already pointed fraud detection (on credit card monitoring and suspicious transactions) as one of the main Knowledge Discovery in Databases (KDD) application areas, along with marketing, finance, manufacturing, telecom-munications and internet agents. In this paper they define data mining as the "application of specific algorithms for extracting patterns from data", a step of KDD, a major process of "discov-ering useful knowledge from data". There are other steps that must be considered on KDD, such as data preparation, data cleaning, data selection, visualization and interpretation of results. Data mining techniques have been applied to fraud detection in many industries, being the most relevant the telecommunication sector, financial services (credit card transactions, insur-ance claims and money laundering), retail and government issues (escape tax, terrorism). It is not the scope of this section to describe the foundations of every data mining technique used in fraud detection, therefore, for a precise and complete explanation of each method please see [B+06]. Phua et al. [PLSG10] analysed literature related to data mining applied to fraud detection and categorised methods and techniques from the year 2000 to 2010. They categorise 51 papers on an industry level, on four main groups, internal, insurance, credit card and telecommunications fraud detection, and in some subgroups, respectively: management and employee fraud; home, crop, automobile and medical insurance; credit applications and credit transactional; and finally, telecommunication subscriptions and telecommunication superimposed. They reference 6 arti-cles on automobile fraud insurance detection, far less than the most referenced category with 15 references, credit transactional fraud.
The survey issues the number of attributes and examples of datasets used on 40 fraud detec-tion papers on internal, insurance, credit card and telecommunicadetec-tions. There are 11 insurance datasets identified, the largest with 4000 examples and the fewest attributes (about 6), and the smallest with less than 100 examples and about 70 attributes, which is the maximum for this cat-egory. Compared to these, telecommunications and credit card transactions datasets are much
bigger, many containing millions of records. Automobile insurance datasets’ attributes consist mostly on binary indicators concerning accident, claimant, driver, injury, vehicle, etc. Regarding the percentage of fraud and test examples in each study, 16 of the 19 papers considered for this analysis have skewed data with less than 30% of fraud.
Almost all data sets related to internal and insurance fraud lack of temporal information. Also, almost all data sets have been de-identified. Three of the 51 papers referenced by Phua et al. used simulated data, vainly, because results were not realistic or not explained. It is extremely difficult to find public data sets for fraud detection, in fact, the authors claim that there is only one small data set for automobile insurance.
Phua et al. also addressed the problem of performance measures. The research says some authors use Receiver Operating Characteristic (ROC) analysis, and only one focused on maximise Area under the ROC (AUC) and minimize cross entropy, the same that proposed to minimize Brier score. There are also authors that propose using one metric from threshold, ordering and prob-ability metrics to evaluate supervised algorithms, and Activity Monitoring Operating Charac-teristic specifically for timely credit transactional and telecommunications superimposition fraud detection. Regarding semi-supervised algorithms, some recommend entropy and a few of its vari-ations, information gain and information cost. Hellinger and logarithmic scores have been used by two authors on unsupervised approaches, as well as some other statistic measures to detect outliers, like t-statistic score. Insurance fraud detection is also commonly evaluated by comparing results with the opinion of domain experts.
Then, the authors continue to discuss the four major methods’ categories: supervised approaches on labelled data, hybrid approaches with labelled data, semi-supervised approaches with non-fraud data and unsupervised approaches with unlabelled data. Kou et al. also surveyed tech-niques on data mining, presenting the most relevant techtech-niques regarding the application, specif-ically, for credit card, telecommunications and intrusion detection [KLSH04]. Bolton & Hand [BH02] describe the statistical and machine learning methods most commonly used in fraud de-tection, covering a wide range of supervised and unsupervised algorithms.
The first category Phua et al. address uses all labelled data available to create a model and predict whether new instances are fraudulent or legal. Neural networks are among the most popular techniques, although others have also been used. Regarding neural networks, for instance, Ghosh & Reilly (1994) [GR94] trained a three-layer feed-forward Radial Basis Function neural network on both fraud and non-fraud accounts, using a set of 20 features per transaction. They sampled the data set, consisting on transactions of six months of 1991, so to have a ratio of 30 non-fraud accounts to each fraud account, ending up with a training set with about 450000 transactions. Due to its characteristics the network only needs two trainings passes through the data set, and then produced a fraud score for each transaction.
The authors evaluated the model on an unsampled set of all transactions of October and Novem-ber of 1991 (not coincident and posterior with training data period), corresponding to roughly 2000000 transactions. The first measure they present is a rank curve of the percentage of fraudu-lent transactions detected against the number of accounts flagged for review per day. The authors claim that if the system flag near 50 accounts per day, 40% of them would be fraudulent, which is a major improvement to the fraud detection efforts before that consisted in analysing 750 accounts to spot only one fraudulent instance. Ghosh & Reilly also measured the earliness of the detection, presenting a histogram that indicates that 50% of detected accounts are on the first two days of fraud activity, with a fraud threshold operating point of 1-fraud-per-day. Also, they measured the type of fraud detected regarding the several categories related to credit card fraud, such as lost cards, stolen cards, application, counterfeit, mail-order and non-received issue fraud, concluding
the system was detecting all fraud categories. This system was implemented on a bank, enabling the entity to achieve savings of 20% to 40%, at a reduced operating point human review.
Even though the aim of Barse et al. (2003) [BKJ03] was to prove the usability and applicabil-ity of synthetic data for fraud detection, it is relevant to point that they also used successfully a feed forward neural network with one hidden layer and an additional trace memory to deal with temporal dependencies in an IP based video on-demand service. Weatherford [Wea02] also dis-cusses the use of neural networks, giving some market solutions as examples, as well as artificial immune systems.
Ezawa & Norton (1996) [EN96] built a model based on Bayesian networks in order to predict whether a telecommunications’ customer account or transaction is collectible. They focus not only on the performance of the solution but also on the efficiency, due to the huge quantity of data commonly associated to telecommunications data sets, namely in this experiment from four to six million of records, each with more than 30 variables. The authors present some features inherent to the problem that motivate the choice of Bayesian networks instead of regression sys-tems, nearest-neighbour systems and neural networks, such as data size and dimension, unequal misclassification costs, and the probabilistic nature.
They evaluate the proposed system with four different probability models, two dependent and two independent, and used the Receiver Operating Characteristic curve to analyse results. Finally, Ezawa & Norton concluded the dependent models perform better than the independent, and discussed the balance between the probability threshold of collectible / uncollectible accounts and the true positives / false positives ratio.
Viaene et al. [VDD04] focus on the detection of suspicious personal injury protection automobile insurance claims, using a weight of evidence reformulation of AdaBoosted naive Bayes scoring. They evaluate the model concerning to the discriminatory power, ranking ability, and calibration of probability estimates. Thus, the authors use the percentage correctly classified measure to assess discriminatory power, receiver operating characteristic (ROC) analysis and area under the ROC curve to assess ranking ability, the logarithmic score to assess the quality of probability estimates, Brier score to asses both the quality of probability estimates and the discriminatory power, and finally they use Brier score on the calibration plot to assess again the quality of the model calibration. The data set consists on 1400 closed claims each with 48 binary indicators, previously investigated bu expert domains and assess using a 10-point-scale score wherein a score greater than 3 indicates that it should "not pass" without further investigation. In this data set, the "no pass" category represents 28% of all claims. For evaluation, the authors split the data set in 2/3 for training and 1/3 for testing, and eventually conclude the weight of evidence reformulation of AdaBoosted naive Bayes scoring to be the best among the models tested.
In [MTVM02], Maes et al. discuss the use of neural and Bayesian networks in credit card fraud de-tection. They use a feed-forward multi-layer perceptron with the backpropagation of error signal algorithm and for the Bayesian network they use the STAGE algorithm, described in the paper. The authors use ROC to measure the performance of the methods. Comparing both approaches, the Bayesian network outperforms the neural network for 8% maximum with 74% true positive at a cost of 15% false positives, and regarding training times, while neural networks may take sev-eral hours the Bayesian network only takes twenty minutes, although evaluating new instances is completely the opposite, with the neural networks being much faster.
One way Kim et al. found to evaluate the proposed support vector machine (SVM) ensemble on [KPJ+03] was to apply it to a fraud detection problem, specifically on this case, mobile telecom-munication payment. They performed binary and multi-class classification, concluding that SVM ensemble outperforms single SVM, that the particular type which implements majority voting
ag-gregation using polynomial kernel is the best for this application, with correct classification rates of above 95%, although not presenting false positives or other measures, and that multi-class is better according to this metrics than binary classification.
Fan (2004) [Fan04] proposed a cross-validation decision tree ensemble method to compare differ-ent scenarios related to the problem of combining old and new chunks of data to mine concept-drifting data streams. Although the purpose of this experiment was not to evaluate the per-formance of the fraud detection method, they used a credit card fraud data with 5 million of transactions to assess the model performance. The authors note that it is not wise to use old data blindly, and conclude that the cross-validation decision tree ensemble consistently outperforms all compared existing approaches that use old data blindly, particularly when the chunks of new data are small.
Wang et al. also addresses the problem of mining data streams with concept drifts, and proposes a general framework for mining concept-drifting data streams using weighted ensemble classifiers. In [WFYH03], the authors apply successfully their method to the same data set used by Fan (2004), and discuss the advantages of classifier ensembles over single model classifier.
In [RMN+99] Rosset et al. present a two-stage system based on adaptation of the C4.5 rule gen-erator with an additional rule selection mechanism, design to cope with the unique features of rule-discovery for fraud analysis. The authors describe what makes the traditional algorithms and methods of classification and rule-discovery fail when applied to fraud, such as: the exis-tence of, at least, two data levels (customer details and behaviour details); the requirements of good rules and how they have to be accurate at the customer level, sensitive related to the cover-age of true positives cases and covercover-age of true positive alerts; and requirements of good rule-sets, namely how to choose the right rule-sets in order to maximize the three previous requirements. The data set used in this experiment is related to telecommunications transactions, and consisted on a few hundred "legitimate" customers and a few hundred bad debt customers. They run the standard C4.5 rule generator and the proposed "bi-level compliant" version of the C4.5 engine, and verified that the latter returned much more interesting patterns than the first, even though they did not disclose the rules because of confidentiality issues. The authors used 4 measures of performance: set size, accuracy, fraud coverage and maximum correlation.
Bonchi et al. (1999) [BGMP99] expose a case study on fiscal fraud detection that illustrates how classification-based techniques can help to plan audit strategies, i.e. a posteriori fraud detection. In this experiment, the autors also used a variant of C4.5 algorithm, in this case, the C5.0, and evaluate the model with 2 domain-independent metrics (confusion matrix and misclassification rate) and 4 domain-dependent related to audit costs, money recovery, profitability and relevance. Wheeler & Aitken (2000) [WA00] addressed the problem of reducing the number of cases flagged for investigation by existing systems, in the credit approval process, using a Case-Based Rea-soning approach. The data set consists in pairs of records, one related to the application to be investigated and the other to the evidence that justified the decision. A weight matrix and nearest neighbour algorithm were used on the retrieval component, and the diagnosis was composed by a set of algorithms such as probabilistic curve, best match, negative selection, density selection and default goal. The authors argue that this multi-algorithmic approach may outperform the use of isolated algorithms.
Belhadji et al. (2000)[BDT00] developed a model for the detection of insurance fraud related to property damages in the automobile sector, based on the systematic use of fraud indicators. The authors choose the attributes that best indicate the existence of fraud on three steps: first with the help of domain experts of several insurers, then calculate the conditional probabilities for each indicator in order to reduce the number of indicators to include in the model, and finally with
Probit regressions. The authors then calculate the probability of fraud for each file in the data set, discuss the threshold to apply and the costs of further investigation on suspicious cases.
The combination of some of the previous supervised techniques referred above provide more sophisticated approaches to this problem. For instances, Chan et al (1999) [CFPS99] proposes a credit card fraud detection system, with great focus on scalability and efficiency. They apply mining techniques to generate classifiers in parallel and then combine the base models (Bayes, C4.5, CART and RIPPER) generating a metaclassifier. Their approach have the limitation of being necessary to run preliminary experiments to determine the desired training distribution.
Phua et al. (2004) [PAL04] combined backpropagation neural networks, naive Bayes and C4.5 algorithms as base classifiers. The authors used a stacking-bagging approach, i.e., they used a single meta-classifier to choose the best base classifiers, and then combined the predictions of base classifiers. This model was evaluated on a public automobile insurance fraud detection data set, and the authors claim it outperforms the best bagged algorithm and the best classifier, as so the common technique used in the industry which was, at the time, backpropagation neural networks.
Ormerod et al. (2003) [OMB+03] propose a tool that uses a Bayesian network of fraud indicators, which dynamically adapts its weights according to a rule generator, considering how predictive each indicator is of specific types of fraud. The authors do not present any comparison or evalu-ation experiments. Kim & Kim [KK02] focus on the bias of the training set, due to the nature of fraud. They analyse the fraud density and work it along with a backpropagation neural network to calculate a weighted suspicion score on credit card transactions.
Also, some authors suggest the combination of supervised with unsupervised algorithms, mostly on telecommunications fraud detection [PLSG10]. In 1997, Fawcett & Provost [FP97] proposed a fraud detection system that would learn rules from labelled fraudulent behaviour and use the indicators to monitor daily usage and find anomalies for each customer. A Linear Threshold Unit learns the output of these monitors (set of indicators), and generates high confidence alarms. The authors present comparisons with another fraud detection strategies and several detectors, claim to outperform state-of-the-art at the time, and present other advantages such as the adaptability and flexibility compared to others.
Among other usage of unsupervised algorithms is the segmentation of insurance data into clus-ters for supervised methods to analyse. Williams & Huang (1997) [WH97] focus on finding hot spots (clusters) in very large real world databases, adopting a multi-strategy approach comprised of three steps: cluster detection using k-means, description of clusters using C4.5 rule generator, and rule evaluation using statistics, visualization tools and ultimately domain knowledge. This method was applied to a healthcare data set in order to identify hot spots of fraudulent payments related to the government healthcare program. The same author followed a similar methodology with some tweaks, for instances, using a genetic algorithm instead of C4.5 rule generator [Wil99]. Likewise, Brockett et al [BXD98] use Self Organising Maps for clustering and then backpropaga-tion neural networks to identify fraudulent claims.
Fraud detection can be addressed as an anomaly detection problem, if we can extract features from all legitimate records, claims or other data and identify when a pattern does not fit the nor-mal behaviour expected. In [CBK09], Chandola et al. give a comprehensive view on anonor-maly de-tection techniques, analysing both more general methods and more specific application-dependent methods, namely related to fraud detection. They cite some examples on credit card fraud detec-tion, most of them using neural networks and some using rule-based systems and clustering algorithms. Statistical profiling methods and parametric statistical modelling have been used for mobile phone, insider trading and medical healthcare fraud detection, as well as rule-base
sys-tems and neural networks. Regarding the insurance domain, Chandola et al. say this problem is often addressed as a activity monitoring problem as in [FP99], but approaches using neural networks to identify anomalies can also be found.
Moreau et al. [MLV+99] studied fraud detection on mobile communications and proposed BRU-TUS, which is a hybrid detection tool based on rule generation methods and neural networks that enable the profiling of both network subscribers and traffic. They compared rule-based and supervised neural networks systems with unsupervised neural networks, and, as expected, the supervised approaches reached better results than the unsupervised, although the best results came from a hybrid model. In this sense, Taniguchi et al [THHT98] also reported better results using supervised neural and Bayesian networks than unsupervised Gaussian mixture models, and also, that the combination of supervised and unsupervised techniques could produce better results.
However, fraud detection systems applied in real world face some particular challenges that makes it a problem so hard to solve and so interesting. Specially, developing methods to de-tect fraud which use labelled data assumes that this data is going to be available and thus would not compromise the performance of the system. In reality, labelled data is extremely hard to find, expensive to obtain as it demands a lot of manual work of domain experts, and even more difficult to have in the amount necessary to effectively train some models. Phua et al. [PLSG10] suggest that the future of fraud detection research can benefit from unsupervised approaches already pro-posed in related fields such in anti-terrorism, law enforcement, intrusion and spam detection, etc. These reasons justify the need for unsupervised methods using unlabelled data, which give an extra challenging nature to the already difficult fraud detection task, but also can provide the flexibility and adaptability this task demands.
Bolton & Hand focus on detecting behavioural fraud through the analysis of credit card transac-tions over time [BH+01]. They present two unsupervised methods to detect behaviour changes. The first tool is Peer Group Analysis, a method based on the ability to recognize when an account starts to behave differently from other accounts which usually used to behave alike. The method summarize each account behaviour pattern, chooses the peer group accounts of each account and monitors the behaviour of each peer group to spot if an account from a peer group is beginning to stand out, based on a t-statistic analysis to calculate the distance to the peer group centroid. The author also propose a method called Break Point Analysis, which focus on spending behaviour. This tool focus on intra-account behaviour in order to detect rapid spending, based on the com-parison of recent transactions with previous transactions, within a time-window of 24 hours. Brockett et al. introduce a mathematical technique for fraud classification that does not require training data [BDG+02]. The authors used principal component analysis of RIDIT scores for rank-ing automobile insurance claims, providrank-ing measures of both the ordered categorical attributes of a claim and the claim file overall score. Hollmén & Tresp present a call-based fraud detection using a hierarchical regime-switching model [HT99]. This real-time method models a hierarchical structure, at the lowest level representing the behaviour of individual calls, next level the switch-ing behaviour from normal to fraudulent, and at the highest the transition to beswitch-ing "victimized" by a fraudster. Hidden Markov Models have been used to model time series at different time resolutions. The authors used ROC curves to measure the peformance of the model, and claim to have detection probabilities of 0.92 for a fixed false alarm probability.
More related to the scope of this dissertation, Phua et al. pointed link analysis and graph mining as hot research topics little applied to fraud detection, but already applied for anti-terrorism, for instance. In this issue, [CPV02] addressed telecommunications fraud detection, and propose a data structure able to handle dynamism through time, with appearing and disappearing edges
and nodes. Although there are some market solutions, discussed later on this chapter, using visualization tools to help domain experts spot fraud rings, there are little work on this topic among the research community. Back in 1997, Cox et al. [CEWB97] proposes a suite of visual interfaces with the intent to combine human pattern recognition capabilities with computational capacity for telephone fraud detection.
Fraud detection methods can be inspired by similar fields, namely terrorism, financial crime and intrusion and spam detection [PLSG10]. Bayesian networks have been applied to detect simu-lated anthrax attacks, and other techniques like sliding linear regression or hidden Markov mod-els have been used to detect other epidemics. The United States government use some tools to detect suspicious activities such us money laundering, violative trading and insider trading activities, based on some techniques already mentioned, including Bayesian inference engines, link analysis for visualization purposes, case based reasoning, nearest neighbour retrieval, de-cision trees, association rules, text mining, statistical regression and fuzzy matching. Zhang et al. [ZSY03] proposed a technique to uncover money laundering by analysing documents and suggest links between them to generate community models, using a correlation measure. Also Donoho [Don04] compares C4.5 decision tree algorithm, backwards stepwise logistic regression and neural networks with a manually built expert system for early detection of insider trading in option markets. C4.5 algorithm outperformed the rest of the methods, and the expert system produced the worst results. Regarding spam and intrusion detection, recent research focus on the branch of anomaly detection methods, semi-supervised and unsupervised techniques, thus some algorithms could have some application on the fraud detection problem.
2.2
Social Network Analysis
This section is going to approach the state of the art on SNA, first by giving an historic perspective, followed by the description of some relevant applications on the industry, then providing some definitions and then surveying some of the most common methods and techniques.
2.2.1
Historical perspective
Social Network Analysis (SNA) has captured the interest of many researchers from a broad spec-trum of scientific disciplines as anthropology, economics, geography, biology, marketing, and several more, but its foundation came from both psychology and sociology. In the 30’s, Jacob Moreno developed sociometry to investigate friendship relations, founded a journal entitled So-ciometry and invented the sociogram, which is a diagram of points and lines representing relations between persons. In the 50’s, the department of sociology Manchester University started to inves-tigate the cohesiveness property of society, inspiring later on the 60’s and 70’s a Harvard group to develop a mathematical formulation of many social sciences concepts. [SC11]
One of the most famous (and early) SNA studies is the Travers and Milgram experiment on the late 60’s, associated with the expression "six degrees of separation", in which the researchers wanted to analyse the social structure of USA population and extrapolate the results to a world scale [TM69]. The procedure to do social networks experiments by these times was incredibly different from what it is nowadays, not only respecting the application domains but also to the size of data, the nature of data itself, how it is collected, how it is processed, and so on.
Furthermore, the mathematical foundations of social network analysis can be traced throughout the history of graph theory in discrete mathematics, beginning in 1736 with the work of Leonard
Euler. Later on with the analysis of all kinds of networks (computer, biological, financial, med-ical, transportation, and others) [BCGJ11], these methods have been applied in so many distinct contexts that we can group the different experiments on the major label of network science. One of the most relevant books on SNA until today was published on the last decade of the 20th century [Was94], resuming in a comprehensive way the methods and applications developed to the time. Also, the major version UCINET IV was released on 1992, consisting on a suite of software programs for the analysis of social network data, roughly at the same decade Pajek started to be implemented, another well-known software package for SNA.
More recently, SNA is having a great impact due to the powerful insights on how society is struc-tured and its behaviours, using data from online social networks (Facebook, Twitter, LinkedIn, etc.), mostly for marketing purposes, but not only. These platforms provide a massive source of data enabling not only to address old problems in novel ways, but also to pose new ones, regard-ing the type of data they collect and to the nature of relations they are able to describe.
Bonchi et al. [BCGJ11] say the research on social network analysis was conducted not from a business application viewpoint, but with a more theoretical approach, trying to answer common problems related to the structure of networks (its properties), its evolution along time, or how information propagates inside a network, but without relating these problems with a specific application.
2.2.2
Applications
Social network mining research has been approached from a very generic point of view, some-times making it hard to claim their space on the market applications, perhaps with the exception of telecommunications sector. However, there are many potential applications for SNA, besides fraud detection and the sociological problems, which are surveyed in this section. In this issue [BCGJ11], Bonchi et al. outline some applications for SNA categorized in operating processes and management and support processes, some of them referred on the next paragraphs.
Regarding fraud detection, and besides the solutions presented on the section 2.3 and the refer-ences related to unsupervised methods above, there are a few relevant application studies, for instances, in [VD06] the authors investigate camouflaged fraud in complex domains with high number of known relationships. Neville et al. [N¸SJ+05] focus on exploit several sources of infor-mation, considering relationships among multiple entities on their statistical relational learning algorithms. More on this topic to be addressed on the section 2.2.4.
SNA is mostly used for marketing and advertising purposes across industries, and particularly on online environment. For this goal, calculating reputation and trust, and identifying commu-nities of interest becomes major issues, with an infinity of contexts where these techniques can be applied. For instances, calculating individuals reputation on a recommendation system or on a similar environment can be extremely useful to power the usability of a e-commerce website like eBay, to manage products revisions and score reviewers [MA02], helping the community to regulate itself. Finding experts on some matter on Q&A forums or within the corporation human resources has been also studied [YSK03].
On marketing as well, SNA is being applied to build suggestion friends systems by implicit link analysis and link prediction [SBC+10], to trend spotting by analysing customers data [NPS08] and understand what will be their needs, to identify interesting communities for customer loyalty re-ward programs [HPV06], to evaluate how communities evolve through time, and to understand how information, knowledge spread along the network [HLL+07] [GGLNT04], to give a few ex-amples. Lately, there has been a pike of interest in influence and its propagation along the network
in order to understand viral marketing [Wor08], comprising tasks such as selecting the key users in a network to start a campaign, track how influential users affect the opinion of its followers and how it affects the networks, etc.
Also, SNA can change the way corporations work, on the inside by inspiring new strategies re-garding how they manage their knowledge (expert finding) [DYB+07] [PE06], how they assemble teams, how the employees work collaboratively and communicate to each other, and on the out-side, by leveraging communication to its partners and to its customers on a more effective and direct way. Also, the way corporations launch their marketing campaigns, by building systems to monitor customers and keep track of products’ reactions, identify customers communities, un-derstand how their customers network evolve over time, and other business intelligence golden insights. Another interesting application of SNA is the analysis of how epidemics spread and to understand the behaviour of such health phenomena [PSV01].
This vast range of applications arise privacy issues in what respects to the acquisition, prepara-tion, manipulation and storage of sensitive data. A new paradigm of privacy-preserving data mining was proposed to deal with this question [AS00]. Particularly in SNA, not only the infor-mation attached to the nodes and edges of the network is sensitive, but also in some situations, the structure of the network can be significant, and therefore needs to be hidden [BDK07]. In this sense, there have been many suggested approaches. Anonymization of graphs and social net-works is discussed in [BCGJ11], which categorizes methods of identity obfuscation in three cate-gories. The first has to do with deterministic edges deletion or addition, providing a k-anonymity. The second is not deterministic, and is based on random additions, deletions and switching edges operations, and the third, instead of changing the appearance of the network, group the nodes into supernodes and protect the data in the sense that it changes the resolution of the network.
2.2.3
Mathematical foundations and general concepts
Social network analysis, as seen before, emerged from a variety of science fields, what makes it hard to define conceptually, however it can be described as a set of methods for the analysis of social networks, "based on the assumption of the importance of relationships among interacting units" [Was94] [Sco88]. A social network can be informally defined as a set of social entities and the relations among them, being this feature of relational attribute the fundamental aspect that defines a social network. A social relation is a dyadic attribute, meaning that it is an attribute related to a pair of entities, i.e.: kinship (brother of, mother of), social roles (married to, boss of), affective, actions (attacks, communicates), distance, etc.
Formally, a network is commonly represented as a graph, which is an object very well studied on mathematics and is at the foundations of what is called graph theory, that inspired SNA on several of its techniques. A graph is usually defined as a set of points (vertices or nodes), and a set of edges or links defined by a pair of vertices. This definition does not define a direction for edges, thus representing an undirected graph, whereas a directed graph impose that edges are defined by ordered pairs of vertices. Multigraphs are a spare relaxation of these definitions, allowing loops and multiple edges. Also, it is regularly used labels to annotate some information on both vertices and edges, originating labelled graphs. It is often assigned to edges a weight, representing the strength of the relation between those entities. In that case, the graph is called a weighted graph. Another relevant concept is the one of connected component, which refers to a subgraph where any two points have a path to each other. For an extended approach to network theory, please see [New03].
2.2.3.1 Link Mining
Link mining stands at the intersection of data mining and network analysis, involving tasks like object ranking, community detection, collective classification, link prediction and subgraph dis-covery. In fact, Getoor & Diehl [GD05] suggest a taxonomy on link mining that highlights 8 tasks, some of them covered in this section:
• Object-Related Tasks
Link-Based Object Ranking (LBR) Link-Based Object Classification (LBC) Object Clustering (Group Detection) Object Identification (Entity Resolution) • Link-Related Tasks
Link Prediction • Graph-Related Tasks
Subgraph Discovery Graph Classification
Generative Models for Graphs
Regarding SNA, LBR represents the task of measure the importance of an individual in the net-work, which can be addressed through the use of centrality measures.
• Degree Centrality [Fre79] - Local measure calculated by counting the number of links of an actor to actors directly adjacent to it. High degree centrality values indicates this entity is strongly connected to others and possibly is an influential actor. Degree centrality CDof an actor vican be calculated as:
CD(vi) = n X j=1
a(vi, vj)
where n is the total number of actors in the network and a(vi, vj) =
(
1 if viand vjare connected by an edge, 0 otherwise.
A generalization of this measure is the k-path centrality, that counts the number of paths of length k starting from a given node.
• Closeness Centrality [Fre79] - Measures how close an actor is to all other actors in the net-work. This means that small values indicates that the actor is well located in the network, close to everybody. Closeness centrality CCof an actor vican be calculated as:
CC(vi) = n − 1 n P j=1 d(vi, vj)
where n is the total number of actors in the network and d(vi, vj)is the geodesic distance between the two actors. The geodesic distance is the number of edges between two nodes in a shortest path.
• Betweenness Centrality [Fre79] - This measure indicates the number of times an actor stands in the way of a path to another actor in the network, or it can also be seen as the probability an actor is included in the communication between two other. This means that actor with high centrality usually work as bridges to promote and simplify the flow of information within the distinct parts of the network. Betweenness centrality CB of an actor vi can be calculated as: CB(vi) = n X j,k gjik gjk , i 6= j 6= k
where n is the total number of actors in the network, gjkis the number of geodesic paths from actor j to k and gjikis the number of those geodesic paths that pass through actor i. • Eigenvector Centrality [Bon72] - This measurement indicates how central the node is
regard-ing the whole structure of the network, in other words, how a node is connected to other well-connected nodes in the network. It is computed by taking the principal eigenvector of the adjacency matrix.
There are several variations based on this approaches, proposed for dynamic graphs, for mea-suring centrality relative to other objects, and also several different algorithms to calculate those [ST11].
The are also some measures based on edges, instead of nodes:
• Tie Strength [Gra73] - This measure reflects the embeddedness of an edge, this means, if two incident nodes on a given edge have a high overlap of neighbourhoods. For instances, if two actors A and B connected through a given edge have many neighbour nodes nA, nB in common, they’re said to have a strong tie. Formally, using the Jaccard coefficient:
S(A, B) = |nA∩ nB| |nA∪ nB|
• Edge Betweenness - Similar to the betweenness centrality presented before, this measure has a particular use in graph partitioning, where edges with high betweenness are iteratively removed until some point, creating disconnected components. It represents the number of pairs of nodes for which a given edge belongs to the geodesic path.
The second object-related task indicated is LBC, which in the context of this work, can be useful to classify a node as fraudulent or not. Using LBC, there is a primary assumption that labels of re-lated objects (which would be classified the same category) tend to be correre-lated, a fact that these algorithms for collective classification need to take advantage of. There are several approaches to this problem, with multiple applications not only on SNA but also on fields like computer vision and natural language processing.
A curious outcome of a couple of experiments in LBC is that using class labels of related ob-jects improves classification performance, but including its features may have a negative effect [CDR+98] [OML00].
Moving to the next task, group detection aims to identify clusters of nodes that resemble the same features. There are several approaches to this task described in the literature, and for a deep review of this topic it is recommended to see Fortunato [For10]. Methods are mainly divided in agglomerative or divisive approaches and deterministic or stochastic. The edge betweenness [Fre79] measure, already referred before, was used in [GN02] by Girvan and Newman to rank edges and build a top-down approach of the classic hierarchical algorithm for community detec-tion. Instead of starting with all nodes disjointed and iteratively construct communities in respect
to some similarity measure, they started with all nodes belonging to one community and then started to remove edges, thus naturally creating communities, ending up with a hierarchical sub-graph partitioning algorithm. Girvan and Newman further proposed the modularity measure to evaluate what is the best hierarchical subgraph. Another well-known family of community detection algorithms, based on graph theory, is graph-partitioning algorithms, focused on the concepts of minimum cut and maximum flow [FTZ04] and spectral partitioning which involves using standard clustering algorithms on point in Euclidean space [Llo82].
Object identification as known as entity resolution, consists on identifying duplicates of instances on the graph, this is, if there are multiple nodes referring to the same entity. Link prediction focus on discovering links that are not explicitly defined on the graph, thus uncovering hidden connections. On the graph-related tasks, subgraph discovery focus on discovering frequent sub-structures in a set of graphs, graph classification is the task of classify an entire graph as instance of a given concept, and generative models for graphs focus on the generation of new graphs based on a set of features previously defined or assessed from another graph. All these latter tasks could be interestingly applied to fraud detection. Although it is not the scope of this thesis, some aspects are further discussed on section 5.1.
Depending on the context of link mining, and specially applied to fraud detection, it is very common to find data sets with skewed data, that is, with many records of honest transactions (or whatever it represents), and little few cases of fraudulent transactions. This problem can be addressed at the time of pre-processing data, with either under-sampling the majority class or over-sampling the minority class, or using different weights on the training set distribution in order to balance in some way the data set, through boosting algorithms [KN06] [Alm09].
2.2.4
Related Work
2.2.4.1 Subelj, L. et al. method
In [ŠFB11] Subelj et al. proposed an expert system for detection of groups of automobile insurance fraudster, the so called non-opportunistic fraud. This approach uses networks to represent data, justified with the fact that collaborating fraudsters are commonly related to each other, and since networks are essentially relations between entities, it is appropriate to detect groups of fraudsters, besides the cle ar visualization necessary for the following stages of investigation.
The authors also propose a novel algorithm to find fraudulent entities within this networks, con-sidering intrinsic attributes and relations between entities. The algorithm allows the incorpora-tion of domain knowledge, which the authors say is useful to adapt it to new types of fraud. Collision networks, which consist in individuals and vehicles, are used to assign to each entity a suspicion score.
The system frameworks consists in four modules: the networks construction from the data set; the highlight of suspicious connected components on the networks of first module, considering structural properties; the third module consists on assigning a suspicion score to each entity of each suspicious component, using the novel proposed algorithm; and finally, in the fourth module the system provides a clear visualization of this identified suspicious entities of the network to the domain experts.
In the first module, the authors present some guidelines for constructing networks from relational domain data, and discuss that there are several different types to represent a collision network, particularly ten possible ways to connect three entities (collision, participant and vehicle). They further discuss, considering the guidelines described, the drivers networks (networks where drivers involved in the same collision are connected), participant networks (where participants
are connected to corresponding drivers), Connect Passengers Through Accidents (COPTA) net-works (where participants are connected to collisions vertices, a new type of vertex), and the vehicles networks (where collisions are represented by edges between vehicles, which also con-nects to all participants), as seen in figure 2.1. Finally, they state that they use different types of
Figure 2.1: Four types of networks representing same two collisions - (a) drivers network, (b) participants network, (c) COPTA network and (d) vehicles network. Rounded vertices correspond to participants, hexagons correspond to collisions and irregular cornered vertices correspond to vehicles. Solid directed
edges represent involvement in some collision, solid undirected edges represent drivers (only for the vehicles network) and dashed edges represent passengers. Guilt in the collision is formulated with edge’s
direction. (Figure used with author’s authorization)
networks in the different modules, using participant networks in the second module (suspicious components detection) and COPTA networks in the third module (entity suspicious detection). Furthermore, Subelj et al. suggest that edge betweenness [GN02] could be used to simplify large networks and end with smaller and simpler connected components to input the second module, without loosing relevant information.
The second module aims to detect fraudulent components within the networks of participants, and eliminate all others. Domain expert knowledge suggest that these fraudulent components share some structural properties, such as dimension, density, centrality measures, existence of cycles and so on. The authors define a collection of such binary indicators, that will be used to produce an overall answer to whether a component is suspicious. For the structural independent indicators, domain experts set simple thresholds, while for the dependent the process is not so trivial. Subelj et al. propose to build random networks with rewiring algorithms representing honest behaviour, assess its values, and then decide if the real networks indicators correspond with honest or fraudulent activity. Then they discuss the use of principal component analysis of RIDITs [BL77] to sort of weight each indicator reflecting its importance and score each component as suspicious or not.
The third module is related to the detection of suspicious entities within the already detected sus-picious components. The Iterative Assessment Algorithm (IAA) assigns a suspicion score to each participant, considering not only both intrinsic and relational attributes of the entity evaluated, but also of the related entities, which results in using indirectly all network on the assessment of one entity. IAA uses some assessment model AM to iteratively score an entity, which arguments are the set of scores for the neighbour entities of the entity considered, the intrinsic attributes of related entities and itself, and the relational attributes of the entity. The algorithm starts with a fixed arbitrary value for the initial scores and then iterates a number of times or until some convergence parameter.
the simplest, is just the sum of suspicion scores of the related entities; the second model already introduces intrinsic and relational attributes of entities as factors; the third model sort of averages the previous two using vertex degree and Laplace smoothing, after some normalizations. After knowing each participant suspicion score, other entities such as collisions and vehicles can be assessed using one of the previous models. In figure 2.2 it can be seen what would be the final module of the system, a visualization framework to facilitate experts to analyse the case.
Figure 2.2: Four COPTA networks showing same group of collisions. Size of the participants’ vertices correspond to their suspicion score; only participants with score above some threshold, and connecting collisions, are shown on each network. The contour was drawn based on the harmonic mean distance to
every vertex, weighted by the suspicion scores. (Blue) filled collisions’ vertices in the first network correspond to collisions that happened at night. (Figure used with author’s authorization)
The novel algorithm is evaluated on real world data, automatically retrieved from police records, resulting on a data set of 211 participants and 91 collisions. The best performance is achieved with the AMmean
bas , resulting in an average AUC (Area Under Curve) of 0.9228. The method AMmeanraw also exceed in performance other well known centrality measures as betweenness, closeness, dis-tance and eigenvector centrality. The authors also compared the algorithm with Naive Bayes, suport vector machines, random forest and k-nn (best performance up to AUC≈0.86).
Subelj et al. finally concludes that the results presented before suggest that appropriate data rep-resentation is fundamental, and that their method obtained strong results with high recall (im-portant for fraud detection purposes). Furthermore they state that domain knowledge can be incorporated in the system and that it improves performance. They also note that running the IAA for too many iterations over-fits the model.
2.2.4.2 Chen, H. et al. method
Chen et al. [CCX+04] propose a general framework for crime data mining, grounded by the expe-rience of a jointly project developed with police departments of USA, the Coplink project. They begin to classify crimes in different categories, and then identify the main data mining techniques used for fraud detection and its major applications on crime detection: entity extraction to auto-matically identify person, addresses, and other information from police reports; clustering tech-niques to identify individuals who committed identical crimes; link analysis to identify identical transactions and uncover money laundering schemes; association rule mining to reveal patterns on intrusion attacks for instances for later protection systems; outlier detection to spot intrusion attacks online; classification to decide whether an email is spam, or to predict crimes; string com-parator techniques to match similar police records; and social network analysis to reveal gangs and other criminal substructures, also with visualization abilities.
They based their study on a dataset consisting on 1.3 million police records of suspect and crimi-nal. The authors claim that some types of techniques are more suitable for a specific type of crime than others. They place the 4 major classes by increasing order of analysis capability, and relate them with crimes categories: entity extraction, association, prediction and pattern visualization techniques. Also, they organize types of crimes in increasing public harm: traffic violations, sex crime, theft, fraud, arson, gang/drug offences, violent crime and cybercrime. In this sense, they place social network analysis as a facilitator technique for crime association and pattern visual-ization.
To give an example, Chen et al. describe three cases on a Coplink case study, named-entity ex-traction, deceptive-identification and criminal-network analysis. For the scope of this thesis, we will stick with the latter one. Their task was to identify subgroups and key elements on criminal networks built upon 272 incident summaries involving 164 committed crimes. A concept-space approach helped to extract criminal relations, weighted by a co-occurrence perspective, that is, how frequently a given pair of criminals were cited in the same incident record. They used hi-erarchical clustering techniques to identify connected components and then block-modelling ap-proach to analyse relations among them. To identify key actors on those subgraphs, centrality measures such as degree, betweenness and closeness were applied.
From this analysis, there were identified 16 target gang members and cross-validate the results with experts from the police department, who confirmed the results. Not only the criminal gangs corresponded to the subgroups identified, but also most of the key members were in fact leaders of the known gangs. They further discuss the drawback of their framework of generating static networks, the possibility to have a symbiotic interaction of techniques to increase performance and the challenges of the field.
2.2.4.3 Chiu et al. method
Chiu et al. [CKLC11] focus on internet auction fraud and present a hybrid system using both social network analysis and other data mining techniques.
They begin to build an Internet auction transaction network, based on the relation Seller -> Buyer, giving a hierarchical perspective to the auction transaction. A seed account is selected from the blacklist provided by the Yahoo! auction website. Having this, the algorithm searches for all account buyers of the seed, and then drill down another level in the same way, ending up with a hierarchical view of this 3-level transaction (the seed, the seed’s buyers, and the buyers of the seed’s buyers).
A previous experiment studied regular patterns of honest transactions, and suggested that their behaviour is like "one to many" and "many to one", that is, one seller sells to many buyers, and one buyer buys to many sellers. This means that behaviours that resemble repetitive closed loops transactions might indicate fraudulent activities. Actually, the 2-core indicator applied to these kinds of networks have been successfully to filter suspicious activities on Internet auction trans-actions [Sun09]. Having this done, the authors can spot the subgraphs of the entire network that might represent auction fraud.
Several SNA metrics are applied to the networks to assess its characteristics, before being pruned by the 2-core technique. Such metrics, like degree, nbetweenness (normalized betweenness), core (e.g. 2-core means that each node has at least 2 edges to other nodes), plex (e.g. k-plex_k=2_size=5 means that there are 5 nodes and each one is related to at least 5-2=3 other nodes) and n-cliques (e.g. n-cliques_k=1_size=3 means that there are 3 nodes at the distance 1 of each other) are used to assess networks’ indicators and create a vector of binary values for each