Marketing Budget Optimisation: Key Metrics and Trends,
According to Specialists
João Pedro Henriques Magalhães
Dissertation submitted as partial requirement for the conferral of Master in Marketing
Supervisor:
Prof. José Pedro da Cunha Catalão Dionísio, Associate Professor, ISCTE Business School, Department of Marketing, Operations and General Management
Ma
rk
eti
n
g
B
u
d
g
et
Opt
im
is
ati
o
n
: Ke
y
Me
tr
ics a
n
d
T
ren
d
s,
A
cc
o
rd
in
g
t
o
S
p
ec
ialis
ts
J
o
ã
o
P
edro
H
enr
iqu
es
M
a
g
a
lh
ã
es
ii
Acknowledgments
To my supervisor, professor Pedro Dionísio, for the chance to partake in this project. Your guidance and knowledge were invaluable to the conclusion of this year-long undertaking. And to all the specialists that participated in the Real-Time Delphi study, for your insights and availability. This dissertation would not exist without your efforts and know-how.
To my parents, for their sacrifices so I could have the education I desired. Their incessant inquiries regarding the state of this dissertation, annoying as they might have been, were always a push in the right direction. And to my grandparents, for always desiring only the best for their grandson.
Finally, to all my friends who were there when I wanted to forget this had to be done, and to my colleagues who shared the pain when it had to be done. And last, but certainly not least, to Lisandra, for her unrelenting patience and care, every step of the way.
iii
Abstract
The importance of marketing budget optimisation is undeniably growing. A survey by Gartner showed that marketing budgets increased to 12% of company revenue in 2016, from 11% in 2015 (Marketing Weekly News, 2016). Not only are marketing budgets increasing, but advancements in data collection and analytics deliver firms a whole new array of marketing information to interpret, opening new possibilities to marketing budget optimisation.
However, despite the growth in investment, most of the existing literature regarding the subject is still debating concepts and definitions (Gao, 2010), reducing its utility to managers that seek streamlined and practical information to apply to their companies. This leads to the objective of this dissertation, which is to gather and analyse the opinions of marketing specialists regarding key metrics and trends related to marketing budget optimisation, according to the type of company.
Through a Real-Time Delphi methodology used to gather the opinions of specialists on the matter, this dissertation came to several interesting conclusions. The main conclusion is that the topic of marketing budget optimisation is non-consensual, due to its complexity and scope. This means that the type of company alone was not enough to reach a consensual conclusion among specialists, as other criteria such as the market that the company operates in, its competition, product lifecycle, and objectives are also considered crucial.
Despite these shortcomings, several key metrics were identified according to the chosen types of company, and trends were identified in marketing budget optimisation such as programmatic marketing, earned media, and marketing automation.
Keywords: Marketing Budget Optimisation, Real-Time Delphi, Marketing Metrics, Marketing
Trends
iv
Resumo
A importância da otimização do orçamento de marketing está indubitavelmente a crescer. Um estudo da Gartner mostrou que os orçamentos de marketing aumentaram de 11% das receitas das empresas em 2015, para 12% em 2016 (Marketing Weekly News, 2016). A juntar a isto, os avanços na recolha de dados dão às empresas todo um novo conjunto de informação, abrindo as portas à otimização do orçamento de marketing.
Contudo, apesar do crescimento em investimento, a literatura atual ainda debate conceitos e definições (Gao, 2010), reduzindo a sua utilidade para os gestores que procuram informação mais prática para aplicarem nas suas empresas. Isto leva-nos ao objetivo desta dissertação, recolher e analisar as opiniões dos especialistas de marketing relativamente às métricas e tendências da otimização do orçamento de marketing de acordo com o tipo de empresa.
Através de uma metodologia Real-Time Delphi para recolher as opiniões dos especialistas, esta dissertação chegou a várias conclusões interessantes. A principal conclusão é que o tema é não-consensual, devido à sua complexidade e extensão. O tipo de empresa não foi suficiente para chegar a uma conclusão consensual entre os especialistas, pois outros critérios como o mercado, competição, ciclo de vida do produto e objetivos também foram considerados cruciais.
De qualquer modo, várias métricas-chave foram identificadas de acordo com o tipo de empresa escolhido e identificaram-se tendências na otimização do orçamento de marketing como o marketing programático, earned media e automação do marketing.
Palavras-Chave: Otimização do Orçamento de Marketing, Real-Time Delphi, Métricas do
Marketing, Tendências do Marketing
v
Index
1. Introduction ... 1
1.1. Actuality and Trends of the Marketing Budget ... 1
1.2. Research Problem and Objectives ... 2
1.3. Structure ... 3
2. Literature Review... 4
2.1. Definition and Evolution of Marketing Budget Optimisation ... 4
2.1.1. Definition of Budget ... 4
2.1.2. Definition of Marketing Budget ... 5
2.1.3. Definition of Marketing Budget Optimisation ... 5
2.1.4. Historical Forms of the Marketing Budget ... 6
2.2. Marketing Metrics ... 6
2.2.1. Definition of Metric and the Role of Marketing Metrics ... 6
2.2.2. Key Marketing Metrics ... 7
2.3. Models of Optimisation ... 9
2.3.1. Mathematical Models of Marketing Budget Optimisation ... 10
2.3.2. Programmatic Marketing and Attribution Modelling ... 11
2.3.3. The Customer Journey ... 12
2.3.4. The Sales Funnel ... 18
3. Methodology ... 21
3.1. Exploratory Interviews ... 21
3.2. Research Questions ... 22
3.3. Delphi Method... 23
3.4. Real-Time Delphi Method ... 24
3.5. Research Platform “eDelphi” ... 25
vi
4. Analysis of Results ... 28
4.1. Relationship between marketing budget optimisation and the type of company ... 28
4.2. Relationship between metrics for marketing budget optimisation and the type of company ... 30
4.3. Relationship between the focus of marketing budget optimisation and the type of company ... 38
4.4. Non-controlled communication of companies and its challenges for marketing budget optimisation ... 43
4.5. Contribution of new technologies to marketing budget optimisation ... 46
5. Conclusion ... 48
5.1. Summary of Results ... 48
5.2. Theoretical Implications ... 50
5.3. Managerial Implications ... 50
5.4. Research Limitations ... 52
5.5. Suggestions for Future Research ... 52
6. References ... 53
7. Annexes... 57
Annex 1: Key Marketing Metrics Developed ... 57
Metrics According to Sales Objectives ... 57
Metrics According to Rentability Objectives ... 59
Metrics According to Product, Price, and Distribution Objectives ... 61
Metrics According to Offline Communication Objectives ... 63
Metrics According to Online Communication Objectives ... 64
Annex 2: Questionnaire as seen on the eDelphi platform ... 67
vii
Figure Index
Figure 1: A dynamic, expanded consumer decision journey by Batra and Keller (2016). ... 14 Figure 2: The sales funnel by Bendle et al. (2017). ... 19 Figure 3: Example of a question, as seen by the respondent, in the eDelphi platform. ... 26 Figure 4: The best practices of marketing budget optimisation are related with the type of company. ... 29 Figure 5: The metrics presented in question 2 are the most adequate for digital B2C start-ups. ... 31 Figure 6: The metrics presented in question 4 are the most adequate for digital other companies with digital sales. ... 32 Figure 7: The metrics presented in question 6 are the most adequate for companies with a well-defined sales cycle. ... 34 Figure 8: The metrics presented in question 8 are the most adequate for traditional companies. ... 35 Figure 9: The different social networks will converge in the time of 5 years to the utilisation of the same type of metrics. ... 36 Figure 10: For B2C digital start-ups, one should act on the different touchpoints of the customer journey to maximise shares/recommendations. ... 38 Figure 11: In the case of companies with digital sales, marketing budget optimisation is mostly about process improvement, to improve customer capture, experience and loyalty. ... 40 Figure 12: Tools such as HubSpot are the future of marketing optimisation in firms with a well-defined sales cycle. ... 41 Figure 13: Offline and online compatibilization is the solution of marketing budget optimisation for traditional companies. ... 42 Figure 14: Non-controlled communication by companies creates new challenges for marketing measurement. ... 44 Figure 15: The probability of this reality of earned media growing over the next 5 years, creating new challenges for brands. ... 45 Figure 16: New technologies such as programmatic marketing, will tend to be used by most brands in the next 5 years... 47 Figure 17: Example of an online newspaper visitor by Bendle et al. (2017). ... 64 Figure 18: Example of the order acquisition process by Bendle et al. (2017). ... 65
viii
Table Index
Table 1: Metrics according to sales objectives. ... 8
Table 2: Metrics according to rentability objectives. ... 8
Table 3: Metrics according to product, price, and distribution objectives... 8
Table 4: Metrics according to offline communication. ... 9
Table 5: Metrics according to online communication objectives. ... 9
Table 6: Comparison between customer journeys and consumer decision-marking models by Wolny and Charoensuksai (2014). ... 12
Table 7: Channel usage at different buying stages in cosmetics shopping by Wolny and Charoensuksai (2014). ... 13
1
1. Introduction
Before the analysis of concepts through the review of existing literature, a brief contextualisation of the topic of this dissertation is crucial to its understanding. This introduction begins, therefore, with an analysis of the current environment surrounding the marketing budget and its trends, followed by a statement of proposed objectives for this dissertation and an explanation of its structure.
1.1. Actuality and Trends of the Marketing Budget
Marketing budgets are growing in importance and, consequently, in investment. A survey by Gartner that included responses from 377 marketers, from companies with over $250 million in annual revenues in the United States and the United Kingdom, showed that marketing budgets increased to 12% of company revenue in 2016, from 11% in 2015 (Marketing Weekly News, 2016).
The top three categories of marketing spending in 2016 identified in Gartner’s survey were web, digital commerce and digital advertising – illustrating how critical digital marketing has become. Technology has changed the location of media consumption through reductions in production costs, improved targeting, personalisation, and accountability. This affected the marketing budget, which gravitates to where its audience is (James, 2016).
Offline advertising budgets are making way for e-mail and other digital marketing channels. StrongView’s annual marketing survey of 2015, with 400 responses from leaders at global brands, found that 54% of brands intended to increase their investment in e-mail marketing, versus 46% in 2014 (Business Wire, 2014). Target Marketing’s “2015 Media Usage Survey” noted that search engine marketing (SEM) and search engine optimisation (SEO) continue to be high priorities in media spending. 61% of respondents planned to increase their social media investments in 2015 and 45% of these respondents also planned to increase their investment in mobile marketing. (McGuee & Zimmerman, 2015).
The nature of marketing has shifted towards multichannel, cross media marketing. Marketers not only have to consider the traditional platforms of communications such as TV, radio and print, but also the recent rising mediums such as online platforms and mobile. Advances in data collection and analytics may allow firms access to a whole new level of information but add more time and resource requirements to the marketing management process. Firms are spending more on their marketing budgets and changing how they spend it,
2
but the overabundance of mediums and available information raises problems in an almost equal measure of opportunities, making an efficient marketing budget a necessity.
1.2. Research Problem and Objectives
The subject of marketing budget optimisation is quite ample. One cannot deny the relevance of the topic nowadays, as researchers have stated that the inability of marketing to demonstrate its contribution to firm performance has weakened its standing with firms (Ambler & Roberts, 2008; O'Sullivan & Abela, 2007; Stewart, 2008). As such, marketing performance has been regularly studied, as seen in Gao’s (2010) “Measuring Marketing Performance: A Review and A Framework” which compiles and assesses several researches related to the topic of marketing performance.
However, while the subject of marketing performance is deep in empirical literature, most managers are unaware of what frameworks are on top of the marketing performance and budget optimisation discussion by the academia. There is a gap between what academics focus on researching and what managers actually implement in their businesses, as most researchers are still trying to achieve a consensus regarding definitions related to marketing performance (Gao, 2010) and not as focused on the practical necessities of a manager. There have been some mathematical approaches to optimisation that have been mostly directed to firms’ marketing managers, as it will be shown Chapter 2.3.1. Mathematical Models of Optimisation, but these are oftentimes too complicated to implement.
The research problem is, therefore, the lack of practical information from a managerial standpoint on how to set and allocate a marketing budget for specific company types, when considering that many managers still often rely on trial-and-error to define their budget. This problem leads to the main objective of this dissertation, which is to gather and analyse the opinions of marketing specialists regarding key metrics and trends related to marketing budget optimisation, using the language and tools that managers understand and, consequently, use. More succinctly, this dissertation proposes to:
• Understand how companies examine their marketing spending and return on investment using metrics;
• Gather the insight of marketing experts regarding the trends of marketing budget optimisation, and their opinion on the future of the subject.
3
1.3. Structure
This dissertation is divided into five chapters, which compose its main body, followed by three annexes.
Following the first chapter, in which this structure is inserted, the second chapter expands the theoretical basis of the dissertation through a literature review. Topics such as marketing budget optimisation, marketing metrics, and models of optimisation are analysed and summarised according to their relevance to the achievement of the previously stated objectives. The third chapter, which contains the methodology, offers a contextualisation of how the utilised research tool was chosen, as well as its questionnaire came to be, using existing literature and exploratory interviews with marketing specialists.
The fourth chapter assembles an analysis of the results that were gathered through the utilised research tool. The analysis is done by studying each question that composes the questionnaire, according to their respective topic of marketing budget optimisation.
Finally, the fifth and final chapter of the main body, the conclusion, is done by recapping the obtained results, stating its academical and managerial implications, and explaining the consequential research limitations and suggestions for future research.
4
2. Literature Review
On this stage of the dissertation, a review of the existing literature will be done to develop the most relevant subjects. These are: definition of budget, marketing budget, and marketing budget optimisation; a brief historical contextualisation of the marketing budget and the differences to today’s budgets; analysis of marketing metrics as a fundamental instrument in the evaluation of the company’s performance and objectives; review of the relevant mathematical models of marketing budget optimisation; and finally, an analysis of the sales funnel and the customer journey as tools of marketing.
2.1. Definition and Evolution of Marketing Budget Optimisation
In the first chapter of the literature review, the core definitions surrounding marketing budget optimisation will be established. Under the existing literature, the following will be analysed: the definition of budget (as a general term), the definition of marketing budget, and the definition of marketing budget optimisation. Finally, which elements have composed the marketing budget throughout the years will be briefly determined.
2.1.1. Definition of Budget
A budget is a detailed plan outlining the acquisition and use of financial and other resources over some given time period (Abratt et al., 1994). It moves the organization from an informal reaction method of management to a formal controlled method of management (Morse et al., 1984) and can also act as a motivator and communicator, as well as for functional coordination and performance evaluation (Dominiak and Louderback, 1988; Wolk et al., 1988).
According to Anthony et al. (1992) there are four uses of a budget. First, to fine tune the strategic plan; second, to help coordinate the activities of the several parts of the organization; third, to assign responsibilities to managers; and finally, to obtain commitment that is a basis for evaluating a manager’s actual performance.
Garrison (1988) enumerates four major advantages of budgeting. First, it gives planning top priority; second, it provides managers with a way to finalise their planning efforts; third, it overcomes potential bottlenecks before they occur; and last, it coordinates the activities of the entire organization by integrating the plans and objectives of the various parts.
5
2.1.2. Definition of Marketing Budget
Kluyver and Pessemier (1986) claim that marketing budgets are prepared for two principal purposes: planning and control; and its principal purpose is to facilitate the implementation of the marketing strategy.
The authors further develop the concept by stating that it serves to harmonize the company’s strategy with its organization, management and personnel, and with the tasks that need to be performed to implement a chosen strategy. The budgeting process forms a bridge between the formulation of marketing strategy and its implementation, by providing a coherent set of period-oriented operational guidelines for action. The expected result of the marketing budget is to get as much return on investment as possible from the marketing plan (Caragher, 2007).
Nowadays, one of the most important areas of marketing is setting and allocation of marketing budgets. The aim of budget setting is to find the optimal budget that should be assigned to all activities and the aim of budget allocation, the process that follows budget setting, is to determine the best allocation of budgets to these activities (Koosha and Albadvi, 2015). Proper allocation of the marketing budget can avoid the waste of resources and lead to a more efficient budgeting operation (Huang, 2012), as firms are looking for optimal allocation of marketing resources to customer segments, in order to maximise total profits (Albadvi and Koosha, 2011).
2.1.3. Definition of Marketing Budget Optimisation
According to Ratner (2004), optimisation is central to the decision-making process in business and involves selecting the best condition, or most favourable, within a given environment. In mathematic terms, he claims that to distinguish among available choices, an objective function must be determined. The choice that corresponds to the extreme value of the objective function is the best alternative and therefore, the solution to the problem. Perret’s (2007) approach to the definition is also mathematical, as stated that it “(…) operates by optimising a target variable given a range of constraints” since in most firms, the item to be optimised will be some kind of value measure.
Marketing budget optimisation is, therefore, the process of setting and allocating the optimal marketing budget which will provide the best value for money and should, theoretically, deliver an optimal return on investment.
6
2.1.4. Historical Forms of the Marketing Budget
When looking at the elements that comprised a marketing budget at the turn of the millennium, compared to the present, a drastic change in communication channels is clearly noticeable. Batra and Keller (2016) say that previously, marketers had a small array of communication modalities at their disposal to try to accomplish their brand communication objectives. They could use television ads, radio and outdoor ads, print ads; they could focus on public relations, offer coupons and use newsletters and catalogues.
The authors continue their comparison by stating that today, in addition to those traditional channels, a brand can reach “(…) a large number of consumers through mass or targeted Facebook ads, banner or display ads on thousands of websites, or paid and organic search ads. It can use its own website, third party websites, and bloggers to provide persuasive content to create brand preference; offer short-term promotions through tweets and targeted e-coupons; and create online brand communities through its own and social media-type web properties”. Available media-usage data by the second allow for micro and dynamic segmentation, and targeting, as consumers are no longer passively receiving brand information but are, instead, actively seek it when needed through search engines, mobile browsers, blogs and websites.
The costumer’s journey to a purchase is also quite different today due these advancements in technology as it is often shorter in length, less hierarchical, and more complex (Court et al. 2009).
2.2. Marketing Metrics
In the second point of the literature review, a review of the key marketing metrics and their importance to the performance of marketing budget optimisation will be done. First, the definition of metric and marketing metrics will be established, as well as their role in organisations. Finally, a compilation of the most important marketing metrics to the objectives of this dissertation will be done to facilitate the comprehension of the research tool and consequential conclusions.
2.2.1. Definition of Metric and the Role of Marketing Metrics
According to Bendle’s et al. (2017) in Key Marketing Metrics, “A metric is a measuring system that qualifies a trend, dynamic or characteristic. (…) in virtually all disciplines, practitioners use metrics to explain phenomena, diagnose causes, share findings and project the results of future events.” When putting the definition into practical terms, they state that in the worlds of
7
science, business and government, metrics encourage rigour and objectivity, make it possible to compare observations across regions and time periods, and facilitate understanding and collaboration.
Kerzner (2011) describes the metric as a numerical measure which represents a segment of business data in a specific area – a measurable indicator to improve quality level, quantity or financial categories. Ambler (2000) defends that ‘metric’ is a performance measure that matters to the whole business and should be necessary, precise, consistent and sufficient (i.e. comprehensive) for review purposes.
In the context of management, Bendle et al. (2017) state that metrics allow managers to quantify market opportunities and competitive threats, justify the risks and financial returns of their decisions, evaluate plans and performance and identify which where improvements can be made. In the context of marketing, marketers should be able to quantify the addressable markets through the value of products, customers and distribution channels. They must also measure new opportunities and the required investment to realise them.
Finally, the Marketing Science Institute (2004) defines marketing metrics, specifically, as “(…) the performance indicators top management use (or should use) to track and assess the progress – specifically the marketing performance – of a business or business unit.”
2.2.2. Key Marketing Metrics
Using Bendle’s et al. (2017) Key Marketing Metrics¸ a compilation of the key marketing metrics that serve the objectives of this dissertation is done in this chapter. Their definitions and corresponding formulas are developed on Annex 1: Key Marketing Metrics Developed and are divided according to their relationship with Sales Objectives, Rentability Objectives and Marketing Mix Objectives.
According to Sales Objectives: Sales objectives allow a competitivity analysis, brand and
category evaluation, and the measuring of the dedication and use of new and existing customers. In table 1, the corresponding metrics were divided into three objectives: growth of sales, growth of sales within existing customers and growth of the number of customers.
8
Table 1: Metrics according to sales objectives.
Growth of Sales Growth of Sales within Existing Customers
Growth of the Number of Clients
Unit market share Share of wallet Penetration Revenue market share Heavy usage index
Relative market share Market concentration Brand development index
(BDI)
Category development index (CDI)
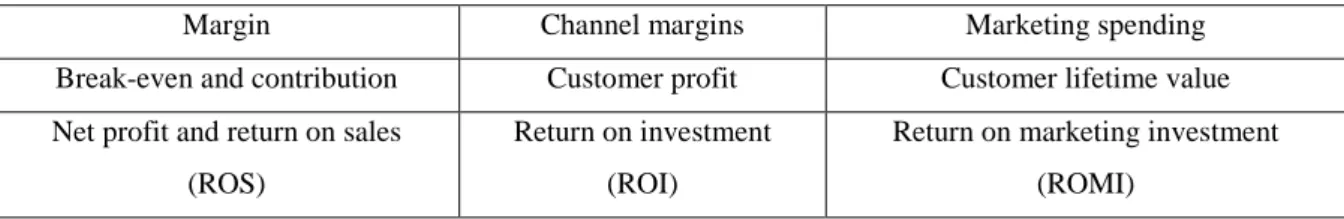
According to Rentability Objectives: Rentability objectives are related with margins and
return on investment. These are presented in table 2.
Table 2: Metrics according to rentability objectives.
Margin Channel margins Marketing spending Break-even and contribution Customer profit Customer lifetime value Net profit and return on sales
(ROS)
Return on investment (ROI)
Return on marketing investment (ROMI)
According to Product, Price, and Distribution Objectives: Metrics that evaluate these
elements grant a deeper understanding of the marketing mix, going from product performance whether for new and for existing products, to pricing strategies, and the effectiveness of distribution. The metrics composing these elements of the marketing mix are seen in table 3.
Table 3: Metrics according to product, price, and distribution objectives.
Product Price Distribution
Trial rate Average price per unit and price per statistical
unit Numeric distribution Repeat rate Price premium Weighted
distribution Penetration
Projection of sales Growth rate: percentage and
9
According to Offline Communication Objectives: Going further into the marketing mix,
promotion was divided into two parts: offline and online communication. Through metrics for offline communication it is possible to understand how many individuals are exposed to a campaign, the frequency of exposure to the promotion, and the cost of impressions. These are presented in table 4.
Table 4: Metrics according to offline communication.
Impressions Gross rating points (GRPs) Cost per thousand impressions (CPM) Share of voice
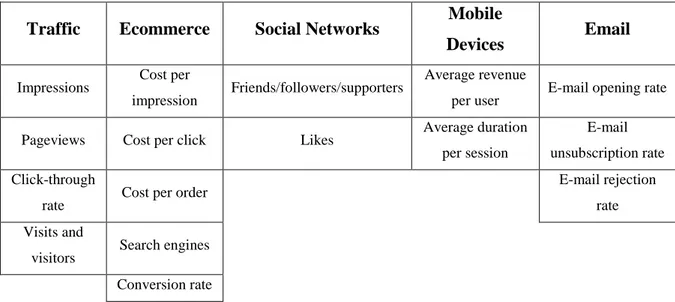
According to Online Communication Objectives: Finally, with the rise of the internet,
metrics according to offline communication have transformed to fulfil the purposes of online communication. The metrics in this section are divided into five parts: traffic, e-commerce, social networks, mobile devices and e-mail, as can be seen in table 5.
Table 5: Metrics according to online communication objectives.
Traffic Ecommerce Social Networks Mobile
Devices Email
Impressions Cost per
impression Friends/followers/supporters
Average revenue
per user E-mail opening rate Pageviews Cost per click Likes Average duration
per session
E-mail unsubscription rate Click-through
rate Cost per order
E-mail rejection rate Visits and
visitors Search engines Conversion rate
2.3. Models of Optimisation
In the final section of the literature review, several models of optimisation will be analysed regarding their purpose in marketing. The first part, mathematical models of optimisation, will look at the models that were specifically developed, as their name implies, to optimise the marketing budget. Programmatic marketing will also be given a focus as an increasingly popular tool in digital marketing, regarding its performance and budget optimisation.
10
Afterwards, the focus will shift to widespread models of marketing that serve a greater number of uses in the discipline, with marketing budget optimisation being one of them. These are: the customer journey and, finally, the sales funnel.
2.3.1. Mathematical Models of Marketing Budget Optimisation
In 1986, Kluyver and Pessemier stated that a marketing budget “… requires that a complete strategy statement is available before an effective budget can be drawn up”. Great importance was given to the development of a good strategy statement by listing four minimums: first, clear marketing objectives; second, a description of the market segments served and the company’s desired positioning within each of these segments; third, a broad outline of a marketing program describing basic decisions on the various elements of the marketing mix; and finally, a five-year pro-forma statement.
The relationship between strategy and marketing budget triggered the birth of model-based approaches to marketing budget optimisation. Chakravarti et al. (1981) noted that “While model-based approaches have great potential for improving decision making in these situations, it is also difficult to construct and operationalize valid models of these environments. The models tend to be either too simple so they are not valid representations of the real world or so complex that the manager does not understand the models and, consequently, does not use them”. These problems are still relevant in the modern business environment, with managers opting for simple rules of thumb for their marketing budgets such as “percentage-of-sales”, “objective-and-task” and “affordability” methods instead of more complicated modelling solutions (Fischer et al., 2012).
Despite the avoidance of complicated solutions by managers, mathematical optimisation models have been developed throughout the years in an attempt to make marketing budget decisions fact based, rather than intuitive. Ratner (2004) used the machine learning method of neural networks as a form of optimisation to develop the GenIQ Model, which consists of the recombination of several models using their relevant parts for the solution of the optimisation problem. Perret (2007) demonstrates the impact of different propensity models within a service business to improve the performance of direct marketing, by providing evidence of significant performance gains without any change to the business process. Albadvi and Koosha (2011) used a mathematical programming model which employs customer equity as an objective function to allocate marketing budgets, proving their approach to be more reliable in uncertain situations than deterministic models. Rowson et al. (2012) attempted a solution to the budget
11
allocation problem using a decision support system that they developed using integer linear program techniques. Fischer et al. (2012), using an excel-based decision support model, determine optimal marketing budgets for multi-product, multi-country firms and proved its reliability with a successful implementation at Bayer, one of the world’s largest pharmaceuticals.
These solutions were proved to be effective, with positive results in their respective case-studies, but the previously mentioned problem is still prevalent: they are too complicated for an inexperienced user which throws most managers away from implementing them in their optimisation efforts.
2.3.2. Programmatic Marketing and Attribution Modelling
“Programmatic marketing is automated bidding on advertising inventory in real-time, for the opportunity to show an ad to a specific costumer, in a specific context” (Allen, 2016). In simpler terms, when a person clicks on a webpage that has an advertising space configured for programmatic advertising, the publisher of the page runs an auction among advertisers that are interested in displaying their ad. The advertiser that is willing to bid the most for its ad to be displayed, wins the auction and the ad is placed on the page. Since the process is automated and the maximum price to bid as already been established by the advertisers, the auction is completed in the milliseconds that it takes the page to load.
Busch (2016) defines programmatic marketing as a more intensive use of data, technology and artificial intelligence with the common goal of boosting marketing efficiency in real time. The author further expands that the growth of programmatic marketing means that the user becomes more important: instead of individual campaigns, continuous and targeted marketing programs are becoming increasingly popular.
According to the monography by Sharma (2016), “Attribution modelling is the process of understanding and assigning credit to marketing channels which eventually lead to conversions (goal conversions and/or e-commerce transactions). These marketing channels are primarily digital marketing channels (e.g. paid search, organic search, e-mail marketing, direct traffic, referral traffic, display advertising, etc.) but can also include offline touchpoints (e.g. store visits, phone calls, etc.).”
He defends that the appeal lies on understanding and finding the optimal mix of digital marketing channels by using attribution models to measure and understand the impact of digital marketing touchpoints in a conversion path; without forgetting that no marketing activity
12
should be purely online, nor offline, since customers often go back and forth between the two depending on the stage on their purchase path, the type of product, the value of the purchase or their familiarity with technology. Attribution modelling does not require an advanced understanding of statistics but requires a deep understanding of Google Analytics and its intricacies. Despite being easier to understand than previously mentioned complex mathematical models, managers that wish to apply it still must dedicate time to fully understand the modelling process.
2.3.3. The Customer Journey
According to Clark (2013), a customer journey can be defined as a “(…) description of customer experience where different touchpoints characterise customers’ interactions with a brand, product, or service of interest.” Due to the multiplicity of touchpoints, physical and digital, the customer journey model increased its diffusion considerably throughout organizations worldwide, as can be seen by the multiple conferences and seminars that are held every year.
The customer journey originated from the widely known consumer buying process model by Engel et al. (1978), which consists of five stages that the consumer is expected to go through the buying process: need recognition; information searches; alternative evaluation; purchase; post-purchase. The main differences between customer journeys and decision-making models such as Engel’s is explained by Wolny and Charoensuksai (2014) in table 6:
Table 6: Comparison between customer journeys and consumer decision-marking models by
Wolny and Charoensuksai (2014).
Customer Journeys Decision-Making Models
Involve every touchpoint and channel customers engage with in a shopping journey.
Hierarchical stages customers go through to reach a purchase decision.
Non-linear structure. Linear structure.
Reflect cognitive, emotional, and behavioural drives.
Reflect cognitive drives.
Wolny and Charoensuksai (2014) also developed their own customer journey model (table 7), in which they describe the observed stages of the journey and pinpoint the channel usage in
13
each of them, to exemplify the flexibility of a journey compared to a decision-making model and bring it up to date with the recent media and distribution channels.
Table 7: Channel usage at different buying stages in cosmetics shopping by Wolny and
Charoensuksai (2014).
Observed stages Description Primary channel used
Orientation/ inspiration/ horizon scanning
At this stage, consumers do not think of themselves as shopping. They are consciously or unconsciously scanning the marketplace and referring to their own previous experience.
Friends, bloggers, product reviews, videos, magazines, product display (in-store and online), prior experience. Information
search
Consumers have intention to shop and search for information prior to shopping. They try to get directed information from product reviews, rating and swatches.
Blogs, videos, review sites and friends.
Evaluation Consumers narrow down the choice of purchase and search more information on price, physical attributes, availability and purchase channels. Trying product in-store and browsing product online are widely reported at this stage.
Physical store, online store, mobile channel, as well as friends, social media for confirmation.
Purchase At this stage, consumers make a decision regarding final purchase. Physical store was the most preferred point of purchase for cosmetics, followed by online store.
Physical store or online store.
Post-purchase Consumers tend to share their shopping experience through word of mouth (WOM).
Friends and/or social media.
It should be noted that the channels being used in these, more recent approaches, consist of a mix of media types – no longer are the channels completely owned or bought by companies, as marketers are forced to recognise the power that lies beyond what is considered “traditional paid media”. Paid media includes traditional advertising, as the company pays for a space or for a third party to promote its products, such as television commercials, magazine and
14
newspaper ads, and search engine marketing. Owned media consists of properties or channels that the company owns and uses for marketing purposes, such as catalogues, websites and retail stores. Finally, and not less important in the customer journey, is earned media. This type of media is generated when the “(…) quality or uniqueness of a company’s products and content compel consumers to promote the company at no cost to itself through external or their own [social] media” (Edelman and Salsberg, 2010).
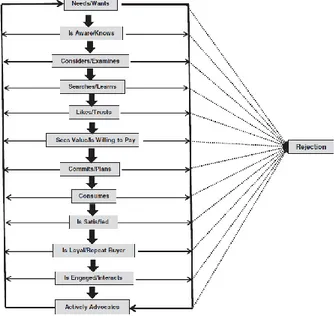
Batra and Keller (2016) developed a similar approach to the optimisation of media channels according to the purchase stages. They began by studying the work of researchers from McKinsey & Company (Court et al. 2009) who developed their own “consumer decision journey circle” in which consumers begin by “(…) considering a preliminary set of brands to form an initial consideration set, modify this consideration set (often adding more brands) as they gather and evaluate more brand information, select a brand (at the moment of purchase), and then utilise their post-purchase experiences to shape their next decision”.
From this model, Batra and Keller (2016) note that while consumers interact with many more media types, and do so in more nonlinear and circular ways, they still go through a sequence of stages, as seen in figure 1. This study showed that brand owners have, nowadays, a much bigger challenge of allocating budgets and managing time across a wider range of touchpoints that occur in the customer decision journey. These broader touchpoints also go beyond brand advertising, which is generally referred to as “paid media” (or “owned media” where the firm does not have to pay directly), to include “earned media” such as editorial coverage and word of mouth (Stephen and Galak, 2012).
15
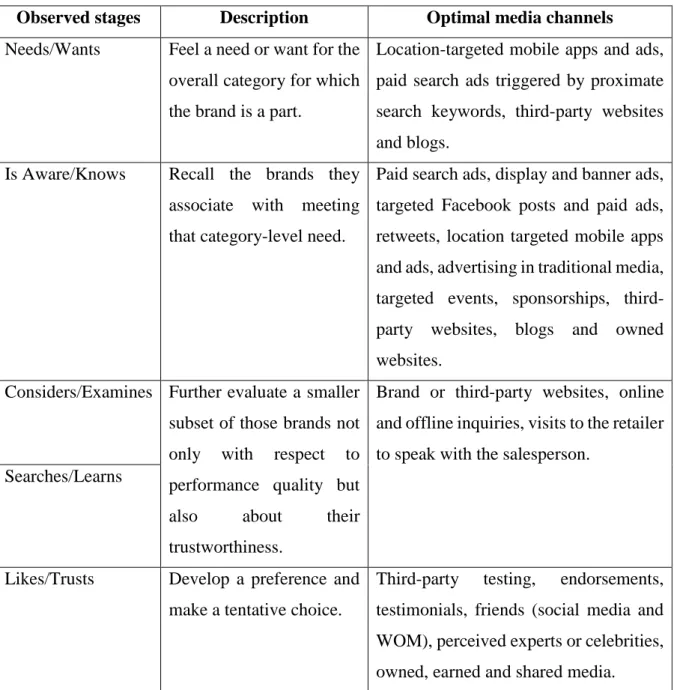
The authors defend that “Each of these steps puts the consumer in a particular information-processing state of mind, which makes any one media type more or less appropriate for deployment by the brand to satisfy that consumer’s information needs and ensure movement to the next stage”. The tendency is to move away from linear, decision-making models and use non-linear customer journeys that follow the costumer’s cognitive, emotional and behavioural drives and allow managers to apply integrated marketing communications to stimulate the buying process. Finally, the model named “Bottom-Up” (table 8), is the culmination of their analysis, in which they take their previously developed stages and assign the best media channels for it.
Table 8: “Bottom-Up” model by Batra and Keller (2016).
Observed stages Description Optimal media channels
Needs/Wants Feel a need or want for the overall category for which the brand is a part.
Location-targeted mobile apps and ads, paid search ads triggered by proximate search keywords, third-party websites and blogs.
Is Aware/Knows Recall the brands they associate with meeting that category-level need.
Paid search ads, display and banner ads, targeted Facebook posts and paid ads, retweets, location targeted mobile apps and ads, advertising in traditional media, targeted events, sponsorships, third-party websites, blogs and owned websites.
Considers/Examines Further evaluate a smaller subset of those brands not only with respect to performance quality but also about their trustworthiness.
Brand or third-party websites, online and offline inquiries, visits to the retailer to speak with the salesperson.
Searches/Learns
Likes/Trusts Develop a preference and make a tentative choice.
Third-party testing, endorsements, testimonials, friends (social media and WOM), perceived experts or celebrities, owned, earned and shared media.
16
Sees Value/Is Willing to Pay
Decide how much they are willing to pay for the preferred brand.
TV ads, prestigious events, celebrities, YouTube brand videos, Facebook.
Commits/Plans Take the action step of trial or purchase.
Paid media, owned media and/or earned media, trade partners, co-op advertising and linked-to-retailers’ websites. Consumes Form an assessment of
post-consumption
satisfaction with the brand, which determines repurchase intentions and loyalty; and hopefully, over time.
Is Satisfied Increase their usage amount or purchase frequency.
Direct mail, e-mail, outbound telemarketing, traditional media ads, banner and display ads, social media reinforcement, Facebook and Twitter direct communication.
Is Loyal/Repeat Buyer
Is Engaged/Interacts Engage in post-purchase interactions with the brand.
Twitter hashtag events, Facebook, online and offline brand communities, voting-type contests.
Actively Advocates Become a loyal and willing advocate for it.
Another approach to the customer journey are the six moments of truth, which Sharma (2016) states that “In the context of marketing, the moment of truth refers to the experience customers have when interacting with any aspect of your brand, product, service or marketing. The moment of truth can be positive, average or negative depending upon the nature of the customer’s interactions with your brand. In order to truly understand your customer’s purchase journey, you first need to understand these moments of truth.” He describes these moments of truth as:
17
• Stimulus is what triggers the customer into buying mode, and the moment which occurs when a potential customer is first exposed to a brand via an ad or a piece of content such as a blog, infographic, video or podcast. The first interacting marketing channels in Google Analytics can be considered sources of stimulus such as organic searches in Google, direct traffic, LinkedIn referrals, among others.
• Establishing the decision criteria framework can be quickly established for products that require a lot of consideration and evaluation before a purchase is made. For example, people do not buy a new car very often, therefore they need to do a lot of research just to determine the ideal specifications of their new car. Once the specifications have been determined, they have determined their decision criteria framework.
• Zero Moment of Truth is defined as the moment which occurs after a customer has been exposed to a brand, but before a purchase is made. It is the moment when the customer does research and makes a decision about buying your product. During ZMOT, customers usually go back and forth between various digital and non-digital channels to make an informed decision. Sources are online searches (both paid and organic), word of mouth, comparison shopping websites, product review websites, coupon websites, offers and special deals websites, loyalty, rebate and cashback websites, affiliate websites, and offline marketing channels (physical stores, sales people, billboards, magazine ads, TV ads, radio ads, newspaper ads, brochures, leaflets).
• First Moment of Truth refers to the moment which occurs when a customer encounters a product on a website or on the self of a physical store, before making a purchase. In the context of online marketing, website landing pages and product descriptions play an important role in shaping a customer’s first moment of truth.
• Second Moment of Truth is the moment which occurs after a customer has made a purchase and started to use the product. It is the customer’s experience and satisfaction with the product which can be won over by providing a memorable user experience and after sales service.
• Third Moment of Truth occurs after a product has been purchased and used. During this moment customers give feedback to the business in the way of reviews, ratings and word of mouth publicity. During this process, a customer can either become a brand advocate or a brand adversary, depending upon their experience with the product and the after-sale service provided.
18
2.3.4. The Sales Funnel
Patterson (2007) argues that Marketing and Sales are two sides of the same coin since both are responsible for generating revenue to the company. Alignment between the two is essential to increase the chances of increasing revenue, but many times marketing people in organizations accuse salesmen of not following up on leads and refusing to track them through the sales cycle. She also states that this problem is aggravated by a longer and more complex sales cycle, as shown by a research conducted by CSO Insights and IDC.
A sales funnel is, therefore, a way to track potential customers through the sales process. Most companies have many deals progressing at the same time and at different steps, raising several problems to the management of the sales force, which makes the sales funnel a powerful tool in optimising the sales process. It helps assess the health and balance of projected sales by providing information on the following (Davies, 2010): the progress of each customer through the sales process; the value of the opportunity associated with a customer; how long customers are taking to move down the funnel; how many customers are at each step; and projected revenue forecasts for cash flow statements.
Miller (2006), divides the funnel in three areas: at the bottom are the deals that are nearest to being closed; in the middle are other prospects in the works; and above the funnel are numerous promising leads that need further investigation. Each of the three areas require different activities, with the bottom having obstacles to closing the deals that need to be removed, the middle requiring important background work and the top needing the leads to be screened to identify which should be pursued. Miller (2006) also notes: “Ask any executive, including those in sales, how to prioritize the three types of activities and the answer is likely to be that the funnel should generally be worked from the bottom up”. This is problematic and the fundamental cause of the sales cycle volatility. By not generating any new leads, salespeople start to realise that they are in trouble as the funnel is drying up, which results in panic and a flurry of activity.
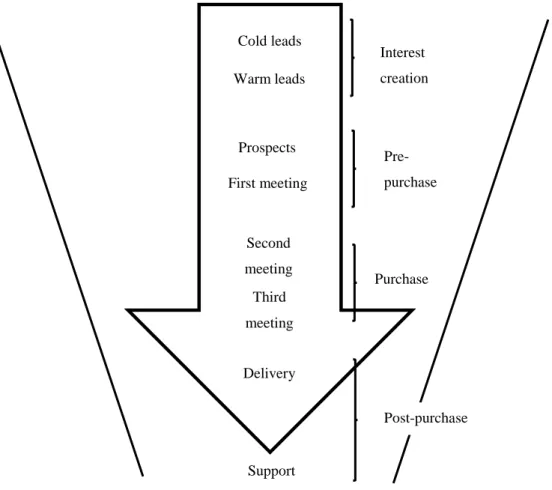
This led to greater importance given to the different stages of the sales funnel and, as a result, a recent approach (figure 2) divides it into four stages (Bendle et al., 2017):
1. Interest creation: implies building product awareness through trade shows, direct mail
and advertising. In the course of interest creation, salespeople can also generate leads. That is, they can identify targets to add to their pool of potential customers. Two main classifications of leads include cold leads, that have not specifically expressed interest, and warm leads, that are expected to be responsive.
19
2. Pre-purchase: involves identifying prospects form among cold and warm leads. A
prospect is a potential customer who has been identified as a likely buyer. Salespeople make this distinction through initial meetings with leads, in which they explain product features and benefits, and cooperate in problem solving with the customer. The desired result of such an early-stage meeting is not a sale but rather the identification of a prospect and the scheduling of another meeting.
3. Purchase: after prospects are identified and agree to additional calls, salespeople
engage in second and third meetings with them. It is in these sessions that traditional “selling” takes place. Salespeople will engage in persuading, negotiating and/or bidding. If a purchase is agreed upon, a salesperson can close the deal through a written proposal, contract or order.
4. Post-purchase: includes the delivery of the product or service, the installation (if
necessary), collection of payments and possibly training. There is an ongoing commitment to customer service. Cold leads Warm leads Purchase Prospects First meeting Second meeting Third meeting Delivery Support Interest creation Pre-purchase Post-purchase Figure 2: The sales funnel by Bendle et al. (2017).
20
“In order to populate a sales funnel correctly, salespeople must maintain records of all their current and potential customers, and the status of each within the purchase process. Each salesperson must also share this information, which can then be aggregated in a comprehensive database of sales force activities. By applying assumptions to these – including assumptions drawn from historical sales results – a firm can project future sales. For example, if 25% of warm leads are generally converted to sales within two months, and 200 warm leads currently appear in a sales funnel, management can estimate that 50 of these will be converted to sales within two months.” (Bendle et al. 2017)
21
3. Methodology
The research subject of this dissertation is complex and dependent on the characteristics of the firm, as determined by three exploratory interviews which provided context for the construction of this methodology and its research questions, such as its sector of activity, competitive and marketing positioning, buyers’ behaviour, and market concentration. As such, the data gathering method needed to be able to process qualitative data. Qualitative data is a necessity because the personal opinions and forecasts of marketing specialists, which will compose the sample, are valuable sources of information to reach a relevant conclusion.
Considering the previous requirements, the most relevant methodology considered was the Delphi method. However, its drawbacks considering the circumstances of this dissertation led to a more sophisticated version of the method – the Real-Time Delphi Method. Both are, therefore, analysed under the existing literature in this methodology and finally, it is explained which software was used to perform the survey.
3.1. Exploratory Interviews
In an attempt to develop the best possible survey to achieve the objectives of this dissertation, three interviews were conducted beforehand to further amplify the knowledge on the subject. The sample consisted of three high performance marketing professionals from three distinct areas who were interviewed separately: one specialist from a marketing agency, one from a communications agency and finally from a media network. These interviews were qualitative with a semi-directive approach, done in an informal way to gather personal insight regarding the present state of marketing budget optimisation and its expected future trends. Two main questions were presented to the interviewees to guide the discussion:
1. What are the best practises in marketing budget optimisation? 2. What are the best metrics regarding marketing budget optimisation?
Coming from three different backgrounds, the answers were quite distinct among the interviewees but still enlightening regarding the current and future state of marketing budget optimisation, and several conclusions were taken from these discussions. First, there cannot be a generalisation of every company towards marketing budget optimisation. If one were to generalise, four types of companies should be considered: 1) digital B2C start-ups such as Uniplaces; 2) other companies with digital sales such as insurance firms and banks; 3)
22
companies with a well-defined sales cycle such as consulting agencies; 4) and companies in more traditional businesses such as retailers in fast-moving consumer goods.
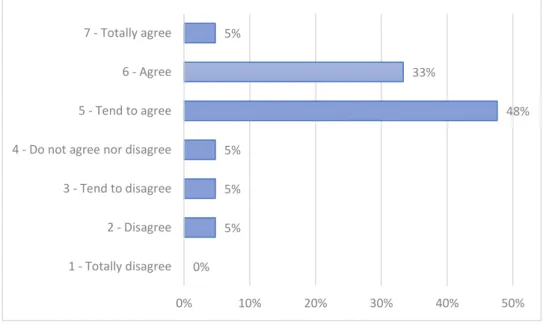
1) Regarding digital B2C start-ups, the most mentioned metrics regarded the number of
clients and their acquisition costs, shares and recommendations, and RFM (recency, frequency and monetary) evaluation. The best practices seemed to rely on maximising the impact of shares and recommendations, as these companies are often in “make it or break it” situations.
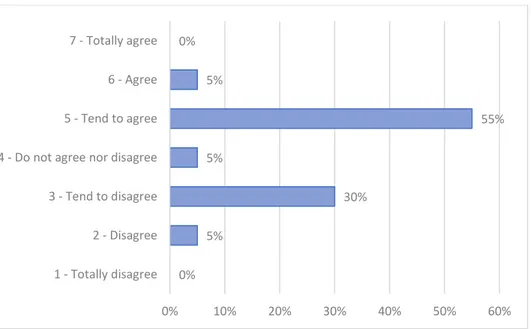
2) For other companies with digital sales, the mentioned metrics were regarding number
of clients, share of wallet, and satisfaction. Best practises came from improving the existing processes to gather more customers and increase their loyalty.
3) For companies with a well-defined sales cycle, the sales funnel was given more
importance than specific metrics and marketing automation platforms such as HubSpot were mentioned as the future of marketing budget optimisation for firms that heavily rely on its sales funnel.
4) For more traditional companies several metrics were mentioned, regarding customer
loyalty, shares and recommendations, market share and sales, and margins. The best practices of marketing budget optimisation were mostly regarding offline and online actions which should engage customers.
Finally, due to the open-ended nature of these conversations, other topics regarding the subject of this dissertation were mentioned that were considered relevant to the development of the survey, such as the growth of earned media, new marketing platforms like HubSpot and XAxis, programmatic marketing, and the growth of social media.
3.2. Research Questions
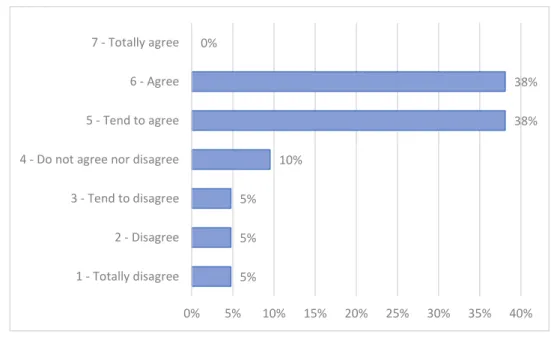
Five research questions were conceptualised according to the information gathered in the exploratory interviews and, when possible, backed by the existing academic literature. As was firstly mentioned, there cannot be a generalisation of every company towards marketing budget optimisation. Vorhies and Morgan (2003) verified this by stating that what constitutes a superior marketing performance may differ between businesses. Therefore, the first research question is: RQ1 – Marketing budget optimisation is related to the type of company.
Second, different metrics to measure marketing budget optimisation were mentioned according to the type of company. Ambler (2000) mentions that a company should use metrics tailored to its unique situation, which leads to the second research question: RQ2 – The most
23
From the first research question, Vorhies and Morgan (2003) continue that “… organizing marketing activities in ways that fit the business strategic type is associated with marketing effectiveness…”. The third research question is, therefore: RQ3 – The focus of marketing
budget optimisation depends of the type of company.
Edelman and Salsberg (2010) stated that “The rough guide to marketing success used to be that you got what you paid for. No longer.” As explained in the literature review, under the customer’s journey, earned media is an increasingly prevalent type of media channel that marketers consider when deciding their marketing budget. As such: RQ4 – Non-controlled
communication by the company, done by its customers, creates new challenges that are growing in impact. Finally, as was also discussed in the interviews and in the literature review,
marketing technologies such as programmatic marketing are growing every year, with the Magna Global Programmatic Intelligence report (2015) estimating that the global expenditure of programmatic marketing will reach $37 billion by 2019. The final research question is, therefore: RQ5 – New technologies, such as programmatic marketing, are increasing,
contributing to marketing budget optimisation.
The final questionnaire (Annex 2) was constructed while considering the previously gathered information, with 13 questions: 12 questions with a Likert-type scale with 7 levels of agreeableness; and 1 question with a scale of probability between 0 and 100%.
3.3. Delphi Method
When considering the need to gather the opinions of specialists regarding the subject matter of this dissertation, the chosen methodology had to be able to gather qualitative data in the form of a discussion between said specialists. The most commonly used methodology in these circumstances is the Delphi method, which was developed at RAND, the Santa Monica “think tank”, in the early 60s by Olaf Helmer, Nicholas Rescher, Norman Dalkey, and others. Since its introduction, thousands of studies requiring the knowledge and opinions of experts have been conducted. In 2008, 105 papers and presentations were identified, in the Scopus database, as having been published in response to the search terms “Delphi study” (Glenn and Gordon, 2009).
Hsu and Sandford (2007) develop the definition of the method, and state that it is well suited as a means and method for consensus-building by using a series of questionnaires (traditionally in pen and paper, and only more recently through software) to collect data from a panel of selected experts. In contrast to other data gathering and analysis techniques, it
24
employs multiple iterations, with overall feedback being given to the respondents as a means to stimulate discussion and reach consensus. Ludwig (1994) explains the process: “Iterations refer to the feedback process. The process was viewed as a series of rounds; in each round every participant worked through a questionnaire which was returned to the researcher who collected, edited, and returned to every participant a statement of the position of the whole group and the participant’s own position. A summation of comments made each participant aware of the range of opinions and the reasons underlying those opinions.”
The feedback process allows and encourages the participants to reassess their initial judgements about the information provided in previous iterations. Therefore, in a Delphi study, it is possible for the panel members to change their responses from previous rounds based on the comments and feedback provided by other panel members. The feedback given is kept anonymous as a way of controlling the process and reduce the effects of dominant individuals, manipulation and coercion to conform or adopt a certain viewpoint, which is often a concern in group-based processes. The Delphi method can be continuously iterated until consensus has been achieved.
Delbecq, Van de Ven and Gustafson (1975) indicate that the Delphi technique can be used to achieve the following:
1. To determine or develop a range of possible program alternatives;
2. To explore or expose underlying assumptions or information leading to different
judgements;
3. To seek out information which may generate a consensus on the part of the respondent
group;
4. To correlate informed judgements on a topic spanning a wide range of disciplines, and; 5. To educate the respondent group as to the diverse and interrelated aspects of the topic.
3.4. Real-Time Delphi Method
Gnatzy et al. (2011) state in their paper that the Delphi method faces “(…) the challenge of increasing efficiency in order to shorten the time to perform a Delphi survey. Moreover, the availability of experts and the drop-out-rate are identified as major methodological challenges: the repetitive and multiple feedback character of Delphi studies demands considerable time until such studies are completed, which can increase the likelihood of drop-outs”.
Gordon and Pease (2006), aware of these limitations, attempted to increase the efficiency of the Delphi survey procedure by omitting sequential rounds. This was achieved by hosting
25
the survey online and having the respondents answer through the internet, reducing the time necessary to perform the procedure, and providing the results in “real-time” – hence the name Real-Time Delphi. Respondents’ answers to the questionnaire would become immediately available for other respondents to check and give feedback on, eliminating the need for sequential rounds and streamlining the whole process.
This process, however, is not without its limitations as well. As Gnatzy et al. (2011) describe, this “(…) real-time survey method exhibits some weaknesses such as the ease-of-use for the facilitator of the Delphi survey, the real-time presentation of results, and the tracking of progress over time…”. Nonetheless, Real-Time Delphi surveys have been used in several different fields of research such as information and communication technologies (Keller and von der Gracht, 2014), security (Gordon et al., 2015), education (Gary and von der Gracht, 2015), logistics (Markmann et al., 2013) and others.
3.5. Research Platform “eDelphi”
A small number of software capable of running a Real-Time Delphi survey are available online, for a fee. Being a recent, less used methodology, the information available regarding these software to students is limited. As such, an article by Aengenheyster et al. (2017) was used to aid in the decision of which platform to use, which compares four different software: RAHS, eDelfoi (now named eDelphi), GFIS and Surveylet.
The platform chosen was eDelphi, mainly for budget reasons, but without discarding the technical aspects that were required for proper data collection. Regarding it, Aengenheyster et
al. (2017) affirm that: “The online software eDelfoi, originally called “Professional Delphi
Scan”, was developed by the Finnish futurists Jari Kaivo-oja, Osmo Kuusi and Hannu Linturi in 1998 in cooperation with the Futures Research Center of the Turku School of Economics. The tool strives to create an environment to design, implement, document, and report on surveys, studies and discussions. (…) Hundreds of projects have been realized using the different versions of eDelfoi and about 200 Finnish organizations use it, including the Finnish Futures Research Centre, The Finnish Innovation Fund SITRA, VTT Technical Research Centre of Finland and various universities.”
The platform is available in Finnish and English but the surveys themselves are free to be written in whatever language the administrator desires. For the purpose of this dissertation, the entire survey is presented in Portuguese, since every respondent was of this nationality. Figure 3 represents how the survey was available to the selected respondents:
26
Figure 3: Example of a question, as seen by the respondent, in the eDelphi platform.
1
2
3
4
27
1. The number of the question that the respondent is currently in, with the body of the
question and instructions, which were presented in every question. This was done to avoid further confusion, since it was the first time of every respondent in a Real-Time Delphi survey.
2. A Likert-type scale with 7 levels that the respondent used to represent his/her level of
concordance with the question. The scale was: 1 – Totally disagree; 2 – Disagree; 3 – Tend to disagree; 4 – Do not agree nor disagree; 5 – Tend to agree; 6 – Agree; 7 – Totally agree.
3. Being a Real-Time Delphi survey, the previous responses of other respondents were
available to the others, and could be checked anytime.
4. The most interesting aspect of the Delphi method is the discussion between its
participants. A comment box was available for respondents to explain their point-of-view regarding their concordance level with the question. They were incentivised to do so.
5. Finally, respondents were also incentivised to check others’ answers and reply to them,
to further justify their point-of-view or to nurture discussion.
3.6. Sample and Survey Process
The sample was composed of 21 marketing specialists. 14 of these specialists are currently connected to marketing agencies, consultancy firms or universities. The remaining 7 are top-level managers.
After a few tests, the final survey was launched online on the 28th of August of 2017. The final answer was registered on the 11th of September of 2017, the same day that the survey was closed, after 2 weeks online. As previously mentioned, the respondents were asked to answer each question in terms of concordance and develop their answers in the form of a comment, which could be done in the comment box of each question.
They were also incentivised to reply to other participants’ answers – as an exploratory study, the richness of this methodology comes from the comments of the specialists that fuelled the discussion. Two rounds were conducted so that respondents had to see every answer at least once and comment accordingly to oppose others’ positions or defend their own.