Palavras chave: Função de afilamento Sortimento de madeira Dependência espacial Interpolador de Krigagem Histórico: Recebido 28/12/2016
Aceito 13/03/2017 Keywords: Taper model Timber assortments Spatial dependence Kriging interpolation
1 Federal University of Parana - Curitiba, Paraná, Brazil
2 Federal University of Mato Grosso - Cuiabá, Mato Grosso, Brazil 3 Central Western State University, Irati, Paraná, Brazil
+Correspondência: [email protected]
DOI: 10.1590/01047760201723012291
Allan Libanio Pelissari1+, Marcelo Roveda1, Sidney Fernando Caldeira2, Carlos Roberto
Sanquetta1, Ana Paula Dalla Corte1, Carla Krulikowski Rodrigues3
GEOSTATISTICAL MODELING OF TIMBER VOLUME SPATIAL VARIABILITY FOR Tectona grandis L. F. PRECISION FORESTRY
ABSTRACT: Considering the hypothesis that the wood volumes present spatial dependence, whose knowledge contributes for the precision forestry, the aim of this work was to estimate the volume spatial variability for timber assortments and identify their spatial patterns on Tectona grandis stands. A dataset of 1,038 trees was used to fit
taper models and estimate the total stem, sawlog, and firewood volumes in 273 plots allocated on T. grandis stands at eight years old, which represents the second thinning that enables commercial volumes. Semivariograms models was applied to fit the spatial dependence, and punctual kriging was used to compose volume maps. Geostatistical modeling allowed us to estimate the T. grandis spatial variability and develop timber volume maps. Thus, silvicultural treatments, such as thinning and pruning, as well as for planning spatial interventions, are possible to be recommended for aimed wood products.
MODELAGEM GEOESTATÍSTICA DA VARIABILIDADE ESPACIAL DO VOLUME DE MADEIRA PARA O MANEJO DE PRECISÃO DE Tectona grandis L. F.
Tectona grandis L. F. PRECISION FORESTRY
INTRODUCTION
Tectona grandis L. f. (Lamiaceae) is an Asian tree species cultivated in Africa, and South and Central America (NOCETTI et al., 2011; PELISSARI et al., 2013). Its wood has high commercial value due to workability and durability features (MORA; HERNANDÉZ, 2007), intended mainly for furniture and shipbuilding industries (FIGUEIREDO et al., 2005). Moreover, the use of thinned wood is possible for many purposes, especially for sawlog and firewood on the second thinning in the forest stands.
Although the lack of information about specific management regimes for T. grandis, this species is an important income source and lucrative alternative for forest managers (ÂNGELO et al., 2009; NEWBY et al., 2012), due to the reduction of wood supply from natural forest and the increasing demand for timber products. Thus, the development of tools is needed to support sustainable forest management for assorted raw materials, such as methods to increase the accuracy of volume estimates and their spatial features in forest stands.
Taper functions are essential to measure tree stem forms, providing estimation of diameter at any height, height at any top diameter, and total and commercial tree volumes (BARRIO ANTA et al., 2007; TANG et al., 2016), in which equations have been proposed for quantifying and qualifying the T. grandis wood volume for timber assortments (FIGUEIREDO et al., 2006; LEITE et al., 2011; FAVALESSA et al., 2012). However, these studies did not report the timber volume spatial features, which are special important for forest management (AKHAVAN et al., 2015).
For this reason, geostatistical analysis stands out as a set of statistical techniques for spatial modeling and interpolate values in non-sampled areas (SUN et al., 2008; DAFONTE et al., 2010). Geostatistics is based on the Theory of Regionalized Variables (MATHERON, 1971; WEBSTER; OLIVER, 2007), which establishes the regionalized variable as a numerical function of spatial phenomenon, in which semivariance is a basic statistics to measure the spatial structure and relationships between plots.
Aiming to provide information for the precision forestry, we considering the hypothesis that the stand volumes of different timber assortments present spatial dependence, whose knowledge contributes for planning thinning, harvesting prescriptions, specific silvicultural treatments, and commercial demands for wood products. Thus, the aim of this work was to estimate the volume spatial variability for timber assortments and identify their spatial patterns on T. grandis stands.
MATERIAL AND METHODS
This study was carried out in 1,260 ha of forest stands with T. grandis species, on the spacing 3 m x 3 m, and located in Mato Grosso State, Central-West Region of Brazil, on the coordinates 16°09’00” S at 16°13’50” S and 56°21’00” W at 56°24’20”W. The region’s climate was classified as Aw (Köppen), with mean rainfall and annual temperature equal to 1,300 mm year-1 and 25 ºC, respectively (ALVARES et al., 2013), while Haplic Planosol soil was identified in sandy-clay-loam texture and gently undulating topography.
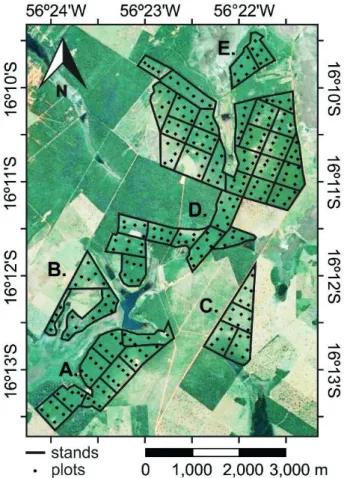
A sample with 273 georeferenced plots (15 m x 30 m) was allocated covering five T. grandis stands at eight years old (Figure 1), named A to E, in which this age represents the second thinning that enables commercial volumes for sawlog and firewood. In addition, 1,038 trees were scaling by the Smalian’s method, measuring diameters over-bark on the heights: 0.1m, 0.5 m, 1.0 m, 1.3 m, 2.0 m, and 1.0 m intervals along the total height.
Stem taper modeling and timber volume estimation
Max and Burkhart (1976) and Parresol et
al. (1987) segmented taper models were fitted by Marquardt algorithm to estimate stem diameters, while
FIGURE 1 Position of the plots allocated on the Tectona grandis
the powers (pn) of Hradetzky (1976) non-segmented
taper model were obtained through stepwise process described by Lanssanova et al. (2013). For evaluating the performance of these models, we considering the highest adjusted coeffi cient of determination (R2
adj.),
lowest relative standard error of the estimate (SEE%), regression coeffi cients (βi) at 0.05 signifi cance level,
and graphical analysis of the stem profi le (di/d - hi/h). Where: di= diameter over-bark in an i section (cm), d
= diameter over-bark at 1.3m above ground level (cm),
βi = regression coeffi cients, h = total height (m), hi = height in an i section (m), X = hi/h, I1 = 1 if X ≤ α1, I2 =
1 if X ≤ α2, z = (h – hi)/h, Y = 1 if z ≥ α1, and p1, p2,…,
pn = powers.
Semivariograms were evaluated through smallest weighted sum of squared deviations (WSSD), highest coeffi cient of determination (R2), and by cross-validation: linear and angular coeffi cients, coeffi cient of determination of cross-validation (R²cv), and relative standard error of the estimate of cross-validation (SEE%cv). In addition, we evaluated the anisotropy by directional semivariograms (WEBSTER; OLIVER, 2007), the residual analysis for volume estimates, and the spatial dependence index (SDI) proposed by Seidel and Oliveira (2014) for the models: Spherical (8), Exponential (9), and Gaussian (10), where: C0 = nugget effect, C1 = contribution, a = range (m), and 0.5∙MD = half of maximum distance (MD) between plots, in which
= half of maximum distance (
is truncated into 1 when it higher than 1.
Max and
Burkhart (1976) [1]
Parresol et al.
(1987) [2]
Hradetzky
(1976) [3]
Total stem volume was estimated on the plots through integration of the stem sectional solid by rotation of the taper function (BARRIO ANTA et al., 2007). Thus, timber assortments were obtained and, subsequently, classifi ed according to Shimizu et al. (2007) for T. grandis stands: 1) Sawlog volume: logs with 2.4 m of length and tip diameter more than 15 cm, and 2) Firewood volume: logs with 1.0 m of length and tip diameter between 4.0 cm and 15 cm, while the remaining volume was considered non-commercial. Also, descriptive statistics and Kolmogorov-Smirnov’s test at 0.05 signifi cance level were applied to volume datasets.
Geostatistical modeling and timber volume mapping
Geostatistical analysis was used to modeling the volume spatial patterns of total stem, sawlog, and fi rewood. Thus, semivariances (4) were calculated considering the geographical position of the plots, the lag distances (h) between them and the numerical differences of each variable (Z) on the grid. Subsequently, Spherical (5), Exponential (6) and Gaussian (7) models were fi tted by weighted least squares in GEOEST software (VIEIRA et al., 2002), in which this method aims to minimize the sum of squares of the semivariance deviations weighted by the number of pair of plots in each lag distance (REILLY; GELMAN, 2007), Where: y(h) = semivariance of Z(xi) variable, h = lag distance between plots (m), N(h) = number of pairs of plots for each lag distance h, C0 = nugget effect, C = sill, and a = range (m).
[4] [5] [6] [7] [8] [9] [10]
SDI % C
C C MD
Sphe( )= ⋅ + ⋅ ⋅ ⋅ 0 375 0 5 1 1 0 1 . . a 0 00
SDI % C
C C MD Exp( )= ⋅
+ ⋅ ⋅ ⋅ 0317 0 5 10 1 0 1 . . a 0 0
Seidel and Oliveira (2016) established a classifi cation for spatial dependence, in which for Spherical model:
SDISphe( )%≤7% (weak), 7%<SDISphe( )%≤15%
(moderate), and SDISphe( )%> 15% (strong); for Exponential
model: SDISphe( )%≤ 6% (weak), 6% <SDI % Sphe( )≤13%
(moderate),SDISphe( )%>13% (strong); and for Gaussian
model: SDISphe( )%≤ 9% (weak), 9%<SDISphe( )%≤20%
(moderate), and SDISphe( )%> 20% (strong).
Punctual kriging method (CHAUDHRY et al., 2013) was applied to interpolate the total stem, sawlog, and fi rewood volumes, and thematic maps were made using Surfer software (GOLDEN SOFTWARE, 2014) with fi ve classes weighted through the mean volume (x) and standard
deviation (σ): Class I = , Class II = , Class III =x , Class IV = , and Class V = , aiming
equivalent volume classes between timber assortments.
RESULTS AND DISCUSSION
Regression coeffi cient values of taper models (αi
and βi) were signifi cant at 0.05 level (Table 1), in which
Tectona grandis L. F. PRECISION FORESTRY Max & Burkhart’s model: 3.5% (α1) and 12.8% (α2) of the
total height; while one form change was evidenced using Parresol’s model in the 13.1% stem position (1 - α1). Stem form of T. grandis trees is affected by the planting spacing, since trees with cylindrical form are obtained in stands of highest density (VENDRUSCULO et al. 2016).
However, this tendency in the top-part of the stem, where smallest diameters occur, was also observed by Favalessa et al. (2012) for T. grandis, and Queiroz et al. (2008) for Mimosa scabrella Benth. Despite the highest dispersion in a stem part, most taper models do not describe the entire stem with the same accuracy (CRECENTE-CAMPO et al., 2009).
By means of the timber assortments estimates, minimum, mean and maximum values were observed for diameter over-bark at 1.3 m above ground level and total height in the Table 2, as well as for total stem, sawlog and firewood volumes. Thus, highest variability was observed for sawlog volume, due to the low tree density with dimension to supply this timber assortment. In addition, the wood volumes were normally distributed by the Kolmogorov-Smirnov’s test, with a maximum significant difference (Dmax) equal to 0.08 at the 0.05 significance level.
With the geostatistical modeling (Table 2), lowest nugget effect (C0) values were observed for firewood volume, followed by sawlog and total stem volumes, whose values can be attributed to short-range variability that occurs at a scale smaller than the closest sample spacing (ZAWADZKI et al., 2005). In addition, highest ranges values (a) for total stem and firewood volumes indicated the distance limit at which two plots are spatially correlated and stochastically dependent (ZAS, 2006).
TABLE 1 Regression coefficients and statistical parameters of
taper models fitted for Tectona grandis stands.
Model α1 α2 β0 β1 β2 β3 β4 R2adj.
SEE% di vi
Hradetzky - - 1.437* 1.133* -2.013* -2.235* 1.888* 0.97 7.712.8
(Power) - - - (0.005) (0.1) (4) (5) - -
-Max and
Burkhart0.035* 0.128* - -1.748* 0.697* 461.479* 26.145* 0.97 7.813.0 Parresol 0.869* - - 2.062* -1.151* -1,251.7* 480.202*0.96 8.3 26.8
Where: * = 0.05 significance level.
For Hradetzky’s model, the powers (pn): 0.005 (β1), 0.1 (β2), 4 (β3), and 5 (β4) were selected for representing the stem profile of T. grandis trees in this study, while Figueiredo et al. (2006) selected the powers: 0.006 (β1), 0.004 (β2), 0.8 (β3), 0.5 (β4), 2 (β5), and 10 (β6) for the
same species in Acre State. These results confirming the conception of the Hradetzky’s model (1976), in which highest powers represent the base of trees, while lowest powers describe the top-part of the stem.
Coefficients of determination (R2
adj.) were higher than 0.9 for all taper models, while relative standard errors of the estimate (SEE%) were less than 9% for diameters and less than 27% for stem volumes (Table 1). Thus, best fits were obtained through Hradetzky’s model, followed by Max and Burkhart’s model. On the other hand, the goodness-of-fit of Parresol’s model was poor due to the lack of studies for T. grandis and other species with similar stem forms, aiming to provide consistent input parameters (α and β) for the non-linear regression analysis.
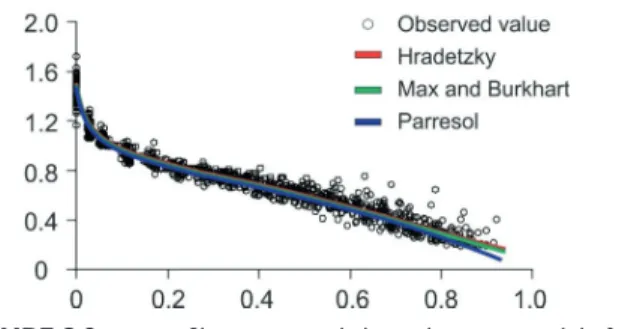
Graphical analysis of stem profiles (Figure 2) shows homogeneous dispersion of diameter values, confirming the choice of Hradetzky’s model to estimate T. grandis stem form and its similarity with Max & Burkhart’s model estimates. Also, Hradetzky’s model presented the best fit to estimate diameters along the T. grandis stem according to Favalessa et al. (2012). Other models have been proposed to describe the taper form for the same species, such as Goulding and Murray (FIGUEIREDO FILHO et al., 2006), and Garay (LEITE et al., 2011).
However, high dispersion was verified from 60% of the total height (hi/h ≥ 0.6), indicating large tree diameter variation on the final stem form. The pruning system applied to T. grandis stands can be related to this result, in which the branches were pruned around 8.0 m of the height for better form of the initial tree stem.
FIGURE 2 Stem profiles estimated through taper models for
Tectona grandis stands.
TABLE 2 Descriptive statistics of forest variables for Tectona grandis stands.
Value
Diameter at 1.3 m
(cm)
Total height (m)
Total stem (m3 .ha-1)
Sawlog (m3.ha-1)
Firewood (m3.ha-1)
Minimum 16.24 15.06 93.21 14.24 42.31
Mean 19.72 17.41 187,52 56.94 49.70
Maximum 22.94 19.81 261,19 108.60 54.72
CV% 7.45% 5.84% 18.59% 35.04% 4.40%
K-S test 0.06ns 0.07ns 0.08ns 0.06ns 0.06ns
Where: CV% = coefficient of variation, K-S test = Kolmogorov-Smirnov’s test,
Strong spatial dependence index (SDI) was observed for timber assortments, according to the classifi cation proposed by Seidel and Oliveira (2016), especially for sawlog with highest SDI values, while moderate SDI was obtained with Spherical and Gaussian models for fi rewood. The spatial dependence of T. grandis volume was also verifi ed by Santana (2011) and Pita (2012). In addition, coeffi cients of determination (R²) were higher than 0.9, excepting for fi rewood with Exponential model (Table 3), and lowest weighted sum of squared deviations (WSSD) were obtained for fi rewood volume.
These semivariograms showed different behaviors at the origin, and low dispersion of observed values (Figure 3). The curve’s origin of semivariograms, which represents the nugget effect (C0), increased with the timber assortment diameter reduction, in which fi rewood volume had lowest spatial correlation between plots at short distances (Figure 2C). In addition, directional semivariograms exhibited structural similarity along distances.
Semivariograms were evaluated through cross-validation, which resulted, respectively for total stem, sawlog, and fi rewood volumes, in linear coeffi cients of 1.70, 0.21, and 10.51; angular coeffi cients of 1.01, 1.00, and 0.79; coeffi cients of determination (R²cv) of 0.518, 0.685, and 0.146; and relative standard errors of the estimate (SEE%cv) of 12.90%, 19.76%, and 4.07%. Highest residual dispersion for total stem (Figure 4A) and for sawlog (Figure 4B) confi rmed these results, while lowest variability was obtained for fi rewood volume (Figure 4C).
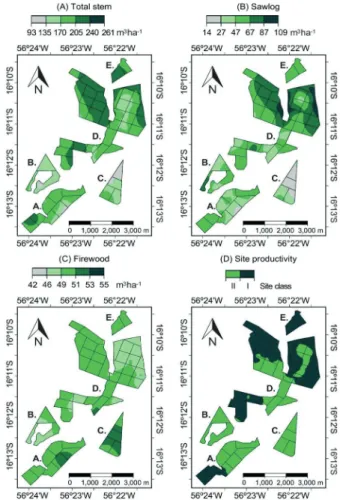
Applying these fi ts, volume maps were made through punctual kriging (Figure 5), in which the spatial distributions for total stem (Figure 5A) and sawlog (Figure 5B) were most similar, especially in highest volume stock area on the stand D. In addition, middle class predominance (49 to 51 m3.ha-1) was observed for fi rewood volume (Figure 5C). Therefore, the common usage of mean values does not allow us to identify the spatial strata of timber volumes, in which the combination of geostatistics and forest inventory is needed to detect these spatial distributions (MELLO et al., 2006; GUEDES et al., 2012; LUNDGREN et al., 2015).
TABLE 3 Semivariogram parameters fi tted to total stem, sawlog,
and fi rewood volumes for Tectona grandis stands.
Volume Model C0 C0+C
a (m)
SDI
(%) Class R
2 WSSD
Total stem
Spherical 337.691,206.00 1,32927.00 Strong 0.990 806.96 Exponential 208.101,369.73 1,98726.80 Strong 0.9801,334.37
Gaussian 501.30 1,225.331,20629.78 Strong 0.9791,029.01
Sawlog
Spherical 0.10 310.69 753 37.49 Strong 0.971136.03 Exponential 1.00 332.80 1,100 31.60 Strong 0.974 128.53 Gaussian 9.50 308.70 579 48.85 Strong 0.971192.19
Firewood
Spherical 3.08 5.09 1,36214.80Moderate 0.920 0.03 Exponential 2.88 5.49 2,16215.08 Strong 0.895 0.04 Gaussian 3.36 5.14 1,254 17.43Moderate 0.916 0.03
Where: C0 = nugget effect, C = sill, a = range, SDI = spatial dependence index, R²
= coeffi cients of determination, and WSSD = weighted sum of squared deviations.
FIGURE 3 Scaled semivariograms fi tted to total stem (A),
sawlog (B), and fi rewood (C) volumes for Tectona
grandis stands.
FIGURE 4 Distribution of residues through geostatistical modeling applied to total stem (A), sawlog (B), and
fi rewood (C) volumes for Tectona grandis stands.
FIGURE 5 Spatial distribution maps of total stem (A), sawlog
(B) and fi rewood (C) volumes, and site productivity
adapted from Pelissari et al. (2014), for Tectona
Tectona grandis L. F. PRECISION FORESTRY Forest site productivity influences on the
stem form and tree development (KOHLER et al., 2016), in which the timber volume spatial patterns were correlated to the site spatial variability (Figure 5D), especially for sawlog volume (Figure 5B) on site with highest productivity (Class I) on stand D, such as observed in the kriged site map proposed by Pelissari et al. (2014). Thus, the stand physical-planning, aiming timber assortments, can be applied to reforestation, observing the local edaphic and topographic features that limit the tree growth.
In addition, considering the spatial dependence of timber volumes (Figure 5), the combination of geostatistics and operational research techniques makes it possible to define forest management regimes for each stand, associating the forest-based industries and their demands for wood raw material. Moreover, it is possible to define non-productive areas of some timber assortment for other purposes, such as the stand C with low sawlog volume (Figure 5B) for firewood (Figure 5C).
Thus, the knowledge on spatial patterns allows us to define silvicultural treatments for maximum forest yield. With this, selective thinning applied to young stands, as well as high pruning levels since the first thinning, can be concentrated to the trees present in some areas of stand D with highest sawlog volume stock (Figure 5B), aiming to obtain logs with large size and quality. Also, less intensive silvicultural treatments, such as absence of maintenance pruning of fully-grown trees, can be applied to stands A and C with highest firewood volume (Figure 5C), intending to obtain tree biomass at low production costs.
CONCLUSION
Tectona grandis timber assortment presents spatial dependence on the forest stands, in which geostatistical modeling allowed us to estimate the spatial variability and develop volume maps. Therefore, silvicultural treatments, such as thinning and pruning, as well as for planning spatial interventions, are possible to be recommended for aimed wood products.
REFERENCES
AKHAVAN, R.; KIA-DALIRI, H.; ETEMAD, V. Geostatistically
estimation and mapping of forest stock in a natural unmanaged forest in the Caspian region of Iran. Caspian Journal of Environmental Sciences, v. 13, n. 1, p. 61-76, 2015.
ALVARES, C. A.; STAPE, J. L.; SENTELHAS, P. C.; GONÇALVES,
J. L. de M.; SPAROVEK, G. Köppen’s climate classification
map for Brazil. Meteorologische Zeitschrift, v. 22, p.
1-18, 2013.
ÂNGELO, H.; SILVA, V. S. M.; SOUZA, Á. N.; GATTO, A. C. Aspectos financeiros da produção de teca no Estado de
Mato Grosso. Floresta, v. 39, n. 1, p. 23-32, 2009.
BARRIO ANTA, M.; DIÉGUEZ-ARANDA, U.; CASTEDO-DORADO, F.; ÁLVAREZ GONZÁLEZ, J.; GADOW, K.
Merchantable volume system for pedunculate oak in northwestern Spain. Annals of Forest Science, v. 64, n.
5, p. 511-520, 2007.
CHAUDHRY, A.; KHAN, A.; MIRZA, A. M.; ALI, A.; HASSAN, M.; KIM. J. Y. Neuro fuzzy and punctual kriging based filter
for image restoration. Applied Soft Computing, v. 13, n.
2, p. 817-832, 2013.
CRECENTE-CAMPO, F.; ALBORECA, A. R.;
DIÉGUEZ-ARANDA, U. A merchantable volume system for Pinus
sylvestris L. in the major mountain ranges of Spain. Annals
of Forest Science, v. 66, n. 8, p. 808-820, 2009.
DAFONTE, J. D.; GUITIÁN, M. U.; PAZ-FERREIRO, J.; SIQUEIRA, G. M.; VÁZQUEZ, E. V. Mapping of soil
micronutrients in an European Atlantic agricultural landscape using ordinary kriging and indicator approach.
Bragantia, v. 69, p. 175-186, 2010.
FAVALESSA, C. M. C.; UBIALI, J. A.; CALDEIRA, S. F.; DRESCHER, R. Funções de afilamento não segmentadas
e segmentadas para Tectona grandis na região centro-sul
matogrossense. Pesquisa Florestal Brasileira, v. 32, n.
72, p. 378-387, 2012.
FIGUEIREDO, E. O.; OLIVEIRA, A. D.; SCOLFORO, J. R. S.
Análise econômica de povoamentos não desbastados de
Tectona grandis L.f., na microrregião do baixo Rio Acre.
Cerne, v. 11, n. 4, p. 342-353, 2005.
FIGUEIREDO, E. O.; SCOLFORO, J. R. S.; OLIVEIRA, A. D. Seleção de modelos polinomiais para representar o perfil e
volume do fuste de Tectona grandis L.f. Acta Amazônica,
v. 36, n. 4, p. 465-482, 2006.
GUEDES, I. C. L.; MELLO, J. M.; MELLO, C. R.; OLIVEIRA,
A. D.; SILVA, S. T.; SCOLFORO, J. R. S. Técnicas
geoestatísticas e interpoladores espaciais na estratificação
de povoamento de Eucalyptus sp. Ciência Florestal, v.
22, n. 3, p. 541-550, 2012.
GOLDEN SOFTWARE. Surfer® 12:powerful contouring, gridding, and surface mapping. Colorado: Golden
Software, 2014. 1056 p.
HRADETZKY, J. Analysis und interpretation statistisher abränger keiten. Baden: Württemberg Mitteilungen der
FVA, 1976. 146 p.
KOHLER, S. V.; KOEHLER, H. S.; FIGUEIREDO FILHO, A.;
ARCE, J. E.; MACHADO, S. do A. Evolution of tree stem taper in Pinus taeda stands. Ciência Rural, v. 46, n. 7, p.
LANSSANOVA, L. R.; UBIALLI, J. A.; ARCE, J. E.; PELISSARI,
A. L.; FAVALESSA, C. M. C.; DRESCHER, R. Avaliação de
funções de afilamento para a estimativa de diâmetro de espécies florestais comerciais do bioma amazônico
mato-grossense. Floresta, v. 43, n. 2, p. 215-224, 2013.
LEITE, G. H.; OLIVEIRA-NETO, R. R.; MONTE, M. A.; FARDIN,
L.; ALCANTARA, A. M.; BINOTI, M. L. M. S.; CASTRO, R.
V. O. Modelo de afilamento de cerne de Tectona grandis L.f.
Scientia Forestalis, v. 39, n. 89, p.53-59, 2011.
LUNDGREN, W. J. C.; SILVA, J. A. S.; FERREIRA, R. L.
C. Estimação de volume de madeira de eucalipto por cokrigagem, krigagem e regressão. Cerne, v. 21, n. 2, p.
243-250, 2015.
MAX, T. A.; BURKHART, H. E. Segmented polynomial
regression applied to taper equations. Forest Science, v.
22, n. 3, p. 283-289, 1976.
MELLO, J. M.; OLIVEIRA, M. S.; BATISTA, J. L. F.; JUSTINIANO JÚNIOR, P. R.; KANEGAE JÚNIOR, H. Uso do estimador
geoestatístico para predição volumétrica por talhão.
Floresta, v. 36, n. 2, p. 251-260, 2006.
MORA, F.; HERNÁNDEZ, W. Estimación del volumen comercial por producto para rodales de teca en el pacífico
de Costa Rica. Agronomía Costarricense, v. 31, n. 1, p.
101-112, 2007.
NEWBY, J. C.; CRAMB, R. A.; SAKANPHET, S.; MCNAMARA, S. Smallholder teak and agrarian change in Northern Laos.
Small-scale Forestry, v. 11, p. 27-46, 2012.
NOCETTI, M.; ROZENBERG, P.; CHAIX, G.; MACCHIONI, N.Provenance effect on the ring structure of teak (Tectona
grandis L.f.) wood by X-ray microdensitometry. Annals of
Forest Science, v. 68, p. 1375-1383, 2011.
PARRESOL, B. R.; HOTVEDT, J. E.; CAO, Q. V. A volume and taper prediction system for bald cypress. Canadian Journal of Forest Research, v. 17, n. 3, p. 250-259, 1987.
PELISSARI, A. L.; CALDEIRA, S. F.; DRESCHER, R. Desenvolvimento quantitativo e qualitativo de Tectona
grandis L.f. em Mato Grosso. Floresta e Ambiente, v. 20,
n. 3, p. 371-383, 2013.
PELISSARI, A. L.; FIGUEIREDO FILHO, A.; MACHADO, S.
A.; CALDEIRA, S. F. Geostatistical modeling of site index classes in teak stands. SOP Transactions on Statistics and Analysis, v. 1, p. 74-85, 2014.
PITA, J. D. Variabilidade espacial dos atributos químicos do solo e dendrométricos em plantio de teca (Tectona grandis L. f. Lamiaceae) no município de
Abaetetuba-PA. 2012. 92 p. Dissertation, Universidade Federal Rural
da Amazônia, Belém.
QUEIROZ, D.; MACHADO, S. A.; FIGUEIREDO FILHO, A.;
ARCE, J. E.; KOEHLER, H. S. Identidade de modelos em
funções de afilamento para Mimosa scabrella Bentham em
povoamentos nativos da região metropolitana de Curitiba/ PR. Floresta, v. 38, n. 2, p. 339-349, 2008.
REILLY, C.; GELMAN, A. Weighted classical variogram estimation for data with clustering. Technometrics, v. 49,
n. 2, p. 184-194, 2007.
SANTANA, R. A. Avaliação de técnicas geoestatísticas no inventário de povoamentos de Tectona grandis
L. f. 2011. 43 p. Dissertation, Universidade Federal de
Viçosa, Viçosa.
SEIDEL, E. J.; OLIVEIRA, M. S. Novo índice geoestatístico para a mensuração da dependência espacial. Revista Brasileira de Ciência do Solo, v. 38, p. 699-705, 2014.
SEIDEL, E. J.; OLIVEIRA, M. S. A classification for a geostatistical
index of spatial dependence. Revista Brasileira de Ciência do Solo, v. 40, p. 1-10, 2016.
SUN, L.; YANG, X.; WANG, W.; MA, L.; CHEN, S. Spatial
distribution of Cd and Cu in soils in Shenyang Zhangshi Irrigation Area (SZIA), China. Journal of Zhejiang University SCIENCE B, v. 9, n. 3, p. 271-278, 2008.
TANG, X.; PÉREZ-CRUZADO, C.; FEHRMANN, L.; ÁLVAREZ-GONZÁLEZ, J. G.; LU, Y.; KLEINN, C. Development of a compatible taper function and stand-level merchantable
volume model for Chinese fir plantations. PLoS ONE, v.
11, n. 1, p. 1-15, 2016.
VIEIRA, S. R.; MILLETE, J. A.; TOPP, G. C.; REYNOLDS, W. D. Handbook for geostatistical analysis of variability in soil and meteorological parameters. In: ALVAREZ, V. V. H.; SCHAEFER, C. E. G. R; BARROS, N. F.; MELLO, J. W. V.; COSTA, L. M. Tópicos em ciência do solo. Viçosa: Sociedade Brasileira de Ciência do Solo, v. 2,
2002. p. 01-45.
WEBSTER, R.; OLIVER, M. A. Geostatistics for environmental scientists. 2. ed. West Sussex: John Wiley
& Sons Ltd, 2007. 333 p.
ZAS, R. Iterative kriging for removing spatial autocorrelation in analysis of forest genetic trials. Tree Genetics & Genomes, v. 2, n. 4, p. 177-185, 2006.
ZAWADZKI, J.; CIESZEWSKI, C. J.; ZASADA, M.; LOWE, R. C. Applying geostatistics for investigations of forest ecosystems using remote sensing imagery. Silva Fennica,