Quantitative trait loci mapping for meat quality traits in swine chromosome 6
[Mapeamento de locos de características quantitativas no cromossomo 6 de suínos, associados à qualidade da carne]
A.V. Pires1, P.S. Lopes1*, S.E.F. Guimarães1, C.T. Guimarães2, L.A.M. Gomide1,A.A. Benevenuto Júnior1, F.M.S. Carmo1
1Universidade Federal de Viçosa
Av. P.H. Rolfs, s/n 36571-000 – Viçosa, MG
2
Embrapa Milho e Sorgo - Sete Lagoas, MG
ABSTRACT
The current study was carried out to perform QTL mapping on swine chromosome 6 (SSC6) associated to meat quality traits. The F2 population was produced by outbreed crossing using two native Brazilian breed Piau boars and 18 commercial sows. A total of 557 F2 animals were genotyped for 13 microsatellite markers. The traits evaluated on the F2 population were: pH measured 45 minutes and 24 hours post mortem (pH 45, pH24, respectively), drip loss (DL), cooking loss (CL), total loss (TL), intramuscular fat content (IMF), objective tenderness (OT), lightness (L), redness (A), yellowness (B), hue angle (h) and chrome (c). Data were analyzed by multiple regression developed for analysis of outbreed line crosses, using the QTL Express Software. Significant QTL were detected for pH45 and DL traits, and suggestive QTL for DL. QTL were not found for other traits. The pH45 and DL traits may be under the influence of one gene or a gene group located at about 76, 88 and 97cM. More markers should be included in the regions where F-value peaks and suggestive QTL for the DL trait were detected to ascertain whether they are real QTL.
Keywords: QTL, outbreed cross, genetic, molecular marker, animal breeding
RESUMO
Realizou-se o mapeamento de QTL no cromossomo 6 suíno (SSC6), associado às características de qualidade da carne. Um total de 557 animais de uma população F2 foi obtido do cruzamento entre dois machos da raça nativa brasileira Piau e 18 fêmeas comerciais, cujos genótipos foram obtidos para 13 marcadores microssatélites. As características avaliadas na F2 foram pH, medido 45 minutos e 24 horas post-mortem (pH45 e pH24, respectivamente); perda por gotejamento (DL); perda por cozimento (CL); perda total (TL); gordura intramuscular (IMF); maciez objetiva (OT); luminosidade (L); índice de vermelho (A); índice de amarelo (B); tonalidade de cor (h); e índice de saturação (c). Utilizou-se o método de regressão por intervalo de mapeamento, por meio do programa QTL Express. Foram detectados QTLs significativos para pH45 e DL, sugestivos para DL, e não foram encontrados QTLs para as demais características. Constatou-se que grupos gênicos, localizados em torno de 76, 88 e 97cM, podem atuar no pH45 e no DL. Nas regiões dos picos da estatística F, onde se verificaram QTLs sugestivos para DL, devem ser incluídos mais marcadores, para confirmar a presença de QTLs.
Palavras-chave: QTL, cruzamento divergente, genética, marcador molecular, melhoramento animal
Recebido para publicação em 13 de abril de 2004
Recebido para publicação, após modificações, em 17 de novembro de 2004 *Autor para correspondência (corresponding author)
INTRODUCTION
Experiments mapping quantitative trait loci (QTL) have been carried out on many animal species of economic interest. The main objective in QTL studies is to map loci that could be used in breeding programs by marker assisted selection. To proceed QTL mapping, molecular markers should be mapped at different chromosomal positions and then using statistical methods to estimate the association among the variations of the marker genotype and the phenotype of the investigated traits. The use of molecular markers has made it possible to dissect the variation in quantitative traits and identify QTL influencing economically important traits.
In a saturated linkage map, the number of markers distributed on the genome is high and the QTL mapping is more efficient. The pig genome has about 2800cM, distributed on 18 autossomes and a pair of sexual chromosomes. More than 1000 genetic markers have already been described for the pig genome, allowing an average distance between them of about 2.8cM (Pig…, [200-]). Thus the QTL associated to a phenotipic variation can be determined with high accuracy.
Molecular markers permit the early estimation about a future phenotypic variation, and it is not necessary that the individual reaches the adult age to obtain information on its phenotypic performance. Another advantage concerns the traits whose phenotypic values can only be obtained after slaughtering the animals. The use of the data from molecular markers can provide information on a certain carcass composition or meat quality traits, for example, without having to slaughter the animal.
Most crossing in pigs to form a divergent F2 population for QTL study is obtained by mating between the wild European pig or the Chinese pig and commercial breeds such as Landrace, Large White or Pietrain (Pig…, [200-]; Rothschild, 2003). This was the first study involving the cross between commercial breeds and the native Brazilian pig.
Many studies have attempted to detect QTL
al., 2000; Grindflek, et al., 2001; Malek, et al., 2001; Ovilo et al., 2002) and most have detected QTL with significant effect on the phenotypic variation of the traits.
The objective of this study was to map QTL associated to meat quality traits on swine chromosome 6, from an F2 population obtained by crossbreeding.
MATERIALS AND METHODS
The families were formed and phenotypic data were obtained on the pig breeding farm of the Animal Science Department at the Federal University of Viçosa (UFV) in Viçosa, MG, from November 1998 to July 2001.
The F2 design was used to obtain linkage disequilibrium among markers and QTL. For this, two families were formed from the crosses of two native Brazilian breed Piau sires with 18 dams from a line developed at UFV by mating animals from the commercial breeds Landrace x Large White × Pietrain, selected for performance traits. The F1 generation was born between March and May 1999. Eleven piglets were randomly selected from the F1 males, from different dams, that were mated (natural service) with 54 F1 females. These animals were mated between February and October 2000 to produce the F2 generation that was born between June 2000 and February 2001. Thus 617 F2 animals were obtained, divided into five batches (1- animals born between 20/06/00 and 03/07/00; 2- animals born between 03/08/00 and 23/08/00; 3- animals born between 16/09/00 and 01/11/00; 4- animals born between 30/11/00 and 25/12/00 and 5- animals born between 19/01/01 and 12/02/01).
carcass of each animal was chilled in frozen at 4oC for 24 hours. After this period, a sample of the Logissimus dorsi muscle was removed and used for the meat quality traits evaluation.
The following meat quality traits were analyzed in F2 animals: pH measured 45 minutes and 24
hours post mortem (pH45 and pH24,
respectively), drip loss (DL), cooking loss (CL), total loss (TL), intramuscular fat (IMF), objective tenderness (shearing force – OT) and meat color. The meat color was determined by the Hunter lab system and the lightness (L), redness (A) and yellowness (B) were measured in specrophotometry. The chrome indexes and hue angle were then calculated c= (A2 + B2)1/2 and H= arctang B/A.
Table 1 shows the observations, means and standard deviations of these traits.
The DNA of the parental, F1 and F2 animals was extracted from their blood collected immediately after slaughter.
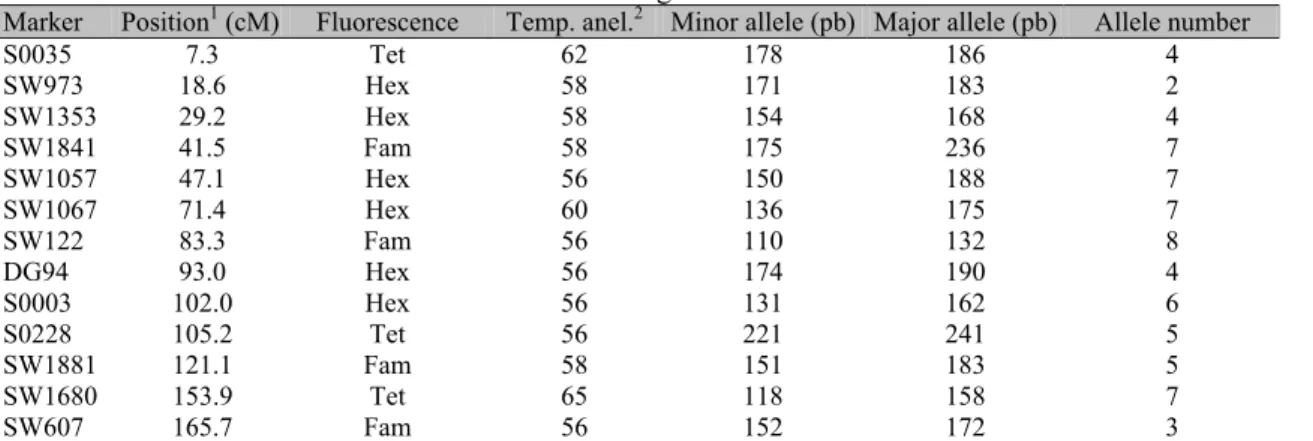
Primers were used to cover swine chromosome 6 at an average interval of 12.7cM. Table 2 shows the primers with some information specific to each one, such as location, fluorescence, size variation range in base pairs (pb) and number of alleles. PCR reactions were conducted as usually done in the laboratory, in a final volume of 10µl containing 25ng of genomic DNA.
Table 1. Number of observations, means and standard deviations for the carcass traits
Trait Unit Number of observations Mean Standard deviation
pH45 pH 543 6.4955 0.2636
pH24 pH 555 5.7098 0.1526
IMF % 504 1.5537 0.6375
DL % 557 3.1891 1.6861
CL % 550 32.6281 2.5292
TL % 439 34.2324 2.6646
OT kg 431 5550.6300 873.9267
L Absorb. 495 45.0064 2.0245
A Absorb. 485 0.6739 0.6024
B Absorb. 491 6.6191 0.5517
h Absorb. 416 84.0738 5.5618
c Absorb. 429 6.6973 0.5215
pH45: pH measured 45 minutes pos mortem; pH24: pH measured 24 hours pos mortem; IMF: intramuscular fat; DL: drip loss; CL: cooking loss; TL: total loss; OT: objective tenderness; L: lightness; A: redness; B: yellowness; h: hue angle; c: chroma.
Table 2. Primers used in swine chromosome 6 scanning
Marker Position1 (cM) Fluorescence Temp. anel.2 Minor allele (pb) Major allele (pb) Allele number
S0035 7.3 Tet 62 178 186 4
SW973 18.6 Hex 58 171 183 2
SW1353 29.2 Hex 58 154 168 4
SW1841 41.5 Fam 58 175 236 7
SW1057 47.1 Hex 56 150 188 7
SW1067 71.4 Hex 60 136 175 7
SW122 83.3 Fam 56 110 132 8
DG94 93.0 Hex 56 174 190 4
S0003 102.0 Hex 56 131 162 6
S0228 105.2 Tet 56 221 241 5
SW1881 121.1 Fam 58 151 183 5
SW1680 153.9 Tet 65 118 158 7
SW607 165.7 Fam 56 152 172 3
Fragment analyses were conducted by eletrophoresis using a ABI 377 genetic analyzer. The amplified polymorphic fragments were then detected and discriminated by the GeneScan program. Later, data were extracted and converted to an exit file by the Genotyper V 2.0 program.
Consensus distances of the swine linkage map were used (Rothschild, 2003). The QTL mapping was made by the QTL Express program (Seaton et al., 2002) that uses the regression by interval mapping method developed to outbreed crosses analysis (Haley et al., 1994).
The statistical model assumed that the QTL is dialelic with alternative fixed alleles in each parental breed (Haley et al., 1994). The QQ genotype was considered for the commercial animals with effect a, qq for the native animals with effect –a and Qq for the F1 animals with effect d. The probability of each F2 individual presenting each one of the three genotypes of the QTL was calculated conditionally to the markers, at 1cM intervals along the chromosome. These probabilities were used to make the regression of the traits in the additive and dominance coefficients of the QTL under study, for each animal.
The values of the F ratio were plotted and the points with the greatest values for the statistical test were presented with the most probable position of the QTL. The levels of significance (a=0.10, 0.05 or 0.01) along the chromosome were obtained by the permutation test (Churchill and Doerge, 1994) using a total of 10000 permutations for each trait. The permutation test was executed by the QTL Express program (Seaton et al., 2002) and levels of significance at 1% and 5% (significant QTL) and at 10% (suggestive QTL) levels of probability were used from the data of all the traits simultaneously.
The following statistical model was used:
ijkl i j k ijkl a d ijkl
y =S +B +H +(C −C)b+c a+c d+e , where
ijkl
y = phenotype;
i
S = fixed effect of sex i, i = 1 (castrate male), 2 (female);
j
B = fixed effect of batch j, j= 1, 2, 3, 4, 5;
H = fixed effect of PSS (halotane) genotype k,
b ) C C
( ijkl− = adjustment for the covariate age at
slaughter;
a
c and cd calculated as follows:
) qq ( P ) QQ ( P
ca = − and cd =P(Qq), where P(QQ)= probability of the QTL alleles being homozygote of commercial origin;
P(qq)= probability of the QTL alleles being homozygote of native origin;
P(Qq)= probability of the QTL alleles being heterozygote.
The previous model was used to estimate the regression of the phenotype in the coefficients
a
c and e cd varying the position of the QTL at each cM. An F-value was calculated for each position, comparing the model that considers the presence of the QTL (complete model) to the model without QTL (reduced model). The estimates for a and d were calculated as the best position estimated with the greatest corresponding F value.
RESULTS AND DISCUSSION
Table 3 shows a summary of the maximum F statistics and their positions (cM) for the putative QTL and the estimates of the additive and dominance effects with the respective standard deviations.
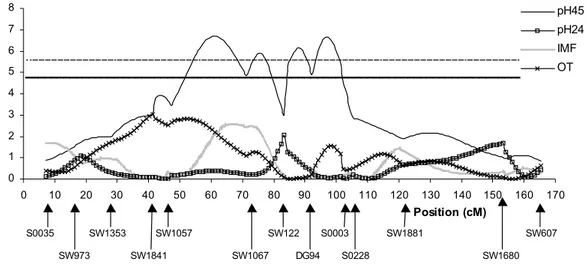
Fig. 1, 2 and 3 show the distribution of the F statistics along the chromosome and the curve peaks indicate the positions where the probable QTL are located in cM.
Table 3 and Fig. 1 show that no QTL was detected for pH24. The F statistic values were very low, Fmax = 2.06 located at 83cM, and not significant. Malek et al. (2001) performed a genomic scan to identify loci influencing economically important traits and detected QTL for pH24 on chromosomes 5, 14 and 15.
Significant QTL for pH24 was detected by Ovilo et al. (2002) on chromosome 3, when they studied the 18 swine autosome chromosomes. On the other hand, Andersson-Ekland et al. (1998), when using 236 markers to cover the 19 chromosomes, did not detect any significant QTL for pH24.
Table 3. Summary of the maximum F values and their positions (cM) for the QTL and respective estimates of the additive and dominance effects
Trait Position (cM) Fmax Additive effect (+ SE
1
) Dominance effect (+ SE)
pH45 61 6.71* 0.10113±0.0328 0.0827±0.0436
pH24 83 2.06 -0.0018±0.0155 -0.0377±0.0187
IMF 67 2.59 -0.0832±0.0652 -0.1482±0.0815
DL 41 3.03 103.0854±78.3866 247.4514±117.2985
CL 97 6.47* -0.5226±0.1530 -0.2218±0.2334
TL 18 1.47 -0.1731±0.2582 0.5864±0.3938
OT 96 2.43 -0.5619±0.2565 -0.0350±0.3878
L 153 3.22 -0.2728±0.1561 0.3938±0.2258
A 107 3.69 -0.0093±0.0499 0.2115±0.0778
B 126 3.55 -0.1217±0.0531 -0.0972±0.0892
h 108 3.40 0.0323±0.4658 -1.9389±0.7439
c 126 3.79 -0.1300±0.0503 -0.0694±0.0845
* = significant at 5% probability; 1 SE = standard deviation. pH45: pH measured 45 minutes pos morten; pH24: pH measured 24 hours pos morten; IMF: intramuscular fat; DL: drip loss; CL: cooking loss; TL: total loss; OT: objective tenderness; L: lightness; A: redness; B: yellowness; h: hue angle; c: chroma.
0 1 2 3 4 5 6 7 8
0 10 20 30 40 50 60 70 80 90 100 110 120 130 140 150 160 170 Position (cM)
F values
pH45
pH24
IMF
OT
SW973 SW1841 SW1067 DG94 S0228 SW1680 S0035 SW1353 SW1057 SW122 S0003 SW1881 SW607
0 1 2 3 4 5 6 7
0 10 20 30 40 50 60 70 80 90 100 110 120 130 140 150 160 170
Position (cM)
F values
DL CL
TL
SW973 SW1841 SW1067 DG94 S0228 SW1680 S0035 SW1353 SW1057 SW122 S0003 SW1881 SW607
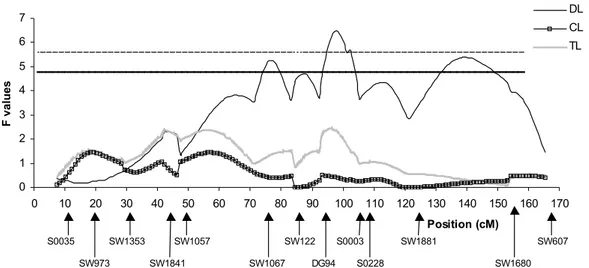
Figure 2. Estimates of the F statistics for drip loss (DL), cooking loss (CL) and total loss (TL). The horizontal lines indicate the levels of significance along the chromosome for significant QTL (5% = solid line) and suggestive QTL (10% = dashed line).
0 1 2 3 4 5 6
0 10 20 30 40 50 60 70 80 90 100 110 120 130 140 150 160 170
Postion (cM)
F values
L
A B
h c
SW973 SW1841 SW1067 DG94 S0228 SW1680 S0035 SW1353 SW1057 SW122 S0003 SW1881 SW607
Figure 3. F statistics estimates for lightness (L), redness (A), yellowness (B), chroma (c) and hue angle (h). The horizontal lines indicate the levels of significance along the chromosome for significant QTL (5% = solid line) and suggestive QTL (10% = dashed line).
No significant QTL was detected for intramuscular fat content (IMF) (Table 3 and Fig. 1). The F statistic values were very low (Fmax=2.59). These results were not in line with findings by Grindflek et al. (2001) and Ovilo et al. (2002) who located QTLs on chromosome 6 and by HARLIZIUS et al. (2000) who located
Significant QTL were detected for drip loss (DL) that presented three peaks, one significant and two suggestive (Fig. 2 and Table 3). The Fmax= 6.47 at 97cM was significant at 5% probability, and the other F values of the two peaks that indicated suggestive QTL (P<0.10) were 5.24 (77cM) and 5.38 (139cM). There is therefore evidence of three loci influencing the DL trait on SSC6. However, these peaks should be investigated in more detail, because they may be ghost QTL where the peaks arose from the significant peak (Fmax= 6.47 at 97cM). The peak presented at the 139cM region should also be studied more by placing more markers on the intervals between microsatellites SW1881 (121cM) and SW1680 (154cM). Malek et al., (2001) found significant QTL for drip loss on chromosomes 1, 2 and 11, and Andersson-Ekland et al. (1998) on chromosomes 1, 2 and 12.
Simultaneous analysis of Fig. 1 and 2 shows that there is coincidence of significant peaks and, or suggestive peaks for the F statistic for the pH45 and DL, in the regions close to 76, 88 and 97cM. These results suggest that the same group of genes may be acting on both traits, exercising therefore a pleiotropic effect. Benevenuto Junior (2001) reported high and significant (0.66) phenotypic correlation between pH45 and DL confirming the hypothesis of pleiotrophy as a source of genetic correlation and consequently phenotypic correlation.
The traits cooking loss (CL) and total loss (TL) presented very low F values, Fmax= 1.47 at 19cM and Fmax= 2.43 at 96cM, respectively. No significant or suggestive QTL were found for either traits. Studies were not found in the literature using these traits.
QTL were not detected for the traits related to meat color (Table 3 and Fig. 3). Wang et al. (1998) did not detect any QTL for color when investigating chromosomes 4 and 7 although subjective colors were used.
Lightness (L), redness (A) and yellowness (B) presented Fmax values equal to 3.22 (153cM), 3.69 (107cM) and 3.55 (126cM) respectively, but none were significant (P>0.10). Ovilo et al. (2002) also did not detect QTL for B in autosomic chromosomes scanning. However, they did detect significant QTL for L on
chromosomes 4 and 7, and for A on chromosomes 4 and 8.
No significant QTL were detected (P>0.10) for chroma (c) and hue angle (h) (Table 3 and Fig. 3) and the Fmax values were 3,40 (108cM) and 3.79 (126cM) respectively. Ovilo et al. (2002) did not report QTL for h and c either.
The F statistic for A and h (peaks at 106cM) and B and c (peaks at 126cM) are practically coincident. These results, although not significant, must have occurred because of the estimating method for C and h, obtained in function of A and B. Benevenuto Junior (2001) reported high and significant phenotypic correlation between A and h (0.98) and between B and c (0.88). Fig. 3 shows that these phenotypic correlations certainly have a strong genetic component.
CONCLUSIONS
Significant QTL were detected for the meat quality traits pH45 and DL. The same gene groups, located around 76, 88 and 97cM may be acting on the pH45 and DL traits. More markers should be included in the region of the significant F peaks where suggestive QTL were detected to confirm the presence of QTL.
ACKNOWLEDGEMENTS
The authors are grateful to USDA supported U.S. Pig Genome Coordination Project, for the contribution of the primers and to CNPq, CAPES and FAPEMIG for the financial support.
REFERENCES
ANDERSSON-EKLUND, L.; MARKLUND, L.; LUNDSTRÖM, K. et al. Mapping quantitative treit loci for carcass and meat quality traits in a Wild Boar × Large White intercross. J. Anim. Sci., v.76, p.694-700,1998.
2001. 93f. Dissertação (Mestrado) – Universidade Federal de Viçosa, Viçosa, MG.
CHURCHILL, G.A.; DOERGE, R.W. Empirical threshold values for quantitative trait mapping. Genetics, v.138, p.963-971, 1994.
GRINDFLEK, E.; SZYDA, J.; LIU, Z. et al. Detection of quantitative trait loci for meat quality in a commercial slaughter pig cross. Mamm. Genom., v. 12, p. 299-304, 2001.
HALEY, C.S.; KNOTT, S.A.; ELSEN, J.M. Mapping quantitative trait loci in crosses between outbred lines using least squares. Genetics, v.136, p.1195-1207, 1994.
HARLIZIUS, B.; RATTINK, P.; KONING, D.J. et al. The X Chromosome harbors quantitative trait loci for backfat thickness and intramuscular fat content in pigs. Mamm. Genom., v.11, p.800-802, 2000.
MALEK, M.; DEKKERS, C.M.J.; LEE, H.K. et al. A molecular genome scan analysis to identify chromosomal regions influencing economic traits in the pig. II. Meat and muscle composition. Mamm. Genom., v.12, p.637-645, 2001.
OVILO, C.; CLOP, A.; NOGUERA, J.L. et al. Quantitative trait locus for meat quality traits in
an Iberian × Landrace F2 pig population. J. Anim. Sci., v.80, p.2801-2808, 2002.
PIG genome mapping. [s.l.]: Roslin Institute, [200-]. Disponível em: <http://www.projects. roslin.ac.uk>. Acessado em: janeiro 15, 2003.
ROHRER, G.A.; KEELE, J.W. Identification of quantitative trait loci affecting carcass composition in swine: II - Muscling and wholesale product yield traits. J. Anim. Sci., v.76, p.2255-2262, 1998.
ROTHSCHILD, M.F. U.S. pig gene mapping
coordination program. Disponível em:
<http://www.genome.iastate.edu/pig>. Acessado em: janeiro 20, 2003.
SEATON, G.; HALEY, C.S.; KNOTT, S.A. et al. QTL express: mapping quantitative trait loci in simple and complex pedigrees.
Bioinformatics, v.18, p.339-340, 2002.
Disponível em: <http://qtl.cap.ed.ac.uk>. Acessado em: janeiro 21, 2003.
USER’S guide: statistics. Version 6. 4.ed. Cary, NC: SAS Institute, 1990.