ARTIGO ORIGINAL
Relevance and Utility Assessed by Health Professionals
Indicadores de Qualidade para Avaliar os Cuidados Clínicos
Prestados a Doentes com Infeção por VIH/SIDA: Relevância
e Utilidade Avaliadas por Profissionais de Saúde
1. Department of Health Information and Decision Sciences. Faculty of Medicine. University of Porto. Porto. Portugal. 2. Department of Pathology. Faculty of Medicine. Universidade Agostinho Neto. Luanda. Angola.
3. Center for Research in Health Technologies and Information Systems. University of Porto. Porto. Portugal.
4. Secção de Saúde Pública e Organizações de Saúde. Escola Nacional de Saúde Pública. Universidade NOVA de Lisboa. Lisboa. Portugal. 5. Department of Infectious Diseases. Faculty of Medicine. University of Porto. Porto. Portugal.
Autor correspondente: Emanuel Catumbela. [email protected]
Recebido: 03 de Março de 2015 - Aceite: 16 de Dezembro de 2015 | Copyright © Ordem dos Médicos 2016
Emanuel CATUMBELA1,2,3, Cristina SANTOS1,3, Alberto FREITAS1,3, Carlos COSTA4, António SARMENTO5,
Altamiro da Costa PEREIRA1,3
Acta Med Port 2016 Jun;29(6):389-400 ▪ http://dx.doi.org/10.20344/amp.6360
RESUMO
Introdução: Após a realização de uma revisão sistemática sobre indicadores de qualidade para avaliar os cuidados clínicos prestados
a doentes com infecção VIH/ SIDA, procuramos avaliar a relevância e utilidade clínica prática desses indicadores, do ponto de vista dos médicos especialistas em doenças infecciosas, incluindo VIH/ SIDA.
Material e Métodos: Este é um estudo observacional, transversal, em que foram selecionados, por conveniência, os médicos que
trabalham em um Departamento de Doenças Infecciosas de um hospital central, para responder a dois questionários, com um con-junto básico de indicadores, selecionando aqueles mais relevantes e úteis para a avaliação dos cuidados clínicos para avaliação do atendimento clínico prestado aos doentes com infeção por VIH/SIDA. A escala do tipo Likert foi utilizada para classificar os indicadores.
Resultados: Onze dos treze médicos preencheram os dois questionários. A partir da lista inicial de 53 indicadores de qualidade,
21 foram identificados como os mais relevantes e úteis para avaliar os cuidados clínicos prestados a doentes com infeção por VIH/ SIDA. A consistência interna para a relevância clínica, em cada domínio de indicadores foi quanto à relevância clínica – sinais clínicos
(p = 0,971), terapêutica (p = 0,900), prognóstico (p = 0,820) e diagnóstico (p = 0,733) e quanto à utilidade prática – diagnóstico (p = 0,934), sinais clínicos (p = 0,964), exames laboratoriais (p = 0,947), terapêutica (p = 0,583) e prognóstico (p = 0,368).
Discussão: No processo de avaliação da relevância clínica e utilidade prática dos indicadores de qualidade de cuidados prestados
a doentes com infeção por VIH/SIDA, descobrimos que a maioria dos médicos concorda que os indicadores dos domínios de diag-nóstico, sinais e sintomas clínicos são os mais importantes para avaliar a qualidade dos cuidados clínicos prestados a doentes com infeção por VIH/SIDA.
Conclusão: Este instrumento deve servir como uma ferramenta de diagnóstico, permitindo aos administradores hospitalares
identifi-car se os cuidados aos doentes com infeção por VIH/SIDA estão as ser devidamente prestados ou precisam de melhorias.
Palavras-chave: Assistência ao Doente; Garantia da Qualidade dos Cuidados de Saúde;Infecção por VIH; Indicadores de Qualidade
em Assistência à Saúde; Síndrome da Imunodeficiência Adquirida.
ABSTRACT
Introduction: After conducting a systematic review of quality indicators for assessing HIV/AIDS clinical care, we aimed to assess the
clinical relevance and practice utility of those indicators from the point of view of HIV/AIDS physician experts.
Material and Methods: This is an observational, cross-sectional study, in which we selected, by convenience, physicians who work in
an Infectious Disease Department of a central hospital to complete two questionnaires with a core set of indicators to establish the most relevant and useful indicators for assessment of the clinical HIV/AIDS care. A Likert scale was used to rank the indicators.
Results: Eleven of thirteen physicians filled two questionnaires. From the initial list of 53 quality indicators, 21 were identified as the
most relevant and useful in HIV/AIDS clinical care. The internal consistency for clinical relevance in each indicators domain was for clinical signs and symptoms (p = 0.971), for therapy (p = 0.900), for prognosis (p = 0.820) and diagnosis (p = 0.733) and for practice
utility were diagnosis (p = 0.934), clinical signs (p = 0.964), laboratory examinations (p = 0.947), therapy (p = 0.583) and prognosis (p = 0.368).
Discussion: In the process of assessing the clinical relevance and practice utility of HIV/AIDS quality care indicators, it was found
that the majority of physicians agreed that diagnosis and clinical symptoms and signs indicators domains are the most important for assessing the quality of care for HIV/AIDS patients.
Conclusion: This instrument should be considered as a diagnostic tool, allowing hospital administrators to identify if HIV/AIDS care is
properly delivered or needs improvement.
Keywords: Acquired Immunodeficiency Syndrome; HIV Infections; Patient Care; Quality Assurance, Health Care; Quality Indicators,
Health Care.
INTRODUCTION
The use of quality indicators in health care systems is one of the main concerns in the quality of health services. Several authors use quality indicators to document the
ARTIGO ORIGINAL
390
Revista Científica da Ordem dos Médicos www.actamedicaportuguesa.com
to health rising costs, poor quality and variations in practice, as well as the failure of health care markets1,2 The majority
of clinicians working in health facilities are being faced with the need to measure the quality of care. Hospitals face the challenge of collecting patients information, but the information is useful for producing accountability measures and promoting quality improvement.3 Many diseases have
measures that can be used to address the quality of care. Diseases such as stroke,4 Parkinson’s,5 asthma,6
non-small cell lung cancer,7 or breast cancer8 can be assessed
by quality of care indicators. Indicators can also be used to assess other health status components and care procedures, such as cardiovascular care,9 injury outcome,10
opioid treatment programs,11 and cancer care at the end of
life.12
Since the start of the HIV/AIDS epidemic, UNAIDS, CDC, and other partners have been concerned with the evaluation and monitoring of the HIV infection spread, treatment and prevention.13,14 For quality of care assessments, the core
set of indicators is mostly defined for community care15,16
with less emphasis on the hospital setting.17 Although there
are some indicators for assessing clinical care, these are mainly focused on structures and available resources,18 as
well as on consequences or related to HIV disease.19
In the indicator development process, one of the steps that developers have to pursue, after literature search for
the already-developed indicators, is the composition of a balanced consensus group and application of structured development procedures.20 In a previously published study,
a systematic review was conducted to select the published quality indicators for assessing HIV/AIDS hospital care.21
This work was aimed to assess the clinical relevance and practice utility of HIV/AIDS quality indicators for clinical care through HIV/AIDS physician experts.
MATERIAL AND METHODS
This is an observational, cross-sectional study, about the relevance and utility of HIV/AIDS quality indicators for the assessment of clinical care from the point of view of HIV clinical experts (infectious diseases physicians).
It were selected, by convenience, physicians who work in an Infectious Diseases Department at a central hospital in Porto (in the north of Portugal). During the Department meeting it was explained the aim and goal of this study to all 11 physicians present, and all accepted to participate. The Department of Infectious Diseases has a centre of daily care for HIV patients, which has an average of 7000 visits per year and follows 2 300 patients; 1 900 patients are on treatment and the centre receives an average of 10 HIV/ AIDS new patients per week. The centre has 27 beds in the infirmary and 6 beds in the intensive care unit.
Selection criteria: infectious diseases physicians and
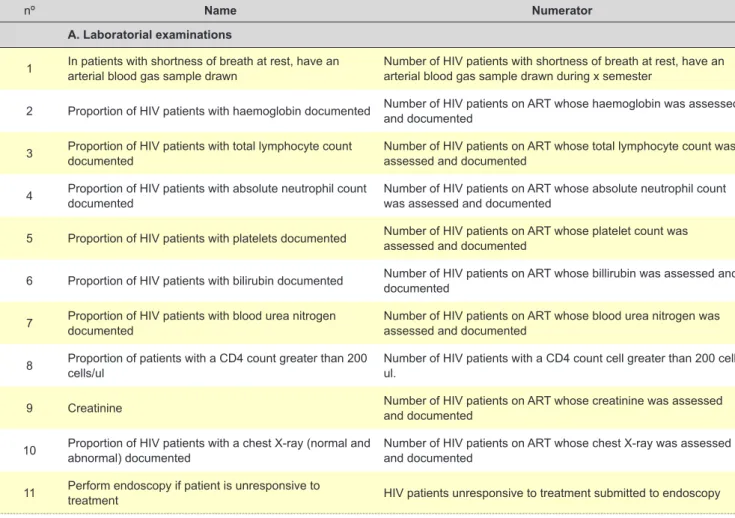
Table 1 - HIV/AIDS Quality Indicators according to name, numerator and denominator (part I of III)
nº Name Numerator
A. Laboratorial examinations
1 In patients with shortness of breath at rest, have an
arterial blood gas sample drawn Number of HIV patients with shortness of breath at rest, have an arterial blood gas sample drawn during x semester Number of HIV patients cared for in the intensive unit Hospitalized/ as indicated
2 Proportion of HIV patients with haemoglobin documented Number of HIV patients on ART whose haemoglobin was assessed
and documented Number of HIV patients hospital admitted to the hospital All HIV patients/ 3 - 6 m
3 Proportion of HIV patients with total lymphocyte count
documented Number of HIV patients on ART whose total lymphocyte count was assessed and documented Number of HIV patients hospital admitted to the hospital All HIV patients/ 3 - 6 m
4 Proportion of HIV patients with absolute neutrophil count
documented Number of HIV patients on ART whose absolute neutrophil count was assessed and documented Number of HIV patients hospital admitted to the hospital All HIV patients/ 3 - 6 m
5 Proportion of HIV patients with platelets documented Number of HIV patients on ART whose platelet count was
assessed and documented Number of HIV patients hospital admitted to the hospital All HIV patients/ 3 - 6 m
6 Proportion of HIV patients with bilirubin documented Number of HIV patients on ART whose billirubin was assessed and documented Number of HIV patients hospital admitted to the hospital All HIV patients/ 3 - 6 m
7 Proportion of HIV patients with blood urea nitrogen documented Number of HIV patients on ART whose blood urea nitrogen was assessed and documented Number of HIV patients hospital admitted to the hospital All HIV patients/ 3 - 6 m
8 Proportion of patients with a CD4 count greater than 200
cells/ul Number of HIV patients with a CD4 count cell greater than 200 cell/ul. Number of HIV patients hospital admitted to the hospital All HIV patients/ annually
9 Creatinine Number of HIV patients on ART whose creatinine was assessed
and documented Number of HIV patients hospital admitted to the hospital All HIV patients/ 3 - 6 m
10 Proportion of HIV patients with a chest X-ray (normal and abnormal) documented Number of HIV patients on ART whose chest X-ray was assessed and documented Number of HIV patients hospital admitted to the hospital All HIV patients/ 3 - 6 m
ARTIGO ORIGINAL
infectious disease residents working in the department of infectious diseases for more than one year caring for patients with HIV infection and who voluntarily agreed to participate in the study. Exclusion criteria: doctors who did not fill out the questionnaire. The refusal rate was zero and valid questionnaire rate for the clinical relevance questionnaire was 82% and for practice utility was 100%. Data collect instrument: Two questionnaires were used with the same indicators structure in domains. The domains were constructed based on the function of the indicators, or on what they assess. So, if one indicator was used for the assessment of the clinical signs and symptoms we gathered them in the domain “clinical signs and symptoms”, if it was for laboratory tests, we gathered in this domain, and so on. So the domains were named according to the function of clinical care used in the medical nomenclature. As such 5 domains were defined. The first, “laboratory and examinations”, includes indicators that assess the laboratory tests and/ or radiology examinations. The second, “clinical signs and symptoms” includes patients complaints (symptoms) or the objective findings (signs). The third domain is “diagnosis”, where indicators for the screening of specific conditions, such as opportunistic diseases that evidence advanced HIV infections; there are also conditions that the physicians must always screen. The fourth domain is “therapy”, where care indicators were included, not only to assess the effects
of therapy but also to assess the interventions made. The fifth domain is “prognosis” where the effects of all care in future were assessed, whether the result was the expected or not. The borders of these domains are not well defined because some of the indicators can be moved from one domain to another; therefore this model was used to easily handle all the indicators.
Data collection: Two questionnaires were constructed with 53 indicator topics selected from a previous systematic literature review21-25 (Table 1). The purpose of one
questionnaire was to assess the physician’s point of view of the clinical relevance and the other one was to assess the physician’s point of view on the practice utility of those indicators. Clinical relevance was defined as the extent of the information obtained through this quality indicator for understanding the quality of care provided to HIV/ AIDS patients in the hospital setting. Practice utility refers to how easy it is to use indicators to assess the everyday
care given to HIV/AIDS patients in the hospital setting and might improve care. Before use, both questionnaires were validated by two physicians, that found five questions that were not clear and were corrected. After explaining the aim of this study at the meeting to the 11 physicians, self-administered questionnaires as one brochure were distributed and one week later, the questionnaires were collected.
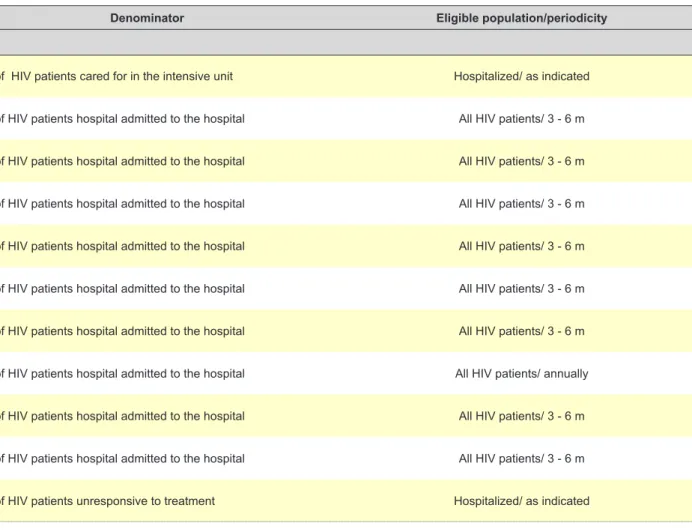
Table 1 - HIV/AIDS Quality Indicators according to name, numerator and denominator (part I of III)
Denominator Eligible population/periodicity
In patients with shortness of breath at rest, have an
arterial blood gas sample drawn Number of HIV patients with shortness of breath at rest, have an arterial blood gas sample drawn during x semester Number of HIV patients cared for in the intensive unit Hospitalized/ as indicated
Proportion of HIV patients with haemoglobin documented Number of HIV patients on ART whose haemoglobin was assessed and documented Number of HIV patients hospital admitted to the hospital All HIV patients/ 3 - 6 m
Proportion of HIV patients with total lymphocyte count
documented Number of HIV patients on ART whose total lymphocyte count was assessed and documented Number of HIV patients hospital admitted to the hospital All HIV patients/ 3 - 6 m
Proportion of HIV patients with absolute neutrophil count
documented Number of HIV patients on ART whose absolute neutrophil count was assessed and documented Number of HIV patients hospital admitted to the hospital All HIV patients/ 3 - 6 m
Proportion of HIV patients with platelets documented Number of HIV patients on ART whose platelet count was assessed and documented Number of HIV patients hospital admitted to the hospital All HIV patients/ 3 - 6 m
6 Proportion of HIV patients with bilirubin documented Number of HIV patients on ART whose billirubin was assessed and documented Number of HIV patients hospital admitted to the hospital All HIV patients/ 3 - 6 m
7 Proportion of HIV patients with blood urea nitrogen documented Number of HIV patients on ART whose blood urea nitrogen was assessed and documented Number of HIV patients hospital admitted to the hospital All HIV patients/ 3 - 6 m
Proportion of patients with a CD4 count greater than 200
cells/ul Number of HIV patients with a CD4 count cell greater than 200 cell/ul. Number of HIV patients hospital admitted to the hospital All HIV patients/ annually
Creatinine Number of HIV patients on ART whose creatinine was assessed and documented Number of HIV patients hospital admitted to the hospital All HIV patients/ 3 - 6 m
10 Proportion of HIV patients with a chest X-ray (normal and abnormal) documented Number of HIV patients on ART whose chest X-ray was assessed and documented Number of HIV patients hospital admitted to the hospital All HIV patients/ 3 - 6 m
Perform endoscopy if patient is unresponsive to
ARTIGO ORIGINAL
B. Clinical signs and symptoms
12 Admission body mass index Number of HIV patients whose weight was assessed on admission and registered in the chart Number of HIV patients hospital admitted to the hospital All HIV patients/ annually
13 Discuss weight loss with the patient Number of HIV patients whose weight was discussed during the
last visit Number of HIV patients seen in the last visit All HIV patients/ 3 - 6 m
14 Proportion of HIV patients with weight loss Number of HIV patients whose weight was assessed in the last visit and showed weight loss. Number of HIV patients seen in the last visit All HIV patients/ annually
15 Proportion of HIV patients with weight gain Number of HIV patients whose weight was assessed in the last
visit and showed weight gain Number of HIV patients seen in the last visit All HIV patients/ annually
16 Febrile hospital days (after onset of therapy) Number of days febrile HIV patients were in the hospital after onset of therapy before fever was documented Number of HIV patients hospital admitted to the hospital Hospitalized/ as indicated
17 Proportion of HIV patients with CNS1 change Number of HIV patients who have a registered CNS change
(worsened) Number of HIV patients attended to at the hospital Hospitalized/ as indicated
18 Proportion of HIV patients with complicated cough Number of HIV patients with CD4 < 350 cell/ul who have complicated cough Number of HIV patients with CD4 < 350 cell/ul who were attended to All HIV patients/ 3 - 6 m
19 Proportion of HIV patients with diarrhoea Number of HIV patients with CD4 < 350 cell/ul who have diarrhoea Number of HIV patients with CD4 < 350 cell/ul who were attended to All HIV patients/ 3 - 6 m
20 Proportion of HIV patients with lungs examined Number of HIV patients with lung examination documented Number of HIV patients hospital admitted to the hospital All HIV patients/ 3 - 6 m
21 Monitor the patient´s weight Number of HIV patients with weight documented Number of HIV patients hospital admitted to the hospital All HIV patients/ 3 - 6 m
Table 1 - HIV/AIDS Quality Indicators according to name, numerator and denominator (part II of III)
nº Name Numerator
C. Diagnosis/ follow-up
22 Cervical cancer screening Number of HIV patients who were screened for cervical cancer in
the last year Number of HIV patients seen last year All HIV patients/ annually
23 Hepatitis C screening Number of HIV patients who were screened for hepatitis C in the
last year Number of HIV patients seen last year All HIV patients/ annually
24 Tuberculosis screening Number of HIV patients who have received documented screening
for tuberculosis infection with any approved test. Number of HIV patients not known to be infected with TB All HIV patients/ annually
25 Influenza vaccination Number of HIV patients who received an influenza vaccination in
the last year Number of HIV patients seen in the last year All HIV patients/ annually
26 P jiroveci pneumonia prophylaxis Number of HIV patients with CD4 < 350 cell/ul who received jiroveci pneumonia prophylaxis last year P Number of HIV patients seen in the last year All HIV patients/ annually
27 Non-detectable HIV viral load Number of HIV patients with an undetectable viral load after 48 weeks of ART Number of HIV patients who were enrolled in ART All HIV patients/ annually
28 Proportion of patients who had a CD4 count measured at
least once during the last 6 months Number of HIV patients who had a CD4 count measured at least once during the last year Number of HIV patients who were enrolled in ART All HIV patients/ annually
29 Proportion of patients with continued care Number of HIV patients who had at least 2 hospital visit last year Number of HIV patients who were enrolled in care All HIV patients/ annually
30 HIV prevalence among pregnant women Number of pregnant women with an HIV positive test in the last year Number of pregnant women screened for HIV All pregnant women/ annually
31 Percent of HIV-positive patients who were screened for
ARTIGO ORIGINAL
Admission body mass index Number of HIV patients whose weight was assessed on admission and registered in the chart Number of HIV patients hospital admitted to the hospital All HIV patients/ annually
Discuss weight loss with the patient Number of HIV patients whose weight was discussed during the last visit Number of HIV patients seen in the last visit All HIV patients/ 3 - 6 m
Proportion of HIV patients with weight loss Number of HIV patients whose weight was assessed in the last visit and showed weight loss. Number of HIV patients seen in the last visit All HIV patients/ annually
Proportion of HIV patients with weight gain Number of HIV patients whose weight was assessed in the last visit and showed weight gain Number of HIV patients seen in the last visit All HIV patients/ annually
16 Febrile hospital days (after onset of therapy) Number of days febrile HIV patients were in the hospital after onset of therapy before fever was documented Number of HIV patients hospital admitted to the hospital Hospitalized/ as indicated
17 Proportion of HIV patients with CNS change Number of HIV patients who have a registered CNS change (worsened) Number of HIV patients attended to at the hospital Hospitalized/ as indicated
Proportion of HIV patients with complicated cough Number of HIV patients with CD4 < 350 cell/ul who have complicated cough Number of HIV patients with CD4 < 350 cell/ul who were attended to All HIV patients/ 3 - 6 m
Proportion of HIV patients with diarrhoea Number of HIV patients with CD4 < 350 cell/ul who have diarrhoea Number of HIV patients with CD4 < 350 cell/ul who were attended to All HIV patients/ 3 - 6 m
20 Proportion of HIV patients with lungs examined Number of HIV patients with lung examination documented Number of HIV patients hospital admitted to the hospital All HIV patients/ 3 - 6 m
Monitor the patient´s weight Number of HIV patients with weight documented Number of HIV patients hospital admitted to the hospital All HIV patients/ 3 - 6 m
Table 1 - HIV/AIDS Quality Indicators according to name, numerator and denominator (part II of III)
Denominator Eligible population/periodicity
Cervical cancer screening Number of HIV patients who were screened for cervical cancer in the last year Number of HIV patients seen last year All HIV patients/ annually
Hepatitis C screening Number of HIV patients who were screened for hepatitis C in the last year Number of HIV patients seen last year All HIV patients/ annually
Tuberculosis screening Number of HIV patients who have received documented screening for tuberculosis infection with any approved test. Number of HIV patients not known to be infected with TB All HIV patients/ annually
Influenza vaccination Number of HIV patients who received an influenza vaccination in the last year Number of HIV patients seen in the last year All HIV patients/ annually
26 P jiroveci pneumonia prophylaxis Number of HIV patients with CD4 < 350 cell/ul who received pneumonia prophylaxis last year Number of HIV patients seen in the last year All HIV patients/ annually
27 Non-detectable HIV viral load Number of HIV patients with an undetectable viral load after 48 weeks of ART Number of HIV patients who were enrolled in ART All HIV patients/ annually
Proportion of patients who had a CD4 count measured at
least once during the last 6 months Number of HIV patients who had a CD4 count measured at least once during the last year Number of HIV patients who were enrolled in ART All HIV patients/ annually
Proportion of patients with continued care Number of HIV patients who had at least 2 hospital visit last year Number of HIV patients who were enrolled in care All HIV patients/ annually
30 HIV prevalence among pregnant women Number of pregnant women with an HIV positive test in the last year Number of pregnant women screened for HIV All pregnant women/ annually
Percent of HIV-positive patients who were screened for
ARTIGO ORIGINAL
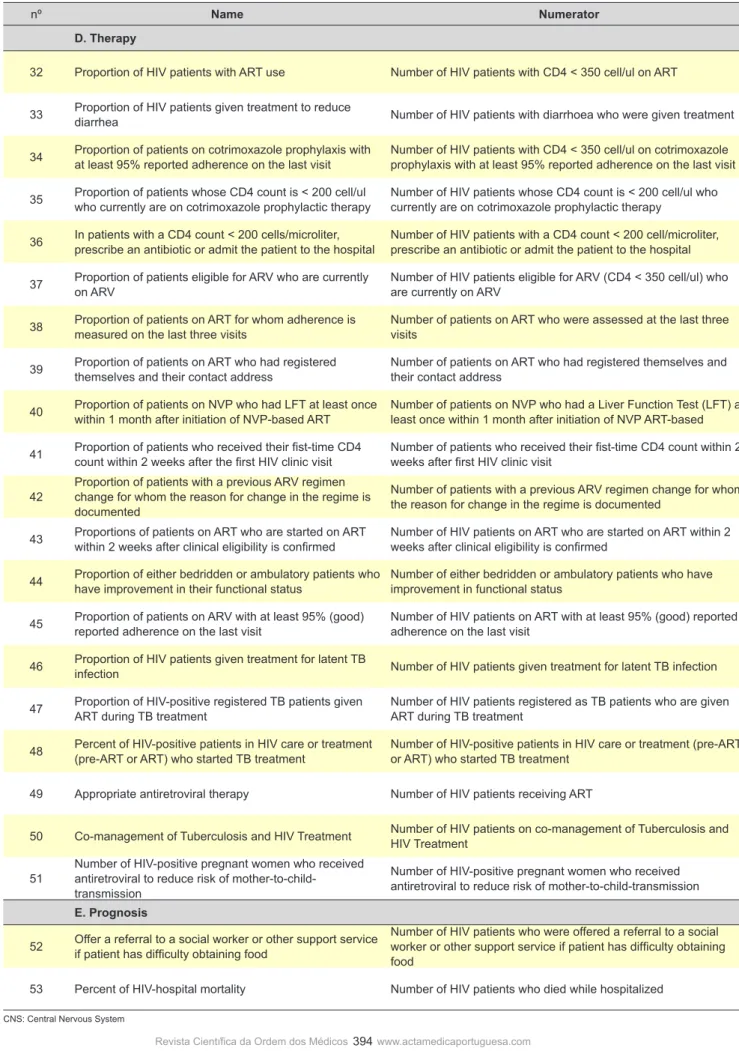
Table 1 - HIV/AIDS Quality Indicators according to name, numerator and denominator (part III of III)
nº Name Numerator
D. Therapy
32 Proportion of HIV patients with ART use Number of HIV patients with CD4 < 350 cell/ul on ART Number of HIV patients with CD4 < 350 cell/ul All HIV patients/ annually
33 Proportion of HIV patients given treatment to reduce diarrhea Number of HIV patients with diarrhoea who were given treatment Number of HIV patients receiving care All HIV patients/ annually
34 Proportion of patients on cotrimoxazole prophylaxis with
at least 95% reported adherence on the last visit Number of HIV patients with CD4 < 350 cell/ul on cotrimoxazole prophylaxis with at least 95% reported adherence on the last visit Number of HIV patients with CD4 < 350 cell/ul on cotrimoxazole prophylaxis last year annually
35 Proportion of patients whose CD4 count is < 200 cell/ul who currently are on cotrimoxazole prophylactic therapy Number of HIV patients whose CD4 count is < 200 cell/ul who currently are on cotrimoxazole prophylactic therapy Number of HIV patients whose CD4 < 200 cell/ul All HIV patients/ annually
36 In patients with a CD4 count < 200 cells/microliter, prescribe an antibiotic or admit the patient to the hospital Number of HIV patients with a CD4 count < 200 cell/microliter, prescribe an antibiotic or admit the patient to the hospital Number of HIV patients with a CD4 count < 200 cell/ul All HIV patients/ annually
37 Proportion of patients eligible for ARV who are currently on ARV Number of HIV patients eligible for ARV (CD4 < 350 cell/ul) who are currently on ARV Number of HIV patients who had CD4 < 350 cell/ul All HIV patients/ annually
38 Proportion of patients on ART for whom adherence is
measured on the last three visits Number of patients on ART who were assessed at the last three visits Number of HIV patients who are currently on ART All HIV patients on ART/ annually
39 Proportion of patients on ART who had registered
themselves and their contact address Number of patients on ART who had registered themselves and their contact address Number of HIV patients on ART All HIV patients/ annually
40 Proportion of patients on NVP who had LFT at least once within 1 month after initiation of NVP-based ART Number of patients on NVP who had a Liver Function Test (LFT) at least once within 1 month after initiation of NVP ART-based Number of HIV patients who start ART All HIV patients on ART/ annually
41 Proportion of patients who received their fist-time CD4
count within 2 weeks after the first HIV clinic visit Number of patients who received their fist-time CD4 count within 2 weeks after first HIV clinic visit Number of HIV patients enrolled to HIV care All HIV patients/ annually
42
Proportion of patients with a previous ARV regimen change for whom the reason for change in the regime is documented
Number of patients with a previous ARV regimen change for whom
the reason for change in the regime is documented Number of HIV patients whose ART was changed All HIV patients/ annually
43 Proportions of patients on ART who are started on ART
within 2 weeks after clinical eligibility is confirmed Number of HIV patients on ART who are started on ART within 2 weeks after clinical eligibility is confirmed Number of HIV patients on ART enrolled in HIV care All HIV patients/ annually
44 Proportion of either bedridden or ambulatory patients who
have improvement in their functional status Number of either bedridden or ambulatory patients who have improvement in functional status Number of HIV patients on ART with dysfunctional status All HIV patients/ annually
45 Proportion of patients on ARV with at least 95% (good) reported adherence on the last visit Number of HIV patients on ART with at least 95% (good) reported adherence on the last visit Number of HIV patients on ART All HIV patients on ART/ annually
46 Proportion of HIV patients given treatment for latent TB infection Number of HIV patients given treatment for latent TB infection Number of HIV patients currently in care All HIV patients/ 6 m
47 Proportion of HIV-positive registered TB patients given ART during TB treatment Number of HIV patients registered as TB patients who are given ART during TB treatment Number of HIV patients with TB All HIV patients/ 6 m
48 Percent of HIV-positive patients in HIV care or treatment
(pre-ART or ART) who started TB treatment Number of HIV-positive patients in HIV care or treatment (pre-ART or ART) who started TB treatment Number of HIV-positive patients in HIV care or treatment (pre-ART or ART) All HIV patients/ 6 m
49 Appropriate antiretroviral therapy Number of HIV patients receiving ART Number of patients prescribed at least three ARV agents All HIV patients/ 6 m
50 Co-management of Tuberculosis and HIV Treatment Number of HIV patients on co-management of Tuberculosis and HIV Treatment Number of HIV patients receiving care All HIV patients/ annually
51
Number of HIV-positive pregnant women who received antiretroviral to reduce risk of
mother-to-child-transmission
Number of HIV-positive pregnant women who received
antiretroviral to reduce risk of mother-to-child-transmission Number of HIV-positive pregnant women attended All pregnant women/ annually
E. Prognosis
52 Offer a referral to a social worker or other support service if patient has difficulty obtaining food
Number of HIV patients who were offered a referral to a social worker or other support service if patient has difficulty obtaining
food Number of HIV patients seen last year All HIV patients/ annually
53 Percent of HIV-hospital mortality Number of HIV patients who died while hospitalized Number of HIV patients attended last year who were hospitalized All HIV patients/ annually
ARTIGO ORIGINAL Table 1 - HIV/AIDS Quality Indicators according to name, numerator and denominator (part III of III)
Denominator Eligible population/periodicity
Proportion of HIV patients with ART use Number of HIV patients with CD4 < 350 cell/ul on ART Number of HIV patients with CD4 < 350 cell/ul All HIV patients/ annually
Proportion of HIV patients given treatment to reduce
diarrhea Number of HIV patients with diarrhoea who were given treatment Number of HIV patients receiving care All HIV patients/ annually
Proportion of patients on cotrimoxazole prophylaxis with
at least 95% reported adherence on the last visit Number of HIV patients with CD4 < 350 cell/ul on cotrimoxazole prophylaxis with at least 95% reported adherence on the last visit Number of HIV patients with CD4 < 350 cell/ul on cotrimoxazole prophylaxis last year annually
Proportion of patients whose CD4 count is < 200 cell/ul
who currently are on cotrimoxazole prophylactic therapy Number of HIV patients whose CD4 count is < 200 cell/ul who currently are on cotrimoxazole prophylactic therapy Number of HIV patients whose CD4 < 200 cell/ul All HIV patients/ annually
36 In patients with a CD4 count < 200 cells/microliter, prescribe an antibiotic or admit the patient to the hospital Number of HIV patients with a CD4 count < 200 cell/microliter, prescribe an antibiotic or admit the patient to the hospital Number of HIV patients with a CD4 count < 200 cell/ul All HIV patients/ annually
37 Proportion of patients eligible for ARV who are currently on ARV Number of HIV patients eligible for ARV (CD4 < 350 cell/ul) who are currently on ARV Number of HIV patients who had CD4 < 350 cell/ul All HIV patients/ annually
Proportion of patients on ART for whom adherence is
measured on the last three visits Number of patients on ART who were assessed at the last three Number of HIV patients who are currently on ART All HIV patients on ART/ annually
Proportion of patients on ART who had registered
themselves and their contact address Number of patients on ART who had registered themselves and their contact address Number of HIV patients on ART All HIV patients/ annually
40 Proportion of patients on NVP who had LFT at least once within 1 month after initiation of NVP-based ART Number of patients on NVP who had a Liver Function Test (LFT) at least once within 1 month after initiation of NVP ART-based Number of HIV patients who start ART All HIV patients on ART/ annually
Proportion of patients who received their fist-time CD4
count within 2 weeks after the first HIV clinic visit Number of patients who received their fist-time CD4 count within 2 weeks after first HIV clinic visit Number of HIV patients enrolled to HIV care All HIV patients/ annually Proportion of patients with a previous ARV regimen
change for whom the reason for change in the regime is documented
Number of patients with a previous ARV regimen change for whom
the reason for change in the regime is documented Number of HIV patients whose ART was changed All HIV patients/ annually
Proportions of patients on ART who are started on ART
within 2 weeks after clinical eligibility is confirmed Number of HIV patients on ART who are started on ART within 2 weeks after clinical eligibility is confirmed Number of HIV patients on ART enrolled in HIV care All HIV patients/ annually
Proportion of either bedridden or ambulatory patients who
have improvement in their functional status Number of either bedridden or ambulatory patients who have improvement in functional status Number of HIV patients on ART with dysfunctional status All HIV patients/ annually
Proportion of patients on ARV with at least 95% (good)
reported adherence on the last visit Number of HIV patients on ART with at least 95% (good) reported adherence on the last visit Number of HIV patients on ART All HIV patients on ART/ annually
46 Proportion of HIV patients given treatment for latent TB infection Number of HIV patients given treatment for latent TB infection Number of HIV patients currently in care All HIV patients/ 6 m
47 Proportion of HIV-positive registered TB patients given ART during TB treatment Number of HIV patients registered as TB patients who are given ART during TB treatment Number of HIV patients with TB All HIV patients/ 6 m
Percent of HIV-positive patients in HIV care or treatment
(pre-ART or ART) who started TB treatment Number of HIV-positive patients in HIV care or treatment (pre-ART or ART) who started TB treatment Number of HIV-positive patients in HIV care or treatment (pre-ART or ART) All HIV patients/ 6 m
Appropriate antiretroviral therapy Number of HIV patients receiving ART Number of patients prescribed at least three ARV agents All HIV patients/ 6 m
50 Co-management of Tuberculosis and HIV Treatment Number of HIV patients on co-management of Tuberculosis and HIV Treatment Number of HIV patients receiving care All HIV patients/ annually
Number of HIV-positive pregnant women who received antiretroviral to reduce risk of
mother-to-child-transmission
Number of HIV-positive pregnant women who received
antiretroviral to reduce risk of mother-to-child-transmission Number of HIV-positive pregnant women attended All pregnant women/ annually
Offer a referral to a social worker or other support service if patient has difficulty obtaining food
Number of HIV patients who were offered a referral to a social worker or other support service if patient has difficulty obtaining
food Number of HIV patients seen last year All HIV patients/ annually
ARTIGO ORIGINAL
396
Revista Científica da Ordem dos Médicos www.actamedicaportuguesa.com
In both questionnaires, a Likert scale to establish the most relevant and the most useful indicators for assessing the clinical care was used. The Likert scale had the following response options: 0 = without opinion; 1 = not relevant/not useful; 2 = less relevant/less useful; 3 = relevant/useful; 4 = more relevant/more useful. The 53 quality indicators (Table 1) are related to the following five different clinical domains: laboratory examinations (n = 11); clinical signs and symptoms (n = 10); diagnosis/follow-up (n = 10); therapy (n = 20); and prognosis (n = 2).
Statistical analysis
A database on SPSS (Statistical Package for Social Sciences) was created with data collected from questionnaires. The median was used to obtain the most relevant and effective quality indicators for assessing HIV/ AIDS clinical care. All indicators that had a median equal to four for both classes (clinical relevance and practice utility) and that were not classified as “not relevant” or “not useful” by a single expert, were taken as a consensus quality indicator for clinical care assessment.
Cronbach’s alpha coefficients test was used to measure the consistency of indicators in each domain. In order to do it, the median score for each of the five domains was calculated based on the score of each indicator within each domain. Cronbach’s alpha was categorized with the following rules that were proposed by George and Mallery26: > 0.9
excellent; > 0.8 good; > 0.7 acceptable; > 0.6 questionable; > 0.5 poor and < 0.5 unacceptable reliability. To assess the strength of the relationship between the results from the clinical relevance and practice utility inquiries of each quality indicator and for each indicator domain, Kendall´s tau B rank correlation coefficients were calculated.
Ethics
This study is part of a research project for the development and application of a model of indicators to
assess the quality of clinical care provided to patients with HIV/AIDS, which was approved by the Ethics Committee of the Hospital Sao João, Porto. Oral informed consent was also obtained from the participants. The procedures followed in this study are in accordance with ethical principles published on Helsinki Declaration of 1975, revised in 2008, on human experimentation.27
RESULTS
The two questionnaires were administered to 11 of 13 physicians (Infectious disease specialists) who work in an Infectious Diseases Department at a central hospital in Porto; two of them were not present at the time of the questionnaire administration. Only nine physicians responded to the clinical relevance questionnaire and eleven to practice utility. The response rate for the clinical relevance questionnaire was 82% and for practice utility was 100%.
Clinical Relevance and Practice Utility
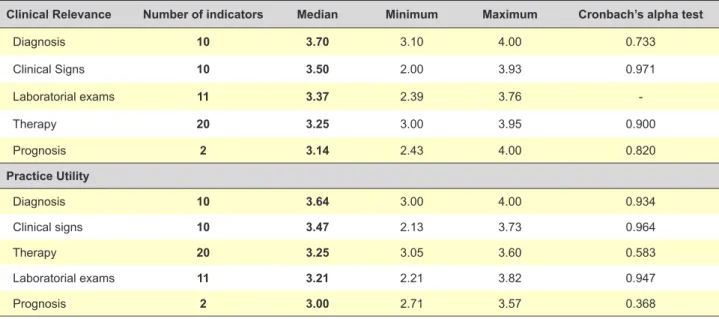
Although an assessment of the individual indicators was performed, the results presented here have already been grouped into domains. For clinical relevance, the indicators of the diagnosis domain were evaluated and a median was obtained [minimum and maximum value] of 3.70 [3.10 – 4.00], the clinical signs domain was 3.50 [2.00 - 3.93], the laboratory examination domain was 3.37 [2.39 - 3.95], the therapy domain was 3.25 [3.00 – 3.95] and prognostic domain was 3.14 [2.43 - 4.00] out of a maximum of 4 points. For practical utility, the results for the indicators were 3.64 [3.00 – 4.00], 3.47 [2.13 - 3.73], 3.25 [3.05 - 3.60], 3.21 [2.21 - 3.82] and 3.00 [2.71 – 3.57], respectively (Table 2). Physicians considered the domain diagnosis to have the most relevant and useful indicators out of the five different clinical domains, followed by clinical signs and symptoms. The prognosis domain was considered to be the least relevant and useful (Table 2).
Table 2 - Summary of measures of quality indicators for HIV/AIDS clinical care and Internal domain consistency on clinical relevance and practice utility
Clinical Relevance Number of indicators Median Minimum Maximum Cronbach’s alpha test
Diagnosis 10 3.70 3.10 4.00 0.733
Clinical Signs 10 3.50 2.00 3.93 0.971
Laboratorial exams 11 3.37 2.39 3.76
Therapy 20 3.25 3.00 3.95 0.900
Prognosis 2 3.14 2.43 4.00 0.820
Practice Utility
Diagnosis 10 3.64 3.00 4.00 0.934
Clinical signs 10 3.47 2.13 3.73 0.964
Therapy 20 3.25 3.05 3.60 0.583
Laboratorial exams 11 3.21 2.21 3.82 0.947
ARTIGO ORIGINAL
Reliability of the responses to the questionnaires
For most of the domains, the internal consistency of indicators is acceptable and, in some domains, excellent. Actually, for clinical relevance, the results show that the clinical signs (p = 0.971) and therapy (p = 0.900)
have excellent internal consistency, while prognosis has good consistency (p = 0.820) and diagnosis acceptable
consistency (p = 0.733). For practice utility, the results show
that diagnosis (p = 0.934), clinical signs (p = 0.964) and
laboratory examinations (p = 0.947) have excellent internal
consistency, therapy has poor consistency (p = 0.583), and
the consistency is unacceptable only for prognosis (p =
0.368) (Table 3).
Inter domain correlations
The Kendall´s tau B rank correlation (Table3) shows that, for clinical relevance, there are significant correlations between the “clinical signs and symptoms” and other domains, such as diagnosis [0.647], therapy [0.692] and prognosis [0.667]. Additionally, correlations between “laboratorial examinations” and clinical signs [0.648], diagnosis [0.530] and therapy [0.486] were found. For practice utility, significant correlations only between the domain “Laboratorial examinations” and both clinical signs and symptoms [0.647] and diagnosis [0.629] were found; for all of the aforementioned correlations, the p-value was <
0.001.
From the initial list of 53 quality indicators, 21 were chosen; indicators with median score of 4 points (maximum agreement) in both questionnaires were selected as the most clinically relevant and useful for assessing the quality of HIV clinical care (Table 4). The final list included indicators for all domains, except for prognosis; no single prognosis indicator reached a median of 4 points.
DISCUSSION
The purpose of our study was to find the clinical relevance and practice utility of HIV/AIDS quality indicators for clinical care assessment according to HIV/AIDS experts who routinely produce the indicator data and use those measures to assess HIV/AIDS hospital care. This paper reports on an early step towards formalizing the development and validation of a set of HIV/AIDS hospital care quality indicators.
In the process of assessing the clinical relevance and practice utility of HIV/AIDS quality care indicators, we discovered that the majority of physicians agreed that diagnosis and clinical symptoms and signs indicators domain are the most important for assessing the quality of care of HIV/AIDS patients. According to the physicians, prognosis indicators are the least important. Prognosis relies on a variety of factors that are not limited to the clinical care setting. Nevertheless, prognosis is not an issue to be ignored in assessing the quality of care. Some studies have shown that a significant proportion of patients attending HIV clinics miss important components of care, even those that are recommended by national guidelines,18 which worsens
their prognosis.28
Considering the opinions of physicians on the correlation of indicators between the domains, it was found that indicators of clinical signs and symptoms are correlated to all other indicators in clinical relevance. The clinical signs and symptoms indicators are critical to evaluate the problems (diagnosis) and to all clinical care. On the other hand, considering practice utility, correlation of laboratory examinations with clinical signs and symptoms and diagnosis is according to the clinical care in practice. Physician requests laboratory exams, on the basis of the clinical signs and symptoms, to support diagnostic reasoning. Thus, even though the results show that laboratory exams are important for the quality of care, physicians heavily rely on
Table 3 - Correlation (Kendall’s Tau_b rank correlation) between each domain for clinical relevance and practice utility
Lab exam Clinical signs Diagnosis Therapy Prognosis
Clinical relevance
Laboratorial exams 1
Clinical signs 0.648* 1
Diagnosis 0.530* 0.647* 1
Therapy 0.486 0.692* 0.337 1
Prognosis 0.343 0.667* 0.424 0.558* 1
Practice utility
Laboratorial exams 1
Clinical signs 0.647* 1
Diagnosis 0.629* 0.324 1
Therapy 0.388 0.277 0.359 1
Prognosis 0.294 0.061 0.088 0.090 1
ARTIGO ORIGINAL
their own abilities to detect, diagnose and treat diseases29
and to determine the prognosis.30
The indicators selected by physicians in this study are mostly HIV specific indicators. They are endorsed by the HIV American31 and European22 guidelines and the Spain23
HIV core clinical care indicators. The quality is defined as the fulfillment of the standards, but it is also important to have an overall picture of the health status of the patient. The generic indicator selected “Patient with shortness of breath at rest has an arterial blood gas sample drawn” is not endorsed by the HIV treatment guidelines, but it is also important to assess more general guidelines. Some of the indicators, such as viral load count did not reach the median 4, but are not less important. The selection of a set of indicators should be made not only based on the opinion of doctors (HIV experts) but also weighing each indicator within the care process.
These results raise some issues that should be addressed in a future study. First, selected indicators may not represent all possible indicators for assessing the clinical care of HIV patients. This is not due to the systematic review method of obtaining them, but mostly to the fact that doctors were only asked to assess their clinical relevance and practical utility and were not asked to assess their suitability. Second, to be validated and used nationwide or internationally, more infectious diseases specialists from other hospitals that provide care to patients with HIV must be consulted. Third, the list of indicators used to gather HIV/AIDS expert opinion could possibly be more HIV/AIDS specific; however, we thought that this approach was more appropriate for covering all areas of healthcare giving us a complete idea of what should be taken into account to assess clinical quality of care in the HIV/AIDS field. Fourth, it would be important to have the opinion of HIV/AIDS
Table 4 - HIV/AIDS quality indicators considered most useful and relevant for the assessment of hospital care, according to the experts
Indicators Mean Median
A - Laboratorial examinations
1 Patient with shortness of breath at rest, have an arterial blood gas sample drawn 3.54 4
2 Proportion of HIV patients with haemoglobin documented 3.45 4
3 Proportion of HIV patients with total lymphocyte count documented 3.72 4
4 Proportion of HIV patients with absolute neutrophil count documented 3.72 4
10 Proportion of HIV patients with chest X-ray (normal and abnormal) documented 3.45 4
B - Clinical signs and symptoms
17 Proportion of HIV patients with a CNS change 3.67 4
18 Proportion of HIV patients with complicated cough 3.56 4
20 Proportion of HIV patients with lungs examined 3.54 4
C - Diagnosis and follow-up
23 Hepatitis C screening 3.72 4
24 Tuberculosis screening 3.63 4
26 P jiroveci pneumonia prophylaxis 3.72 4
27 Non-detectable HIV viral load 3.90 4
29 Proportion of patients with continued care 3.54 4
30 HIV prevalence among pregnant women 3.64 4
D - Therapy
32 Proportion of HIV patients with ART use 3.90 4
37 Proportion of patients eligible for ARV who are currently on ARV 3.78 4
42 Proportion of patients with a previous ARV regimen change for whom the reason for change in the
regime is documented 3.72 4
45 Proportion of patients on ART with at least 95% (good) reported adherence on the last visit 3.67 4
49 Appropriate antiretroviral therapy 3.78 4
50 Co-management of Tuberculosis and HIV Treatment 3.67 4
51 Number of HIV-positive pregnant women who received antiretroviral to reduce the risk of
ARTIGO ORIGINAL
patients and also the perspective of patients themselves on the quality of clinical care. Although this is a small study, it is a good starting point for the establishment of specific quality indicators for evaluating the clinical care of patients with HIV.
This instrument should serve as a diagnostic tool, allowing hospital stakeholders to identify if HIV/AIDS care is not properly delivered and needs improvement. One of the main challenges is the source of the data. To assess the quality of clinical care provided to HIV patients, in addition to requiring appropriate and validated indicators, it is also necessary to have a computer system that can store in useful form information and process data. Thus, another challenge is to determine whether the management of clinical information is properly structured for providing information to generate these indicators and, if not, to design a new system that captures the information and automatically generates the indicators.
CONCLUSION
In conclusion, to measure the quality of clinical care, we must have indicators for almost all domains of clinical care. From the initial set of 53 indicators, physicians identified a subset of 21 as the most relevant and useful for assessing HIV/AIDS clinical care.
ACKNOWLEDGMENTS
The authors wish to thank Maria do Carmo Cruz for
reviewing the manuscript, all Center for Research in Health Technologies and Information Systems (CINTESIS) staff for their continuous support during the execution of this study and the health professionals of the Infectious Diseases Department of Hospital S. João in Porto.
PROTECTION OF HUMANS AND ANIMALS
The authors declare that the procedures were followed according to the regulations established by the Clinical Research and Ethics Committee and to the Helsinki Declaration of the World Medical Association.
DATA CONFIDENTIALITY
The authors declare having followed the protocols in use at their working center regarding patient’s data publication.
AUTHORS’ CONTRIBUTIONS
All authors meet each of the three authorship requirements as stated in the Uniform Requirements for Manuscripts Submitted to Biomedical Journals.
COMPETING INTERESTS
The authors declare that they have no competing interests.
FUNDING SOURCES
No subsidies or grants contributed to this work.
REFERENCES
1. Pronovost PJ, Nolan T, Zeger S, Miller M, Rubin H. How can clinicians measure safety and quality in acute care? Lancet. 2004;363:1061-7. 2. Evans SM, Lowinger JS, Sprivulis PC, Copnell B, Cameron PA.
Prioritizing quality indicator development across the healthcare system: identifying what to measure. Inter Med J. 2009;39:648-54.
3. Chassin MR, Loeb JM, Schmaltz SP, Wachter RM. Accountability measures — using measurement to promote quality improvement. N Engl J Med. 2010;363:683-8.
4. Lindsay MP, Kapral MK, Gladstone D, Holloway R, Tu JV, Laupacis A, et al. The Canadian Stroke Quality of Care Study: establishing indicators for optimal acute stroke care. CMAJ. 2005;172:363-5.
5. Cheng EM, Siderowf A, Swarztrauber K, Eisa M, Lee M, Vickrey BG. Development of quality of care indicators for Parkinson’s disease. Mov Disord. 2004;19:136-50.
6. Prys-Picard CO, Campbell SM, Ayres JG, Miles JF, Niven RM. Defining and investigating difficult asthma: developing quality indicators. Respir Med. 2006;100:1254-61.
7. Hermens RP, Ouwens MM, Vonk-Okhuijsen SY, van der Wel Y, Tjan-Heijnen VC, van den Broek LD, et al. Development of quality indicators for diagnosis and treatment of patients with non-small cell lung cancer: a first step toward implementing a multidisciplinary, evidence-based guideline. Lung Cancer. 2006;54:117-24.
8. Del Turco M R, Ponti A, Bick U, Biganzoli L, Cserni G, Cutuli B, et al. Quality indicators in breast cancer care. Eur J Cancer. 2010;46:2344-56. 9. Dennison CR, Hughes S. Reforming cardiovascular care: quality
measurement and improvement, and pay-for-performance. J Cardiovasc Nurs. 2009;24:341-3.
10. Cryer C, Langley JD, Jarvis SN, Mackenzie SG, Stephenson SCR, Heywood P. Injury outcome indicators: the development of a validation tool. Inj Prev. 2005;11:53-7.
11. Pelletier LR, Hoffman JA. A framework for selecting performance measures for opioid treatment programs. J Healthc Qual. 2002;24:24-35.
12. Seow H, Snyder CF, Mularski RA, Shugarman LR, Kutner JS, Lorenz KA, et al. A framework for assessing quality indicators for cancer care at
the end of Life. J Pain Symptom Manage. 2009;38:903-12.
13. World Health Organization. National AIDS programmes: a guide to monitoring and evaluating HIV/AIDS care and support. Geneva: WHO; 2004.
14. Joint United Nations Programme on HIV/AIDS (UNAIDS). Monitoring the declaration of commitment on HIV/AIDS: guidelines on construction of core indicators. Geneva: WHO; 2005.
15. Joint United Nations Programme on HIV/AIDS (UNAIDS). Monitoring the Declaration of Commitment on HIV/AIDS: guidelines on construction of core indicators: 2010 reporting. Geneva: UNAIDS; 2009.
16. Fund TG. Monitoring and Evaluation toolkit: HIV. Tuberculosis, Malaria and Health and Community Systems Strengthening Geneva: GlobalFund; 2011.
17. World Health Organization. Essential prevention and care interventions for adults and adolescents living with hiv in resource-limited settings. Geneva: WHO; 2008.
18. Derose SF, Asch SM, Fielding JE, Schuster MA. Developing quality indicators for local health departments: Experience in Los Angeles County. Am J Prev Med. 2003;25:347-57.
19. Mathews WC, Ferdon E, Bennett C, Kanouse D. Evaluating institutional performance in AIDS-associated Pneumocystis carinii pneumonia: A risk adjustment approach. J Clin Epidemiol. 1989;42:421-5.
20. Wollersheim H, Hermens R, Hulscher M, Braspenning J, Ouwens M, Schouten J, et al. Clinical indicators: development and applications. Neth J Med. 2007;65:15-22.
21. Catumbela E, Certal V, Freitas A, Costa C, Sarmento A, da Costa Pereira A. Definition of a core set of quality indicators for the assessment of HIV/AIDS clinical care: a systematic review. BMC Health Serv Res. 2013;13:236.
22. Rockstroh J, Bhagani S, and Bruno R. European AIDS Clin Society (EACS) guidelines. Version 6.1. 2012. Geneva: EACS; 2012.
ARTIGO ORIGINAL
400
Revista Científica da Ordem dos Médicos www.actamedicaportuguesa.com
24. Bartlett J G, Agins B D, Barini-Garcia M, Cheever L, Abel S, Aberg J A, et al. Guideline-based quality indicators for HIV care. New York: State Department of Health, AIDS Institute Health Resources and Services Administration HIV/AIDS Bureau: 2008.
25. HIVQUAL Workbook. Guide for quality improvement in HIV care. New York: State Department of Health AIDS, Institute Health Resources and Services Administration HIV/AIDS Bureau: 2006.
26. George D, Malley P. SPSS for Windows Step by Step: A Simple Guide. London: Prentice Hall; 1999.
27. World Medical Association. World Medical Association Declaration of Helsinki. Ethical principles for medical research involving human subjects. Bull World Health Organ. 2001;79:373-4.
28. Wilson IB, Landon BE, Marsden PV, Hirschhorn LR, McInnes K, Ding L, et al. Correlations among measures of quality in HIV care in the United States: cross sectional study. BMJ. 2007;335:1085.
29. Donald KF, Bear D, Greenlick MR, Bailey JW. Determinants of medical care utilization: physicians´ use of laboratory services. Am J Public Health. 1972;62:846-53.
30. Harrigan PR, Côté HC. Clinical utility of testing human immunodeficiency virus for drug resistance. Clin Infect Dis. 2000;30:S117-S22.