Epidemiological study and qualitative study results.
26
0
0
Texto
(2) index Introduction 3 Part one – The National Mental Health Survey Follow-up. 4. • Objective 4 • Methods 4 • Impact of the crisis on mental-ill health of the population. 5. • Social and economic indicators and mental health outcomes 11 • Protective factors for mental health 14 • Use of services 16 Part two - Qualitative study 21 • Objective 21 • Methods 21 • Preliminary results 22 Final conclusions 23 References 24.
(3) “Evaluating and improving the access to mental health services of people affected by the economic crisis in Portugal based on a new understanding of the effects of the crisis on mental health of the population” authors JM Caldas de Almeida Graça Cardoso Ana Antunes Diana Frasquilho Manuela Silva Daniel Neto Paula Santana João Ferrão Benedetto Saraceno. NOVA medical school research team JM Caldas de Almeida (Coordinator) Graça Cardoso Ana Antunes Diana Frasquilho Manuela Silva Daniel Neto Benedetto Saraceno. partners Centre of Studies on Geography and Spatial Planning (CEGOT), University of Coimbra: Paula Santana and Adriana Loureiro Institute of Social Sciences, University of Lisbon: João Ferrão and Nádia Pereira Research Centre of Public Opinion (CESOP), Catholic University of Portugal: Jorge Cerol NOVA Information Management School, NOVA University of Lisbon: Jorge Mendes and Helena Baptista National School of Public Health, NOVA University of Lisbon: Julian Perelman Regional Health Administration of Lisbon and Tagus Valley (ARS-LVT): Luís Pisco Lisbon Hospital Psychiatric Centre (CHPL): José Salgado Magalhães Lemos Hospital: António Leuschner Faculty of Social Sciences, University of Oslo. international consultants Ron Kessler (Harvard Medical School, United States of America) Jordi Alonso and Gemma Vilagut (Institut Hospital del Mar d’Investigacions Mèdiques, Spain) Kristian Wahlbeck (Finnish Association for Mental Health, Finland) Arne Holte (Norwegian Institute of Public Health, Norway). acknowledgments Carla Abril Jorge Caixinhas Paula Broeiro Bruno Heleno Sofia Azeredo Teresa Santos Cláudia Costa Ricardo Almendra. funding This project was granted by the Public Health Initiatives Programme (PT06), financed by EEA Grants Financial Mechanism 2009-2014. mh crisis impact. www.crisisimpact.com.
(4) Introduction The financial crisis that started in 2008 led to a period of economic recession in several countries worldwide (1,2). In Europe, most countries experienced losses of the gross domestic product (GDP), and higher levels of national debt and unemployment rates, placing 24.8% of its citizens at risk of poverty and social exclusion (1). European countries that asked for financial assistance from the European Union, the European Central Bank and the IMF, such as Greece, Portugal and Ireland, were forced to implement structural reforms aimed at reducing public expenditure and fiscal consolidation (2). In Portugal, the signs of economic contraction were evident (3). The GDP decreased 7% from 2011 to 2013. The country’ deficit declined from 11.2% of GDP in 2010 to 4.4% in 2015, still above the convention limit of 3% of the European Union Stability and Growth Pact (4). Governmental debt amounted to 129% of the GDP in 2013, and remained the same in 2015 (5). The annual unemployment rate rose from 8.8% in 2008 up to 16.4% in 2013, one of the highest rates in Europe (6). The memorandum of the financial assistance programme, formalized between the Portuguese government and the Troika to reduce public spending, included several measures to generate substantial savings in the health system (3). Examples of those measures were freezing or reducing the salaries of health professionals and other employees; reducing existing staff and limiting new hiring; increasing the number of patients per general practitioner and reducing payments for overtime work. Measures to reduce the demand of care were also implemented, such as higher co-payments, with exemptions to protect those most economically deprived, the unemployed and other vulnerable groups (3,7). In periods of economic recession, the health of the population is estimated to be negatively affected, with mental health and well-being deteriorating more immediately and perhaps more severely than physical health (1,8,9). Some authors indicate that psychological well-being, common mental disorders, sleep disorders, alcohol abuse and suicidal behaviour are particularly impacted (1). The conceptual framework of the social determinants of health provides an important approach to understand how periods of economic recession affect health and particularly mental health (10). Social determinants of health are defined as the conditions in which people are born, live, work and age (11–13). Social and economic conditions, health and welfare systems, labour markets and public policies shape the health of populations and those who are more socially disadvantaged are at higher risk of experiencing poor health and mental health (1,8,13). Exacerbation of risk factors such as unemployment, financial deprivation, debt, inequality, social exclusion and precarious work conditions represent some of the drivers of poor mental health during economic recessions (8). Despite being one of the European countries most affected by the economic recession and the implementation of austerity measures, little attention has been given to the potential negative consequences on the mental health and well-being of the Portuguese population (14). Compared with other European countries, in Portugal this type of research is almost non-existent (9). This is particularly worrying since epidemiological evidence from the World Mental Health Survey Initiative before the economic recession indicated Portugal as one of the European countries with highest prevalence rates of 12-month mental disorders (22.9%) (15), a scenario likely to have been affected by deteriorating social and economic conditions and possible changes in health care seeking behaviour and health care delivery (7). Economic recessions pose both major threats and opportunities to health, with opportunities arising from the need to design appropriate and innovative policy responses that not only prevent the rise of health and social inequalities but also promote the resilience of individuals and communities. This report presents the main results from the MH Crisis Impact Study, the largest national study focusing on the economic crisis´ impact on the mental health of the Portuguese population, which is financed by EEA Grants Financial Mechanism 2009-2014. The report has two different parts. Part one is dedicated to the National Mental Health Survey Follow-up, an epidemiological study carried out in 2015 in a subsample of the mental health survey developed in Portugal in 2008. Part 2 describes a Qualitative study on the perceived effects of the economic crisis, carried out in 2016-17 in Health Centres of regions especially affected by the economic crisis.. mh crisis impact · report 1 · 3.
(5) PART ONE. The National Mental Health Survey Follow-up 1. objective To obtain a new understanding of the effects of the economic crisis in Portugal on mental-ill health of the populations, determinants of mental disorders, and use of mental health services.. 2. methods The impact of the economic crisis on the mental health of the population was assessed by comparing epidemiological data on mental disorders, their determinants and the use of services, before and after the crisis, in a subsample of the population studied in 2008 in the National Mental Health Survey (n=3849), part of the World Mental Health Surveys Initiative. Psychiatric morbidity was evaluated in 2008 with the World Health Organization Composite International Diagnostic Interview (WHO-CIDI 3.0). All individuals diagnosed with a mental disorder in 2008 and a 20% random sample of those without a diagnosed mental disorder were recruited In 2015-2016 for a National Mental Health Survey Follow-up (n=911). The follow-up survey evaluated mental distress and 30-day prevalence of mental disorders, as well as demographic and socioeconomic factors, social support, perceived neighbourhood conditions, use of services and psychotropic medication. Other questions were included in the questionnaire to capture in more detail the changes that occurred since 2008 at the level of family, work, housing and use of health services. In order to evaluate mental health outcomes during the economic recession, the following instruments were used:. Kessler Psychological Distress Scale (K-10) Psychological distress was evaluated with a 10-question screening scale of mental distress, providing a global measure of distress based on questions about depressive and anxiety symptoms experienced in the last month. The use of this scale is appropriate for epidemiological surveys due to its strong psychometric properties, ability to discriminate DSM-IV cases from non-cases, and easy and quick administration (16). This scale was dichotomized according to the presence of moderate or severe psychological distress vs. absence or mild psychological distress (cut off ≥25) (17).. CIDI screening scales (CIDI-SC) CIDI-SC was used to evaluate 30-day major depressive episode (MDE) and 30-day generalized anxiety disorder (GAD). This instrument holds strong psychometric properties and concordance with DSM-IV/SCID diagnoses, while reducing respondent burden (18).. Statistical Analysis For descriptive purposes, frequencies and chi-square analyses were conducted. Statistical significance was set at p<0.05.. mh crisis impact · report 1 · 4.
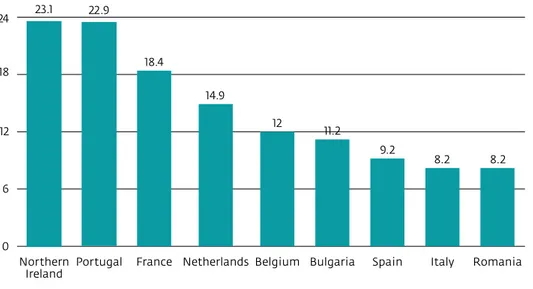
(6) 3. results. Impact of the crisis on mental-ill health of the population The 2008 National Mental Health Survey showed that Portugal has the second highest prevalence of any mental disorder in the last 12 months among countries of Europe that participated in the World Mental Health Surveys Initiative (Fig.1). It also showed that Portugal presents a pattern of psychiatric morbidity significantly different from the pattern of other Southern European countries.. Prevalence of any mental disorder in the last 12 months in European countries (WMHS Initiative) 24. 23.1. 22.9. 18.4. 18. 14.9 12. 12. 11.2 9.2. 8.2. 8.2. Italy. Romania. 6. 0 Northern Portugal Ireland. France Netherlands Belgium Bulgaria. Spain. figure 1 prevalence of any mental disorder in the last 12 months in european countries (wmhs initiative. adapted from wang et al, 2011. The prevalence of psychological distress increased in a very significant way between 2008, when the economic crisis began, and 2015, when the impact of the economic contraction had fully developed: while in 2008 there was a prevalence of 19.8% of any psychological distress, the prevalence increased to 31.2% in 2015. This increase was not very important in the mild distress group (from 13,6% to 16.8%), but it almost doubled in the moderate distress group (from 4.4% to 7.6%), and it more than tripled in the severe distress group (from 1.8% to 6.8%) (Fig.2).. Psychological distress in 2008 and 2015 (K-10) 40 31.2 30. 19.8. 20. 16.8 13.6. 10. 7.6. 6.8. 4.4. 2008 (n=562). 1.8. 2015 (n=911). 0 Mild. Moderate. Severe. Any psychological distress. figure 2 psychological distress in 2008 and 2015 (k-10). mh crisis impact · report 1 · 5.
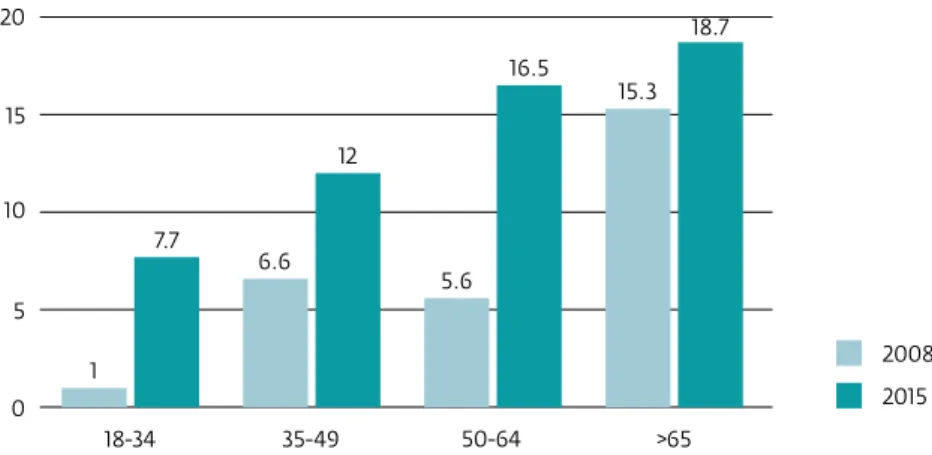
(7) As we can see in Fig.3, the prevalence of common mental disorders increased, from 2008 to 2015, particularly in GAD.. Prevalence of MDE and GAD in 2008 and 2015 7. 6.3. 6 5 3.9. 4. 3.2. 3 2. 1.1. 1. MDE GAD. 0 2008 (CIDI 3.0). 2015 (CIDI SC). figure 3 prevalence of mde and gad in 2008 and 2015. Regarding the increase of psychological distress between 2008 and 2015, according to gender (Fig.4), we can see that it almost doubled for women, while it more than tripled for men. In relation to age, the highest increases were seen in the age group of 50-64, and in the age group of 18-34 (Fig.5).. Psychological distress in 2008 to 2015 according to gender 20. 18.5. 15 10.2. 9.9. 10 5. 2.6. Men Women. 0 2008. 2015. figure 4 psychological distress in 2008 to 2015 according to gender. Psychological distress in 2008 and 2015 according to age group 20. 18.7 16.5. 15. 15.3. 12 10 7.7. 6.6. 5.6. 5 2008. 1. 2015. 0 18-34. 35-49. 50-64. >65. figure 5 psychological distress in 2008 and 2015 according to age group. mh crisis impact · report 1 · 6.
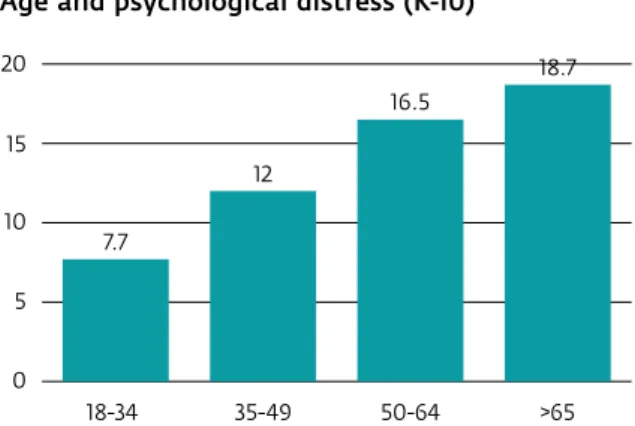
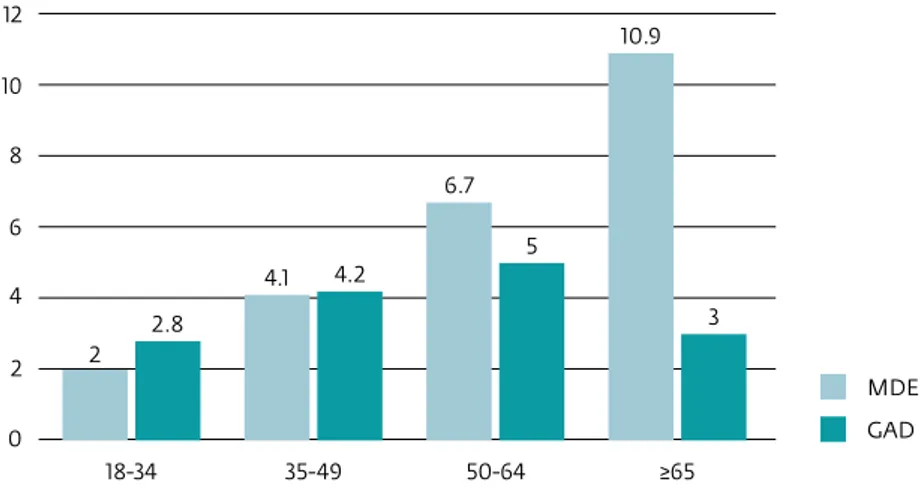
(8) Gender and mental ill-health in 2015 In 2015, psychological distress was more common among women than among men (Fig.6).. Gender and psychological distress (K-10) 20 18 16 14 12 10 8 6 4 2 0. 18,5. 10,2. Men. Women. figure 6 gender and psychological distress (k-10). The higher prevalence in women can be seen both regarding MDE and GAD, but this difference is more marked in MDE (Fig.7).. Gender and common mental disorders (MDE and GAD) 10. 9.1. 8 6 4. 5 3.3. 2.8. 2. Men. 0. Women. figure 7 gender and common mental disorders (mde and gad). Age and mental ill-health in 2015 In 2015, the prevalence of psychological distress increased with age (Fig.8). This tendency can also be seen in MDE. However, in GAD, the prevalence increased from the 18-34 age group up to the 50-64 age group, and decreased in the 65+ age group (Fig.9).. Age and psychological distress (K-10) 20. 18.7 16.5. 15 12 10. 7.7. 5 0 18-34. 35-49. 50-64. >65. figure 8 age and psychological distress (k-10). mh crisis impact · report 1 · 7.
(9) Age groups and common mental disorders (MDE and GAD) 12. 10.9. 10 8 6.7 6. 5 4.1. 4. 4.2 3. 2.8 2. 2 MDE GAD. 0 18-34. 35-49. 50-64. ≥65. figure 9 age groups and common mental disorders (mde and gad). Marital status and mental ill-health in 2015 In 2015, divorced and widowed respondents had the highest prevalence of psychological distress, followed by married and single respondents (Fig.10). The same tendency was found in relation to MDE but not in relation to GAD. In this last diagnostic group, the highest prevalence was found in single respondents, followed by divorced and widowed. Those who were married reported the lowest percentage of GAD (Fig.11).. Marital status and psychological distress (K-10) 20. 18.7 14.8. 15 10. 8.3. 5 0 Single. Married. Divorced, Widowed. figure 10 marital status and psychological distress (k-10). Marital status and common mental disorders (MDE and GAD) 12. 11.4. 9 5.9. 6. 3. 4.7 3. 2.7 1.7. MDE GAD. 0 Single. Married. Divorced, Widowed. figure 11 marital status and common mental disorders (mde and gad). mh crisis impact · report 1 · 8.
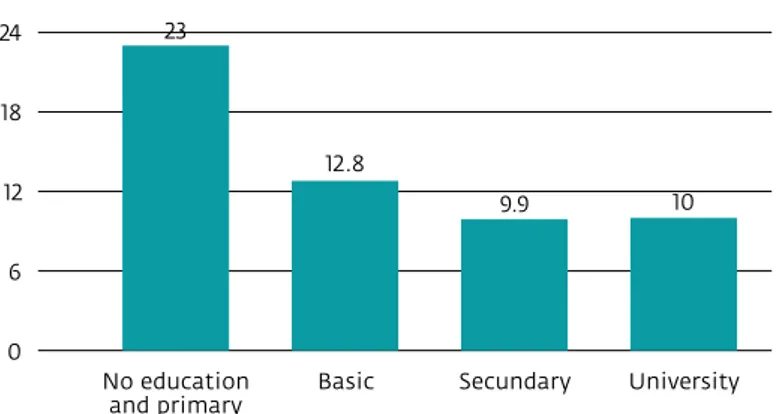
(10) Education and mental ill-health in 2015 The proportion of psychological distress in 2015 was higher in respondents with no education or primary education (Fig. 12). Likewise, MDE and GAD diagnoses were more frequent among respondents with no education or primary education, compared with those with higher levels of education (Fig.13).. Education and psychological distress (K-10) 23. 24 18. 12.8 12. 9.9. 10. Secundary. University. 6 0 No education and primary. Basic. figure 12 education and psychological distress (k-10). Education and common mental disorders (MDE and GAD) 16 14. 13.4. 12 10 8. 7.3 5.4. 6 4. 2.3 2. 2.2. 2.6. 2.7. 3.1 MDE GAD. 0 No education and primary. Basic. Secundary. University. figure 13 education and common mental disorders (mde and gad). mh crisis impact · report 1 · 9.
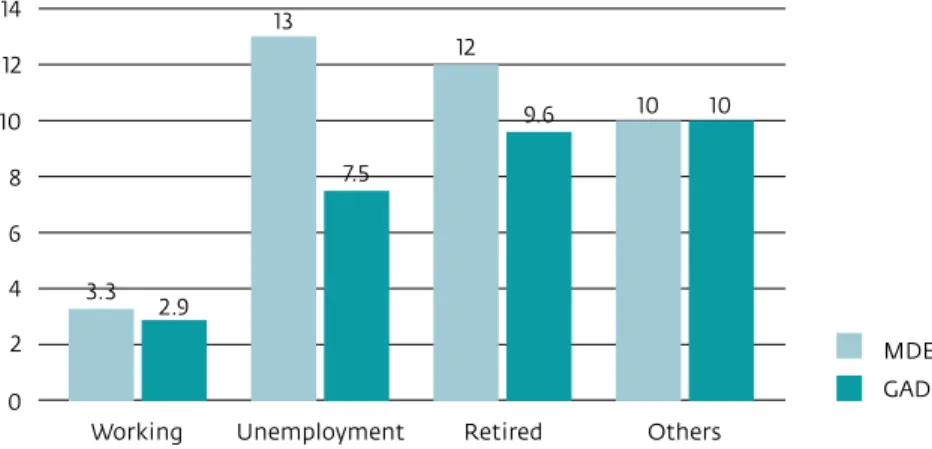
(11) Professional situation and mental ill-health in 2015 The lowest prevalence of psychological distress in 2015 was found among working respondents, in comparison with those unemployed, retired and other people (Fig.14). The same was found regarding MDE and GAD. However, while in MDE it was the unemployed group that had the highest prevalence, in GAD, the highest prevalence was found among retired respondents and others (Fig.15).. Employment situation and psychological distress (K-10) 24. 21.7. 22.5. Retired. Others. 8.9 18 12. 10.6. 6 0 Working. Unemployment. figure 14 employment situation and psychological distress (k-10). Employment and common mental disorders (MDE and GAD) 14. 13 12. 12. 9.6. 10. 10. 10. 7.5. 8 6 4. 3.3. 2.9. 2. MDE GAD. 0 Working. Unemployment. Retired. Others. figure 15 employment and common mental disorders (mde and gad). key points • There was a substantial increase in the prevalence of psychological distress, particularly among moderate and severe cases, from 2008 to 2015 • Common mental disorders were associated with being a woman, being older, less educated, unemployed and retired. mh crisis impact · report 1 · 10.
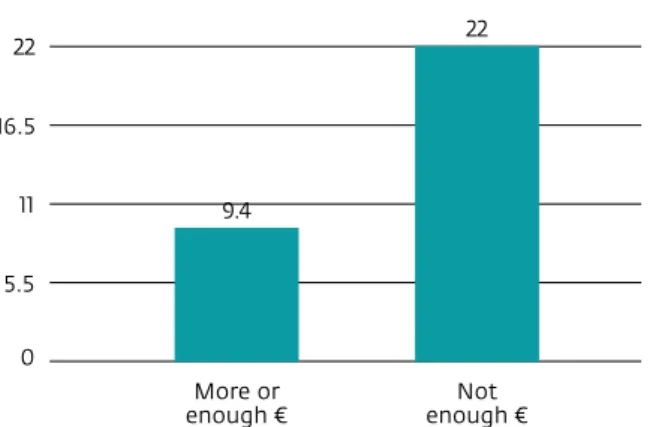
(12) Social and economic indicators and mental health outcomes Social and economic conditions often shape mental health status of people. Since these are likely to change during periods of economic crisis, we evaluated mental health outcomes throughout a range of social and economic indicators.. Financial deprivation There is evidence showing that self-perceived financial deprivation is highly associated with psychological distress. This variable has proved to better predict mental health outcomes when compared to indicators based on income (19). In this study, participants were asked if they perceived they had more than enough money for their daily life, just enough or not enough. Those who reported not having enough money were considered as financially deprived.. Types of financial deprivation The participants were asked if they had financial difficulties in several domains, which were divided into 3 categories: 1) Essential goods: difficulties buying food, paying rent and water or electricity bills, 2) Debts: difficulties paying mortgage, car or credit card debt, 3) Other goods: difficulties buying clothes or engaging in leisure activities.. Perceived Social Position Evidence indicates that if individuals perceive themselves as having a lower social position than other members of society, they are more likely to report poor health and poor mental health (20). For this study, a Cantril ladder scale was used to evaluate perceived social position. Participants were asked to indicate their perceived position in relation to others in society, from 1 to 10, with the lower values representing a lower social position.. Statistical analysis For descriptive purposes, frequencies and chi-square analyses were conducted. Statistical significance was set at p<0.05.. Financial deprivation and mental health outcomes Financial deprivation was found to be significantly associated with psychological distress. Among the participants who reported to be financially deprived, 22.0% had moderate or severe psychological distress (p<0.05) (Fig.16). The same association was found for participants with a diagnosis of MDE and GAD (Fig.17).. Financial deprivation and psychological distress (K-10) 22. 22 16.5 11. 9.4. 5.5 0 More or enough €. Not enough €. figure 16 financial deprivation and psychological distress (k-10). mh crisis impact · report 1 · 11.
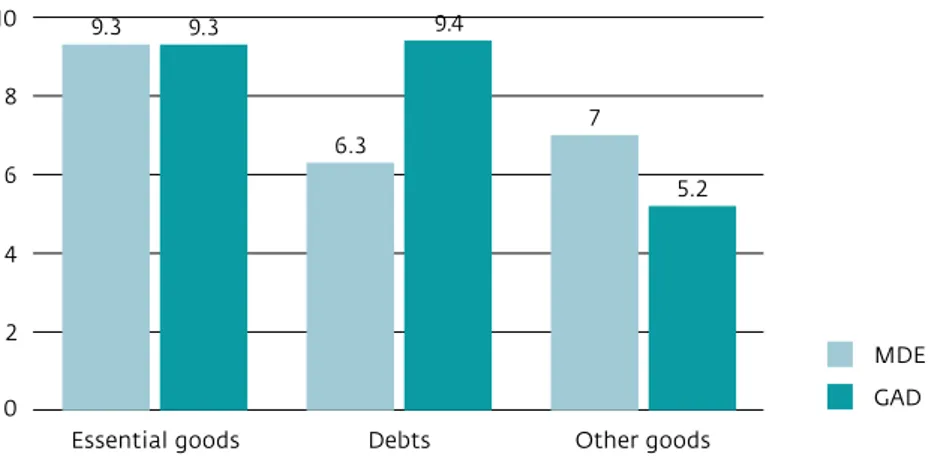
(13) Financial deprivation and common mental disorders (MDE and GAD) 12. 10.9. 10 8 6.4 6 4. 3.3 2.2. 2. MDE GAD. 0 Not enough €. More or enough €. figure 17 financial deprivation and common mental disorders (mde and gad). Types of financial deprivation All types of financial deprivation were found to be significantly associated with psychological distress (p<0.05) (Fig.18). Difficulties in acquiring essential goods were significantly associated with MDE and GAD (p<0.05). Debts were found to be associated with GAD (p<0.05) and no association was found between MDE or GAD and deprivation of other goods (Fig.19).. Types of financial deprivation and psychological distress (K-10) 35 29. 30. 28.1. 25 19. 20 15 10 5 0. figure 18 types of financial deprivation and psychological distress (k-10). Types of financial deprivation and common mental disorders (MDE and GAD) 10. 9.3. 9.4. 9.3. 8. 7 6.3. 6. 5.2. 4 2. MDE GAD. 0 Essential goods. Debts. Other goods. figure 19 types of financial deprivation and common mental disorders (mde and gad). mh crisis impact · report 1 · 12.
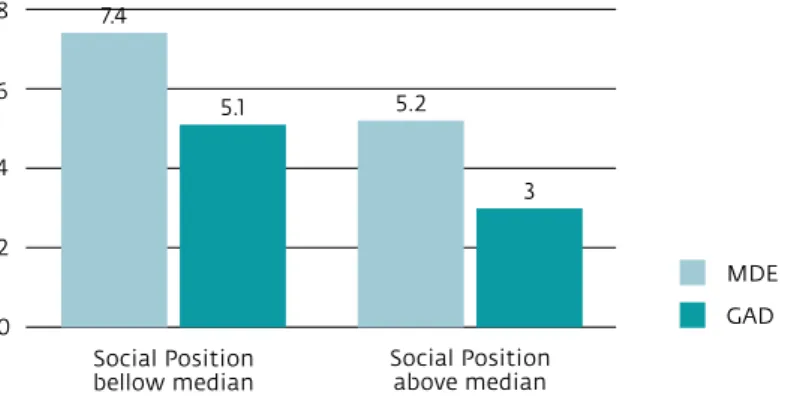
(14) Social position The perception of a low social position was found to be associated with psychological distress (p<0.05) (Fig.20). The same association was found for MDE but not for GAD (Fig.21).. Perceived Social Position and psychological distress (K-10) 20 18 16 14 12. 18. 10.9. 10 8 6 4 2 0 Social Position bellow median. Social Position above median. figure 20 perceived social position and psychological distress (k-10). Perceived social position and common mental disorders (MDE and GAD) 8. 7.4. 6. 5.1. 4. 5.2. 3. 2 MDE GAD. 0 Social Position bellow median. Social Position above median. figure 21 perceived social position and common mental disorders (mde and gad). key point • Perceived financial deprivation and difficulties acquiring essential goods were statistically associated with psychological distress and common mental disorders. mh crisis impact · report 1 · 13.
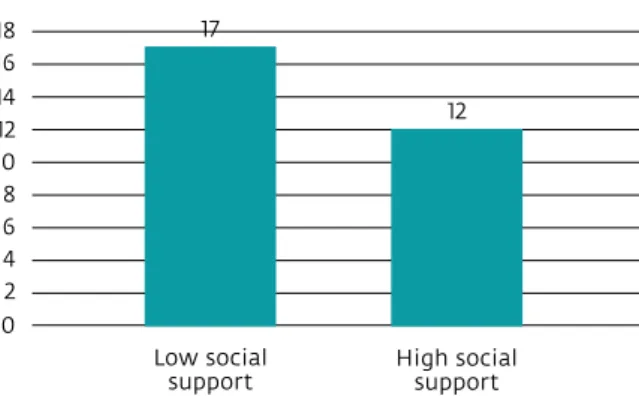
(15) protective factors for mental health Although periods of economic recession pose challenges to mental health, protective factors may buffer its negative impact and promote resilience of individuals and communities. The protective effect on mental health of a strong social support network is well documented. Strong social bonds and supportive relationships are essential to positive mental health, and to act against the negative effects of stress (21,22). The level of community involvement, which integrates factors such as social cohesion, participation in the community and perceptions towards the neighbourhood of residence, also represent an important predictor of mental health outcomes (23).. Social Support Participants were asked how they evaluated the proximity and degree of support of their relationships with partners, family and friends, using a scale ranging from 0-100, with higher values representing greater social support. In order to simplify the presentation of the results, the scale was dichotomized using the median as a cut-off point, and individuals above the cut-off were considered as having good social support.. Community involvement Questions evaluating how the individuals perceive their neighbourhood, and their sense of belonging and participation in the community were used to produce a score from 0-100, where higher values represent a greater degree of community involvement. In order to simplify the presentation of the results, the scale was dichotomized using the median as a cut-off point, and individuals above this cut-off were considered as having good community involvement. The scoring method was based on Ware et al (1993) (24).. Statistical analysis For descriptive purposes, frequencies and chi-square analyses were conducted. Statistical significance was set at p<0.05.. Social support A higher proportion of psychological distress, MDE and GAD was found among the participants that reported lower social support (Fig.23). Social support was found to be significantly associated with psychological distress and MDE (p<0.05) (Fig.22).. Social support and psychological distress (K-10) 17. 18 16 14 12 10 8 6 4 2. 12. 0 Low social support. High social support. figure 22 social support and psychological distress (k-10). Social support and common mental disorders (MDE and GAD) 10 8. 8.2. 6 4.8 4. 4.4 3.3. 2. MDE GAD. 0 Low social support. High social support. figure 23 social support and common mental disorders (mde and gad). mh crisis impact · report 1 · 14.
(16) Community involvement A higher proportion of psychological distress was found among the participants that reported lower community involvement. However, this difference was not statistically significant (p>0.05) (Fig.24). Participants with GAD were found to be significantly associated with community involvement, while those with MDE were not (Fig.25).. Community involvement and psychological distress (K-10) 18 16 14 12 10. 16.1 13.2. 8 6 4 2 0 Low community involvement. High community involvement. figure 24 community involvement and psychological distress (k-10). Community involvement and common mental disorders (MDE and GAD) 8 7. 6.7. 6.3. 6. 5.4. 5 4 3. 2.6. 2 MDE. 1. GAD. 0 Low community involvement. High community involvement. figure 25 community involvement and common mental disorders (mde and gad). key points • Social support and community involvement appear to be protective factors for overall psychological well-being • Different patterns were found regarding depression and generalized anxiety disorder, which were associated with social support and community involvement, respectively. mh crisis impact · report 1 · 15.
(17) use of services During economic crises, changes in health care services are expected due to reductions in public health budgets. Consequently, access and continuity of care may be affected. This situation, together with the worsening of the population’s socio-economic status and health, may further contribute for the treatment gap during this period. It is fundamental to have a clear characterization of the use of services, its main difficulties and the main barriers to treatment in order to design the best responses to meet the needs of the population.. Characterization of the use of services Search for help due to mental health problems in the last 5 years During the last 5 years, 27.9% of the participants sought help due to mental health problems (Fig.26), whether provided by formal health services (general practitioners, psychiatrists, psychologists) or by other providers. Primary health care was the first line of response to mental health needs, as would be expected since Portugal has a primary care network that ensures a reasonable coverage of the national territory, and GPs provided mental health care to 17.1% of the participants. Psychiatrists were the second group providing mental care (10.3%), followed by psychologists (4.1%) (Fig.27).. Use of services for mental health problems in the last 5 years. 27.1 Yes No. 72.9. figure 26 use of services for mental health problems in the last 5 years. Use of services for mental health problems 18. 17.1. 16 14 12. 10.3. 10 8 6 4 2 0. 4.1 1.5 Hospitalizations Psychiatrist. GP. Psychologist. figure 27 use of services for mental health problems. mh crisis impact · report 1 · 16.
(18) Use of provider by type of mental health problem in the last 12 months In the last 12 months GPs were the main providers of mental care, both for psychological distress (measured by the Kessler-10 scale) and for MDE and GAD. Psychiatrists were the second line of treatment, followed by psychologists. It is noteworthy that 3.8% of the participants without relevant psychological distress (Kessler-10<20) were treated by psychiatrists (Fig.28).. Use of different providers by individuals with type of mental health problem 40 33.7. 33.2 30. 32.8. 27 24.6 18.8. 20. 11.2 10. 8.5 Psychiatrist. 5.8. 4.2. 3.8. GP. 1.6. Psychologist. 0 MDE. GAD. K-10 ≥ 25. K-10 < 20. figure 28 use of different providers by individuals with type of mental health problem. Use of any psychotropic medication in 2008 and 2015 Between 2008 and 2015, there was an overall increase in the use of psychotropic medication (22.5% in 2008 to 28.6% in 2015) (Fig.29). This overall increase was found in all the main groups of psychotropic medications, but was particularly relevant for the consumption of antidepressants and anxiolytics (Fig.30).. Use of any psychotropic medication in 2008 and 2015 35 30 25. 28.6 22.5. 20 15 10 5 0 2008. 2015. figure 29 use of any psychotropic medication in 2008 and 2015. mh crisis impact · report 1 · 17.
(19) Type of psychotropic medication in 2008 and 2015 20 16.9 14.6. 15 12.3. 11.5. 11. 10. 8.6. 5 0.6. 0.8. 0 Sleep medication. Antidepressants. Anxiolytics. 2008 2015. Antipsychotics. figure 30 type of psychotropic medication in 2008 and 2015. Use of psychotropic medication by gender in 2008 and 2015 Gender differences were found in the use of psychotropic medication. There was an increase in consumption of all groups in both genders. However, the consumption levels differed by gender. Women had generally higher use of psychotropic drugs in both periods, but the increase in consumption was more relevant in men, specifically in relation to anxiolytics (Fig.31).. Use of psychotropic medication in 2008 and 2015 according to gender 25 20.8 20 16.7 15. 10. 16.7 17.3. 16.2 13.3. 12.8. 11.6. 7.7 5.5. 5. Men 2008. 6. Men 2015. 3.6 0.6 0.7 0.6 0.9. 0 Sleep medication. Antidepressants. Anxiolytics. Women 2008 Women 2015. Antipsychotics. figure 31 use of psychotropic medication in 2008 and 2015 according to gender. Under-treatment and barriers to treatment Data was obtained regarding perceived need for treatment, help-seeking behaviours and main barriers to the utilization of mental health care and treatment gap.. Perceived need Participants were asked if they had obtained treatment for mental health problems or if they had felt that they might be in need of professional help for mental health problems but had never sought help.. Received treatment Participants were asked if they had actually received treatment for mental health problems once the need was recognized.. mh crisis impact · report 1 · 18.
(20) Minimally Adequate Treatment The proportion of the participants who received Minimally Adequate Treatment, based on the definition provided by the World Mental Health Survey Initiative, was considered as follows: i) at least 4 visits in the prior year to any type of provider; OR ii) at least 2 visits and any type of medication (i.e., includes medications known to be not suitable for the disease being assessed).. Barriers to treatment Participants who recognized the need for treatment but did not seek treatment were asked what were the reasons for never having sought help, choosing from a list of potential attitudinal and structural barriers.. Under-treatment of people with major depressive episode In the group of participants with a diagnosis of major depressive episode (n=94), only 63.8% recognized the need for treatment. Among these depressed participants who recognized their need for treatment, 87.2% received treatment, but only 75.9% of these received a minimally adequate treatment. This means that, among the 94 participants who were diagnosed with a major depressive episode, only 49 received a minimally adequate treatment, even though it was defined in such a non-demanding way (Fig.32).. Perceived need (n=66). 63.8%. Received treatment (n=61). 87.2%. Minimally adequate treatment (n=49). 75.9%. figure 32 under-treatment of people with major depressive episode. Under-treatment of people with generalized anxiety disorder In the group of participants with a diagnosis of generalized anxiety disorder (n=60), only 70.8% recognized their need for treatment. Among these, 78.4% received treatment, and 83.2% of these received a minimally adequate treatment. Thus, among the 60 participants who were diagnosed with a generalized anxiety disorder, only 33 received a minimally adequate treatment (Fig.33).. Perceived need (n=43). 70.8%. Received treatment (n=40). 78.4%. Minimally adequate treatment (n=33). 83.2%. figure 33 under-treatment of people with generalized anxiety disorder. mh crisis impact · report 1 · 19.
(21) Barriers to treatment in 2008 and 2015 The results suggest that, between 2008 and 2015, the most relevant increase was in the structural barriers. The most frequent barrier in both years was the low perceived need, the non-recognition of the need for treatment (Fig.34). The barriers most often mentioned by participants who wanted to receive care and did not get it were the structural ones - for example, difficulties in covering the costs and difficulties in getting appointments. Some attitudinal barriers, such as denial of help, perceived ineffectiveness of treatment and stigma, also prevented the search for treatment.. Barriers to treatment in 2008 and 2015 46.9. 48. 43.7. 41.3. 36.5. 36 30.6. 30.2. 24. 12 2008 0. 2015 Low Perceived Need. Structural Barriers. Attitudinal Barriers. figure 34 barriers to treatment in 2008 and 2015. key points • 27.9% of the respondents sought treatment for mental health problems in the last 5 years • GPs were the most contacted professionals followed by psychiatrists and psychologists • The use of psychotropic drugs was higher in women and increased from 2008 to 2015 • Low perceived need and structural barriers were the main obstacles for access to care and increased since 2008. mh crisis impact · report 1 · 20.
(22) PART TWO. Qualitative study 1. objective The spill-over effects of the economic recession on mental health are difficult to account resorting only to quantitative measures. Giving voice to users and health professionals is imperative to better understand the economic crisis consequences and to plan initiatives to improve responsiveness of services in terms of quality of care, efficiency and effectiveness (25). Users and health professionals are major stakeholders in care delivery; however, so far qualitative evidence of their experiences on mental health during the economic recession is almost non-existent. The MH Crisis Impact Study included an on-going qualitative study with the objective to explore users’ and primary care health professionals’ perceptions on the impact of the economic recession on the mental health of the population and on mental health care delivery. This qualitative study will complement and enrich the information provided by the epidemiological data.. Figure 35 presents the main characteristics of the study:. data collection site. primary health care centers. strategy of data collection. study population. Focus groups. Users. Semi- structured interviews. Health professionals. figure 35 methods of data collection. 2. methods • Primary health care centres were found to be the best setting for data collection. A geographical delimitation using key socioeconomic indicators was put in place to select primary health care units in areas with higher probability of economic recession negative impact in the Lisbon Metropolitan Area. • The study was carried out in two of the three selected sites: a suburban area located in an old industrial metropolitan axis (Póvoa Santa Iria UCSP) and a suburban area located in a recent metropolitan expansion axis, which is largely occupied by semi and unskilled services and industry workers (São Marcos USF). • The choice of conducting focus groups among primary health care users was based on the interest to explore the interaction and comparison of experiences between participants. After consulting with primary health care professionals, it was decided to conduct semi-structured interviews with this group, to avoid time limitations and ensure that the participants would feel comfortable expressing their views and opinions. • 24 semi-structured interviews with health professionals and 4 focus groups with 22 users have been conducted so far. The study is projected to be also carried out in the Olivais UCSP in a near future. • All the semi-structured interviews and focus groups already completed were transcribed verbatim, analysed and codified, resorting to content analysis through an iterative and reflexive process. • A hermeneutic analysis of the transcripts, using constant comparison and category building procedures, will allow the researchers to identify major themes with the support of QSR NVivo 10 Software. Preliminary findings resulting from the coding and category building process are presented in Figure 36.. mh crisis impact · report 1 · 21.
(23) Financial deprivation Socioeconomic changes. Unemployment Job insecurity and stress. themes. Depression and anxiety Mental Health. Psychotropic medication Disability Lack of human and material resources Co-payments. Health Services. Lack of specialty consultations Lack of mental health professionals Administrative difficulties. figure 36 preliminary results of the qualitative study. 3. preliminary results • Analysis of preliminary qualitative data indicated that both users and health professionals established an association between the economic crisis and deterioration of mental health. • The mechanisms identified for such deterioration were mainly changes in socioeconomic conditions, such as financial deprivation, unemployment, and more demanding and insecure jobs. • Both users and professionals reported perceiving an increase in depression and anxiety and in the consumption of psychotropic medication. • Regarding the utilization of services, both users and professionals considered co-payments and the lack of GP’s and mental health professionals the major obstacles to provision of care. This qualitative approach aims to contribute to the current knowledge of the effects of the economic crisis in Portugal on mental-ill health and well-being of the population. The added value of this study lies on its concern with the underlying values, perceptions, attitudes and behaviours related to mental health and utilization of health care by users and health professionals in the specific context of an economic recession, in (sub)urban geographical areas particularly affected by the economic recession. By integrating users and health professionals, it is ensured that all views may contribute to help redefining current knowledge for better coordinated provision of care and efficiency improvement.. mh crisis impact · report 1 · 22.
(24) Final conclusions • There was a significant increase in the prevalence of psychological distress, especially in the group of participants with more severe problems, from 2008 to 2015 • The proportion of people reporting a common mental disorder diagnoses was higher among women, the elderly, less educated participants, individuals with higher perceived financial deprivation, unemployed and retired people, and those with lower social support and lower community involvement • 27,9% of the participants sought treatment for mental health problems in the last 5 years • GPs were the most contacted professionals followed by psychiatrists and psychologists • Use of psychotropic drugs was higher in women and increased from 2008 to 2015 • Low perceived need and structural barriers, the main obstacles for access to care, increased since 2008 • Despite the financial and staff cuts suffered since 2008, overall, mental health services showed some capacity to adapt to the pressure of the increasing needs of the population • Available data, however, revealed significant insufficiencies in terms of accessibility and quality of care • Preliminary results of the qualitative study indicate that both users and health professionals link the economic crisis to a deterioration of mental health, particularly due to changes in socioeconomic conditions • Co-payments, lack of family doctors and mental health professionals were perceived as the major challenges to the provision of care. mh crisis impact · report 1 · 23.
(25) References 1. Martin-Carrasco M, Evans-Lacko S, Dom G, Christodoulou NG, Samochowiec J, González-Fraile E, et al. EPA guidance on mental health and economic crises in Europe. Eur Arch Psychiatry Clin Neurosci. 2016;266(2):89–124. 2. Karanikolos M, Mladovsky P, Cylus J, Thomson S, Basu S, Stuckler D, et al. Financial crisis, austerity, and health in Europe. Lancet. 2013;381(9874):1323–31. 3. Legido-Quigley H, Karanikolos M, Hernandez-Plaza S, de Freitas C, Bernardo L, Padilla B, et al. Effects of the financial crisis and Troika austerity measures on health and health care access in Portugal. Health Policy. 2016;120(7):833–9. 4. Angerer J. Stability and Growth Pact - An Overview of the Rules. European Parliament; 2015 5. OECD. National Accounts at a Glance 2015. OECD Publishing; 2015. 6. Eurostat. Total unemployment - LFS series. Unemployment rates by sex, age and nationality. Eurostat; 2017. 7. World Health Organization. The impact of the financial crisis on the health system and health in Portugal. Geneva. World Health Organization; 2014. 8. Frasquilho D, Matos MG, Salonna F, Guerreiro D, Storti CC, Gaspar T, et al. Mental health outcomes in times of economic recession: a systematic literature review. BMC Public Health. 2016;16(1):115. 9. Parmar D, Stavropoulou C, Ioannidis JPA. Health outcomes during the 2008 financial crisis in Europe: systematic literature review. BMJ. 2016;354. 10. Marmot SM, Bloomer E, Goldblatt P. The Role of Social Determinants in Tackling Health Objectives in a Context of Economic Crisis. Public Health Rev. 2013;35(1):9. 11. Marmot M, Allen J, Bell R, Bloomer E, Goldblatt P. WHO European review of social determinants of health and the health divide. Lancet. 21;380(9846):1011–29. 12. Wilkinson R, Marmot M. Determinants of Health the Solid Facts. WHO Regional Office for Europe; 2003. 13. Friel S, Marmot M. Global Health lnequities Structures, Power, and the Social Distribution of Health. In: Parker R, Sommer M, editors. Routledge handbook of global public health. New York: Routledge; 2008. 14. Cervero-Liceras F, McKee M, Legido-Quigley H. The effects of the financial crisis and austerity measures on the Spanish health care system: A qualitative analysis of health professionals’ perceptions in the region of Valencia. Health Policy. 2015;119(1):100–6. 15. Caldas-de-Almeida J, Xavier M. Estudo Epidemiológico Nacional de Saúde Mental - 1.o Relatório [National Mental Health Epidemiological Study - 1st Report]. Lisboa: Faculdade de Ciências Médicas; 2013. 16. Kessler RC, Andrews G, Colpe LJ, Hiripi E, Mroczek DK, Normand SLT, et al. Short screening scales to monitor population prevalences and trends in non-specific psychological distress. Psychol Med. 2002;32(6):959–76. 17. Andrews G, Slade T. Interpreting scores on the Kessler Psychological Distress Scale (K10). Aust N Z J Public Health. 2001;25(6):494–7. 18. Kessler RC, Calabrese JR, Farley PA, Gruber MJ, Jewell MA, Katon W, et al. Composite International Diagnostic Interview screening scales for DSMIV anxiety and mood disorders. Psychol Med. 2013;43(8):1625–37. 19. Ahnquist J, Wamala SP. Economic hardships in adulthood and mental health in Sweden. the Swedish National Public Health Survey 2009. BMC Public Health. 2011; 11(1):788. 20. Garbarski D. Perceived social position and health: Is there a reciprocal relationship? Soc Sci Med. 2011;70(5):692–9. 21. Turner RJ, Brown RL. Social support and mental health. In: Scheid TL, Brown TN, editors. A handbook for the study of mental health: Social contexts, theories, and systems. 2nd edition. New York: Cambridge University Press; 2010. 22. Ozbay F, Johnson DC, Dimoulas E, Morgan CA, Charney D, Southwick S. Social support and resilience to stress: from neurobiology to clinical practice. Psychiatry. 2007;4(5):35–40. 23. Fone D, White J, Farewell D, Kelly M, John G, Lloyd K, et al. Effect of neighbourhood deprivation and social cohesion on mental health inequality: a multilevel population-based longitudinal study. Psychol Med. 2014;44(11):2449–60. 24. Ware JE, Snow KK, Kosinski M, Gandek B. SF-36 Health Survey Manual and Interpretation Guide. Bost New Engl Med Cent. 1993. 25. Thornicroft G, Tansella M. Growing recognition of the importance of service user involvement in mental health service planning and evaluation. Epidemiol Psichiatr Soc. 2005;1–3.. mh crisis impact · report 1 · 24.
(26) www.crisisimpact.com.
(27)
Imagem
+7
Documentos relacionados
From the 12 studies included (13 entries) in this meta-analysis, they all started from the same research assumption, in which the elderly with classifications according to the
Mediante isso, outros trabalhos do mesmo gênero foram realizados posteriormente, evidenciando que os gêneros Meloidogyne, Pratylenchus, Heterodera, Rotylenchulus e Helicotylecnhus são
Ousasse apontar algumas hipóteses para a solução desse problema público a partir do exposto dos autores usados como base para fundamentação teórica, da análise dos dados
Considering the purpose of the study was to describe the profile of the participants and the fre- quency of the occurrence of risk factors for moral distress, a study with a sample
this study was to analyze the epidemiological profile and spatial distribution of suicide cases in the state of Sergipe (from 2000 to 2015) and to describe
It is noteworthy that all West African Portuguese Creoles and Atlantic Creoles more generally constrast subject and object pronouns as Kriyol does, through word order only for
A cultura e o meio envolvente onde o indivíduo se encontra inserido, desempenham um papel significante no processo de escolha de carreira (Greenhaus et al.
As TIC têm tido efeitos muito diversos. Se alguns são extremamente atracti- vos, outros não deixam de ser francamente problemáticos. Assim, por um lado, elas proporcionam
