SALOMÃO, M. C. de F.; BAUER, E.; KAZMIERCZAK, C. de S. Drying parameters of rendering mortars. Ambiente 7
Parâmetros de secagem de argamassas de revestimento
Maria Cláudia de Freitas Salomão
Elton Bauer
Claudio de Souza Kazmierczak
Abstract
he objective of this article was to study the drying behavior of rendering mortars. Cement-lime mortars with different mix proportions were evaluated to analyze the influence of mix materials on water transport. The experimental program was produced to observe the transport of liquid water and vapor water in mortars during the drying process. The liquid water transport was studied through capillary absorption and the water vapor transport by the water vapor permeability test. The drying curves used to investigate drying kinetics were obtained according to the methodology recommended by European standard EN 16322. In summary, it is possible to affirm that the aggregate, the binder and water contents determine the behavior of the mortars regarding water transport. The drying index is considered a good indicator of the easiness of both liquid and vapor water transport.
Keywords: Rendering mortar. Drying. Water vapor permeability. Capillarity.
Resumo
Esse artigo se propõe a estudar o comportamento na secagem de argamassas de revestimento. Foram estudadas argamassas mistas de cimento Portland, cal hidratada, em diferentes proporções de dosagem com o objetivo de verificar a influência dos parâmetros de dosagem no transporte de água. A etapa experimental foi conduzida para observar o transporte de água líquida e vapor durante a secagem. O transporte de água líquida foi estudado a partir da absorção por capilaridade, e o transporte de vapor de água no ensaio de permeabilidade de vapor de água. A cinética de secagem foi estudada a partir de curvas de secagem obtidas de acordo com a metodologia de ensaio proposta pela norma europeia EN 16322. Em síntese, é possível afirmar que o tipo de agregado, o teor de aglomerantes e o teor de água são determinantes do comportamento das argamassas quanto ao transporte de água. O índice de secagem se mostrou um indicativo importante para interpretar a facilidade de transporte de água líquida e vapor em argamassas.
Palavras-chaves: Argamassa de revestimento. Secagem. Permeabilidade ao vapor de
água. Capilaridade.
T
Maria Cláudia de Freitas Salomão Universidade Federal de Uberlândia Uberlândia – MG – Brasil Elton Bauer Universidade de Brasília Brasília - DF - Brasil Claudio de Souza Kazmierczak Universidade do Vale do Rio dos Sinos São Leopoldo - RS - Brasil Recebido em 20/03/17
Introduction
Rendering mortars play an important role in the conservation of buildings once they help to protect against climate actions, mechanical shocks and affect the comfort and durability of buildings. Regarding durability, the presence of water potentially accelerates the degradation process of rendering mortars once it facilitates the entry of deleterious agents and solubilizes the salts (FREITAS; COSTA; DELGADO, 2013; ABERLE; KELLER; ZURBRIGGEN, 2007). However, the water flow through the mortar pores can also indicate a greater ease of degradation.
During the drying process, the soluble salt crystals may crystallize giving rise to efflorescence or leaching inert materials into the pores causing staining (PEL; HUININK; KOPINGA, 2003). Also, the drying difficulty of a saturated material may facilitate the growth of fungi and algae that degrade mortars and compromise the habitability of the environment where it is applied (JOHANSSON et
al., 2012; ESCADEILLAS et al., 2007).
In general terms, the process of drying can be defined as the transfer of a liquid (normally water) from the pores of a solid material to the surrounding air (HALL; HOFF; NIXON, 1984). The drying mechanism can be represented by a drying curve, which shows the loss of moisture content over time. It can be separated into two distinct phases (Figure 1) (SCHEFFLER; PLAGGE, 2010; GONÇALVES; BRITO; PEL, 2012).
The first phase is characterized by linear weight loss over time. During this step, the speed at which moisture reaches the material surface is faster than the rate at which moisture is evaporated. The surface where evaporation takes place is the drying front. In the second phase, moisture transport slows down and the vapor content lost to the environment is higher than the content that actually reaches the surface. At this stage, the drying front is inside the material and no longer on its surface, so the vapor diffusion from the interior to the surface of the material is increased.
Drying kinetics is dependent on the moisture distribution in the material which, in turn, is a function of environmental conditions and intrinsic characteristics of the material (MATIASOVSKY; MIHALKA, 2014; GONÇALVES; PEL; RODRIGUES, 2009).
Environmental conditions influencing drying processes include ambient temperature, air velocity, and relative humidity (KARAGIANNIS et al., 2017; JACOBSEN; AARSETH, 1999). Maroulis and Saravacos (2005), for example, investigated the effect of drying conditions such as air temperature and relative humidity. It was observed that equilibrium humidity at the end of the drying process was higher with decreasing air temperature and increasing relative humidity. More broadly, hygrothermal simulation has shown that climatic agents influence the behavior of renders differently, according to the main facade orientations and the dry and rainy periods of the year (ZANONI, 2015).
Figure 1 - The drying curve with two distinct phases
Regarding the intrinsic characteristics of the material, some investigations indicate that the drying process varies according to the mortars` composition and microstructure (CULTRONE; SEBASTIÁN; ORTEGA HUERTAS, 2007; GRILO et al., 2014). For instance, drying kinetics of an aerial lime mortar is clearly distinct from that of a cement mortar. Aerial lime mortars have a longer initial period of constant drying rate and lower moisture content in their phase two of drying, due to its shorter number of small diameter pores, when compared to cement mortars (SILVA; FERREIRA PINTO; GOMES, 2015; MOSQUERA
et al., 2006). A greater open porosity of the mortars
favors a greater water absorption, a greater permeability to water vapor and a lower resistance to the diffusion of water vapor and, therefore, a facilitated drying process indicated by the lower drying process index (PÁSCOA, 2012; GRILO et
al., 2014). Likewise, the increasing of aggregate
content may be related to higher drying rates in lime mortars (ARIZZI; CULTRONE, 2014).
Furthermore, the coating roughness and finishing layer can also influence the drying process (CULTRONE; SEBASTIÁN; ORTEGA HUERTAS, 2007, GRILO et al., 2014). A painted finishing coat can reduce the rate of evaporation, therefore, when this layer is present, the drying front may be located closer to the surface of the material (GONÇALVES; PEL; RODRIGUES, 2009). Among the test methodologies available to assess the drying process on building materials, it is possible to use non-destructive methods that provide an approach for moisture distribution and drying depth estimation, such as nuclear magnetic resonance (GONÇALVES; PEL; RODRIGUES, 2009) and impedance spectra (SUN et al., 2017). Nevertheless, a simple (gravimetric) evaporation test can provide information on the transport of liquid water and vapor, which can then be correlated with other physical parameters of mortars such as vapor permeability and water absorption (SCHEFFLER; PLAGGE, 2010; SOARES et al., 2014; FLORES-COLEN et al., 2016).
The experimental procedure for the characterization of the drying process has been described in a few international documents such as RILEM test No. II.5 (RILEM, 1980) and EN 16322 (EUROPEAN…, 2013). The above mentioned documents establish specific ambient conditions to evaluate the drying process, such as air temperature and relative humidity; and preparation procedures for specimens, like casting and dimensions. Although several authors follow these methodologies (GONÇALVES; BRITO; PEL, 2012; BRITO; GONÇALVES, 2013; GRILO et al., 2014; FLORES-COLEN et al., 2016; BORSOI et
al., 2016; KARAGIANNIS et al., 2017), these test
procedures have not been yet widely applied on typical Brazilian rendering mortars
.
Therefore, the purpose of this investigation is to apply the methodology proposed by the European standard EN 16322 (EUROPEAN…, 2013) in the evaluation of rendering mortars typically used in Brazil. Moreover, the main objective is to to indicate the influence of mortar mix proportions in the drying process. In addition, the drying parameters were correlated to other materials properties, such as water absorption by capillarity and water vapor permeability, to investigate the potentiality of drying parameters to express liquid water and vapor transport in rendering mortars.
Materials and methods
The experimental stage of this work consisted of observing the transport of liquid water and vapor during the drying process of different mortars, and then to analyze the most relevant parameters that affect this phenomenon. For this, composite mortars were prepared by mixing CPV Portland cement and CH I hydrated lime. Their characteristics are reported in Table 1 with natural riverbed sand. The Portland cement type CPV was used due to the minimal mineral addition in its composition (ABNT, 1991). Two types of aggregate suitable for producing coating mortars were used in this study, and the varying particle size distributions are shown in Figure 2.
The particle size distribution of the aggregates was determined using the fraction passing the 2.4-mm mesh sieve, and following the procedures indicated in the standard NBR NM 248 (ABNT, 2003). The specific gravity, uniformity coefficient, and fineness modulus were determined for the aggregates. The results in Table 2 show that the sand A1 is an aggregate with a non-uniform and well-graded particle size distribution. On the other hand, the finer sand A2 has a more uniform but poorly graded particle size distribution.
The mortars were prepared by varying the binders and aggregates ratios in order to generate mortars with different porous structures and, therefore, to facilitate the investigation of the mortar parameters that influence the drying process. The mix proportion was based on the method described by Selmo (1989). Among the mortars produced, the E6 mortars were prepared with more cement and lower aggregate/binders ratio. The E9 mortars had an intermediate aggregate/binders ratio, followed by E12 mortars with less cement and a higher aggregate/binders ratio. Table 3 shows the characteristics of the mortars (cement: lime:
aggregate), specifying the used cement quantity and the aggregate/binders and water/cement ratios. The mortars were prepared according to the mixing procedure indicated in the standard NBR 13276 (ABNT, 2005a). It is worth noting that this standard
was modified in 2016, after the experimental study was conducted. For the definition of water content all mortars should present a consistency value between 55 and 65 mm measured by the cone penetration test, according to the ASTM C780 (AMERICAN…, 2014).
Table 1 - Physical and chemical properties of cement and hydrated lime
Properties Value P o rt lan d cem en t Density [g/cm³] 3.11 Initial setting time [min] 160
SiO2 [%] 22.89 Al2O3 [%] 7.17 Fe2O3 [%] 2.97 CaO [%] 54.42 MgO [%] 4.33 K2O [%] 0.94 Na2O [%] 0.43 SO3 [%] 3.4 Density [g/cm³] 1.98 h y d ra te d lim e
Calcium and magnesium oxides
(non-volatile basis) [%] 97.29 SiO2 [%] 1.56 Al2O3 [%] 0.75 Fe2O3 [%] 0.37 CaO [%] 61.2 MgO [%] 17.67 K2O [%] 0.07 Na2O [%] 0.18 SO3 [%] 0.19
Figure 2 – Particle size distribution of fine aggregates
Table 2 – Aggregates physical characteristics
Properties Sand A1 Sand A2
Specific density [g/cm³] 2.64 2.64
Uniformity coefficient 6.2 2.5
Table 3 – Mortars` composition Morta r Aggregate Mix proportion (mass) Cement [kg/m³] Aggregate/ Binder [kg/kg] water/ cement [kg/kg] H [%] A1E6 A1 1 : 0.17 : 6 256 5.13 1.22 17.1 A1E9 A1 1 : 0.37 : 9 175 6.58 1.78 17.2 A1E12 A1 1 : 0.66 : 12 131 7.23 2.41 17.7 A2E6 A2 1 : 0.07 : 6 263 5.61 1.17 16.6 A2E9 A2 1 : 0.22 : 9 175 7.38 1.86 18.2 A2E12 A2 1 : 0.45 : 12 131 8.27 2.54 18.9 In the hardened state, water absorption by
capillarity, vapor permeability and the evaporation drying profile of the mortars were experimentally investigated. For each prepared mortar, six prismatic mortar specimens were molded without release agents (4 cm x 4 cm x 16 cm) following the procedures described in NBR 13279 (ABNT, 2005b), and then used in the capillary absorption and drying test. In addition, a cylindrical specimen (with 10 cm in diameter and 20 cm in height) were used in the vapor permeability test. The mortar specimens were demolded seven days later and maintained at constant temperature and humidity, 20°C and 50%, respectively, until testing started on the 28th day.
The methodology followed to determine capillary water absorption was based on the European standard EN 1015-18 (EUROPEAN…, 2002). The preparation for the test consists of painting the sides of the prismatic mortar specimens with epoxy resin-based structural adhesive and oven drying at 60°C for 24 hours followed by mass stabilization at 20°C temperature and 50% humidity, for another 24 hours. The procedure consists of weighing the specimen over 4 hours with one of the transverse faces in contact with a 5-mm water depth. The result is a capillarity coefficient (A), given by the mass difference at 90 and 10 minutes. This coefficient is expressed in kg/(m².min0.5 ), as indicated by EN
1015-18 (EUROPEAN…, 2002) and also in g/(dm².min0.5 ), as indicated in the Brazilian
standard NBR 15259 (ABNT, 2005c).
The vapor permeability of the mortars was determined using cross-sections of the cylindrical specimens approximately 10 mm thick. The methodology adopted was the desiccant method, in which the test specimen is sealed to the open mouth of a test dish containing a desiccant (calcium chloride anhydrous), and the assembly is placed in a controlled atmosphere at 20ºC while the constant relative humidity (~ 70%) is maintained by aqueous sodium chloride solutions (FOŘT et al., 2014; KUISHAN; XU; JUN, 2009). The specimens were weighed periodically until their mass varied linearly with time. This corresponds to a steady state regime
where the amount of vapor flowing through the specimens per unit time is constant. The results of the vapor permeability test are expressed in terms of water vapor permeability (δ) in kg / (m.s.Pa) and water vapor resistance factor (μ) (EUROPEAN…, 2001).
The drying test was based on the procedure described in the standard EN 16322 (EUROPEAN…, 2013). According to the European standard, by determining the amount of water present in the specimen per unit of area over time, it is possible to determine the drying curve and the drying rates in the first stage of drying, D1, and in the second phase of drying, D2 (EUROPEAN…, 2013). The D1 rate, expressed as kg/m²h, is given by the slope of the initial linear portion of the drying curve (per unit area) over time, in hours. The D2 rate, kg/(m²h0.5), is the slope of the linear part of the
drying curve (per unit area) over the square root of time.
The drying curve allows calculating the drying index, which can be used to evaluate the speed and quantity of water that evaporated from the mortar samples over time (BRITO; GONÇALVES; FARIA, 2011; GRILO et al., 2014). The drying index (Di) is related to the resistance of the mortar
to the drying process and is obtained by Equation 1 (SOARES et al., 2014). The higher the drying index, the more difficult it becomes for the material to lose water to the environment.
𝐷𝐷𝑖𝑖=
∫ 𝑓𝑓�𝑡𝑡0𝑡𝑡𝑓𝑓 𝑀𝑀𝑥𝑥−𝑀𝑀1𝑀𝑀1 �𝑑𝑑𝑑𝑑
�𝑀𝑀3−𝑀𝑀1𝑀𝑀1 �×𝑑𝑑𝑓𝑓
Eq. 1 Where:
Mx is the mass of the specimen during the drying
process (g);
M1 is the mass of oven-dried specimen (g);
M3 is the mass of the saturated specimen (g) is the
initial mass at the beginning of the drying process; and
tf is the end of drying test (h).
Regarding size and preparation of the specimens, the European standard indicates that the samples
must be no less than 10mm thick and all faces, except the test surface, must be sealed with a waterproof material. In this study, 10-mm thick cross sections from the prismatic mortar specimens were used in the tests. The assay was conducted at 20 °C room temperature and 50% relative humidity. The mortar samples were prepared by immersion saturation, without the waterproofing of the faces, similar to the procedures adopted by Páscoa (2012) and Soares et al. (2014).
Results and discussions
Properties of fresh mortars
The results the fresh mortars properties are shown in Table 4. The target consistency set between 55 mm to 65 mm for fresh mortars with similar workability and measured by the cone penetration depth, was achieved for all mortars. The water content of the mortars varied between 17.1% and 18.9%, which is the water added in relation to the dry materials (binders and aggregate). The air content measured in mortars varied between 7% and 9%. The fresh mass density in turn varied between 1994 kg/m³ (A1E9) and 1957 kg/m³ (A2E12) (Table 4). All mortars were classified in the D5 range according to the standard NBR 13281 (ABNT, 2005d).
In general, the results showed that fresh mortars have similar workability and their different characteristics result from the different content of binders and the type of aggregate used.
Capillary water absorption and
water vapor permeability
The water absorption test classified the mortars into three distinct behaviors (Table 5). The water uptake was higher as the binders’ content decreased. The lowest water absorption capacity was observed in
the E6 mortars, followed by E9 and E12 mortars. Regarding the sand type, the mortars containing sand A1 (less uniform and with a greater fineness modulus) had a lower capillarity coefficient since they absorbed less water during the test, compared to A2.
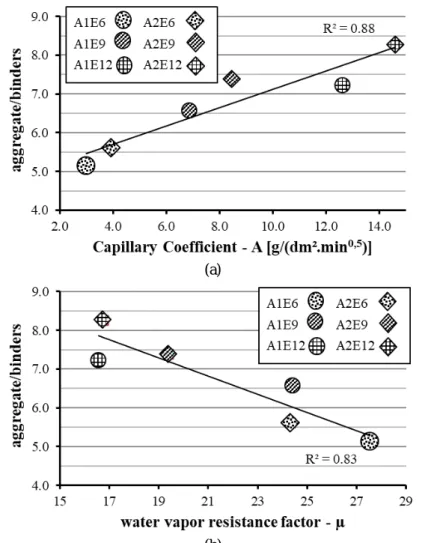
The capillarity coefficients of the mortars increase as the binder content of the mortars decreases (Figure 3a). Also, the aggregate content influences the water transport by capillarity more than the aggregate type. A probable explanation for this result is that the increase of aggregate content accompanied by the increase of the water/cement ratio (Table 3) has generated a more porous paste in the mortars.
The results for the water vapor permeability of mortars are presented in Table 4. The results allow us to conclude that the vapor permeability increased as the binder content decreased. However, the order of magnitude of permeability is very close for all mortars. The measured values ranged from 7x10-12
to 11.6x10⁻¹² [kg / (m.s.Pa)].
Another way of expressing these results is through the diffusion resistance factor of the water vapor (μ). The resistance to the diffusion of the water vapor increases with the increase of the amount of the binder. It is noteworthy that A2 mortars have lower resistance to water vapor in the E6 and E9 classes, compared to A1 mortars, except for the A1E12 and A2E12 mortars that presented the same behavior regarding vapor permeability.
It was also found that water vapor diffusion in mortars is quite dependent on the content of binders (Figure 3b). This result may be related to the fact that the greater presence of aggregates leads to the increased porosity, thus facilitating the passage of water vapor (ISSAADI et al., 2015). Also, Veiga (1998) observed that lower permeability to liquid water also corresponds to a lower permeability to water vapor permeability (Figure 4).
Table 4 – Properties of fresh mortars
Mortar Cone [mm] H [%] Bulk density of fresh
mortar [g/cm³] Air content (gravimetric) [%] A1E6 58 17.1 1.99 8 A1E9 58 17.2 1.99 7 A1E12 58 17.7 1.96 7 A2E6 56 16.6 1.96 9 A2E9 58 18.2 1.96 7 A2E12 58 18.9 1.96 7
Table 5 - Characterization of the hardened mortars: capillarity coefficient (A), water vapor permeability (δ) and water vapor diffusion resistance factor (µ)
Mortar A [g/(dm².min0.5 )] /[kg/(m².min0.5 )] δ [(10-12)kg/(m.s.Pa)] μ A1E6 3.0 / 0.3 7.0 28 A1E9 6.9 / 0.7 7.9 24 A1E12 12.6 / 1.3 11.6 17 A2E6 3.9 / 0.4 8.0 24 A2E9 8.5 / 0.8 10.0 19 A2E12 14.6 / 1.5 11.6 17
Figure 3 - Relationship between aggregate/binders ratio with the capillarity coefficient (a) and diffusion resistance factor of the water vapor (b)
(a)
(b)
Drying
The drying curves are shown in Figure 5a as a function of time (h) and the square root of time (h0.5), in Figure 5b. It is possible to observe that the
moisture content absorbed by immersion (initial drying value) is higher in mortars with lower binder content. Both graphs show that the A1E6 and A2E6 mortars behave differently from the other mortars due to the lower moisture content.
The first stage of the drying rate, D1, varied only as a function of the used aggregate. Mortars made from A2 sand lost water faster compared to mortars produced with A1: 0.11 kg/m²h and 0.13 kg/m²h, for A1 and A2, respectively (Table 6). In the second stage of the drying curve, the drying rate increased with decreasing binder content, indicating that the binder matrix plays a role in preventing the water l through the pores of the mortars. Since the other measured properties also indicated that the binder content affected more the mortar behavior
compared to the type of aggregates used, the very similar D1 values may indicate the possibility of another interpretation of the role played by the aggregate granulometry in the drying process. Therefore, it is possible that the very small thickness of the specimens facilitated the drying process (PÁSCOA, 2012), making it difficult to analyze the initial moments of drying.
The calculated drying index (Di) can be interpreted
as the easiness with which liquid water and vapor exit through the mortar pores. It is observed that the lower drying index values found for mortars E12 indicate that these systems can dry easier and faster (Table 6). On the other hand, the E6 mortars had the highest drying rates. Regarding the used sand, it was observed that the A1 mortars had higher drying rates compared to those with similar amount of binders, but produced with A2 sand (finer and more uniform than A1).
The behavior of the mortars during the drying process can be compared with the one observed in water absorption (Figure 6a) and water vapor permeability (Figure 6b) since the drying process encompasses transport mechanisms of liquid water
and vapor. This correlation was also observed by Flores-Colen (2009) and Páscoa (2012). It can be said that the higher the absorbed water content, the greater the transport velocity of liquid water and vapor to the surface where evaporation occurs and, therefore, the lower the drying index.
Hypothetically, the drying data allow us to infer the behavior of these mortars if they were exposed long enough to a moisture source sufficient to saturate them, and then, maintained in a suitable environment for drying. The A2E12 mortar would quickly absorb water and achieve a higher moisture content than the others. However, this same mortar would lose the water content (to the environment or another layer) more quickly and, at the end of drying, the content of residual water in the pores would be lower than for the other mixtures. At the other extreme, the saturation of the A1E6 mortar would require exposure to a high-intensity source of moisture for a long period to saturate it completely, once thist occurred, the material would dry out slowly, remaining humid for a longer time and keeping a higher moisture content in pores compared to the other mortars.
Figure 5 – Drying curves of the mortars as a function of time (a) and the square root of time (b)
(a)
(b)
Table 6 - Drying parameters of the mortars
Mortar D1 [kg/m²h] D2 [kg/(m²h0.5)] D i A1E6 0.11 0.51 0.14 A1E9 0.11 0.56 0.13 A1E12 0.11 0.65 0.11 A2E6 0.13 0.53 0.14 A2E9 0.13 0.54 0.09 A2E12 0.13 0.59 0.09
Figure 6 - Relationship between: water absorption by capillarity - A with drying (a) and vapor permeability - µ with drying (b)
(a) (b)
Conclusions
After evaluating the behavior of the studied mortars, the following conclusions can be reached: (a) in summary, it is possible to affirm that the aggregate, the binder and water contents determine the behavior of the mortars regarding water transport;
(b) the aggregate content affects more the water ingress by capillarity than the aggregate
granulometry, probably because the increment of the aggregate is accompanied by the rise of the water/cement ratio which increases the porosity of the mortars. For similar aggregate/binders ratio mortars, those produced with aggregate A1 show lower water absorption;
(c) mortars with higher binder content have lower water vapor permeability compared to those with higher aggregate/binders` ratio. This fact is associated with the binder matrix working as a barrier, offering resistance to vapor diffusion through the porous structure of the mortars. Moreover, it is important to notice that by changing the aggregate/binder ratio the porosity was also affected, contributing to the behavior observed;
(d) the interpretation of the parameters of the European standard EN 16322 (AMERICAN…, 2013) was not enough to indicate precisely the drying kinetics of the liquid and vapor phases. The drying index was an important indicator to interpret the phenomenon. However, the D1 and D2 drying rates did not contribute to the analyses of this study, possibly because the specimen thickness influenced the drying rate of the first phase;
(e) nevertheless, it was possible to verify the relationship of the drying index with the capillarity coefficient and the resistance to vapor diffusion. The results allow inferring that the drying index is
a good indicator of the easiness of liquid water and vapor transport; and
(f) a suggestion for further research is to investigate the drying rates using larger mortar specimens to verify the influence of the dosing parameters in the two drying stages.
References
ABERLE, T.; KELLER, A.; ZURBRIGGEN, R. Efflorescence Mechanisms of Formation and Ways to Prevent. In: CONGRESSO NACIONAL DE ARGAMASSAS DE CONSTRUÇÃO, 2., Lisboa.
Anais.... Lisboa, 2007.
AMERICAN SOCIETY FOR TESTING AND MATERIALS. C780: standard test method for preconstruction and construction evaluation of mortars for plain and reinforced unit masonry. West Conshohocken, 2014.
ARIZZI, A.; CULTRONE, G. The Water Transfer Properties and Drying Shrinkage of Aerial Lime-Based Mortars: an assessment of their quality as repair rendering materials. Environmental Earth
Sciences, v. 71, n. 4, p. 1699–1710, 2014.
ASSOCIAÇÃO BRASILEIRA DE NORMAS TÉCNICAS. NBR 5733: cimento Portland de alta resistência inicial. Rio de Janeiro, 1991.
ASSOCIAÇÃO BRASILEIRA DE NORMAS TÉCNICAS. NBR 13276: argamassa para assentamento e revestimento de paredes e tetos: preparo da mistura e determinação do índice de consistência. Rio de Janeiro, 2005a.
ASSOCIAÇÃO BRASILEIRA DE NORMAS TÉCNICAS. NBR 13279: argamassa para
assentamento de paredes e revestimento de paredes e tetos: determinação da resistência à tração na flexão e à compressão. Rio de Janeiro, 2005b.
ASSOCIAÇÃO BRASILEIRA DE NORMAS TÉCNICAS. NBR 13281: argamassa para assentamento e revestimento de paredes e tetos: requisitos. Rio de Janeiro, 2005d.
ASSOCIAÇÃO BRASILEIRA DE NORMAS TÉCNICAS. NBR 15259: argamassa para assentamento e revestimento de paredes e tetos: determinação da absorção de água por capilaridade e do coeficiente de capilaridade. Rio de Janeiro, 2005c.
ASSOCIAÇÃO BRASILEIRA DE NORMAS TÉCNICAS. NBR NM 248: agregados:
determinação da composição granulométrica. Rio de Janeiro, 2003.
BORSOI, G. et al. Optimization of Nanolime Solvent for the Consolidation of Coarse Porous Limestone. Applied Physics A: Materials
Science and Processing, v. 122, n. 9, 2016.
BRITO, V.; GONÇALVES, T. D. Drying Kinetics of Porous Stones in the Presence of NaCl and NaNO3: experimental assessment of the factors affecting liquid and vapour transport. Transport
in Porous Media, v. 100, n. 2, p. 193–210, 2013.
BRITO, V.; GONÇALVES, T. D.; FARIA, P. Coatings Applied on Damp Building Substrates: performance and influence on moisture transport.
Journal of Coatings Technology and Research,
v. 8, n. 4, p. 513–525, 2011.
CULTRONE, G.; SEBASTIÁN, E.; ORTEGA HUERTAS, M. Durability of Masonry Systems: a laboratory study. Construction and Building
Materials, v. 21, n. 1, p. 40–51, 2007.
ESCADEILLAS, G. et al. Accelerated Testing of Biological Stain Growth on External Concrete Walls: part 1: development of the growth tests.
Materials and Structures, v. 40, p. 1061–1071,
2007.
EUROPEAN COMMITTEE FOR
STANDARDIZATION. EN 1015-18: methods of test for mortar for masonry: part 18: determination of water absorption coefficient due to capillary action of hardened mortar. Brussels, 2002. EUROPEAN COMMITTEE FOR
STANDARDIZATION. EN 16322: conservation of cultural heritage: test methods: determination of drying properties. Brussels, 2013.
EUROPEAN COMMITTEE FOR
STANDARDIZATION. EN ISO 12572: building materials: determination of water vapor
transmission properties. Brussels, 2001.
FLORES-COLEN, I. Metodologia de Avaliação
do Desempenho em Serviço de Fachadas Rebocadas na Óptica da Manutenção
Predictiva. PhD Thesis, Universidade Técnica de
Lisboa, Instituto Superior Técnico, 2009. FLORES-COLEN, I. et al. Drying Index For in-Service Physical Performance Assessment of Renders. Construction and Building Materials, v. 112, p. 1101–1109, 2016.
FOŘT, J. et al. Effect of Temperature on Water Vapor Transport Properties. Journal of Building
Performance Simulation, v. 38, n. 2, 2014.
GUIMARÃES, A. S.; DELGADO, J. M. P. Q; FREITAS, V. P. de. Degradation Control of Historical Walls with Rising Damp Problems. In: FREITAS, V. P. de; COSTA, A.; DELGADO, J. M. P. Q. Hygrothermal Behavior, Building
Pathology and Durability. p. 113-140, 2013.
GONÇALVES, T. D.; BRITO, V.; PEL, L. Water Vapor Emission From Rigid Mesoporous
Materials during the Constant Drying Rate Period.
Drying Technology, v. 30, p. 462–474, 2012.
GONÇALVES, T. D.; PEL, L.; RODRIGUES, J. D. Influence of Paints on Drying and Salt Distribution Processes in Porous Building
Materials. Construction and Building Materials, v. 23, p. 1751–1759, 2009.
GRILO, J. et al. New Natural Hydraulic Lime Mortars: physical and microstructural properties in different curing conditions. Construction and
Building Materials, v. 54, p. 378–384, 2014.
HALL, C.; HOFF, W. D.; NIXON, M. R. Water Movement in Porous Building Materials – VI: evaporation and drying in brick and block
materials. Building and Environment, v. 19, n. 1, p. 13–20, 1984.
ISSAADI, N. et al. Moisture Characterization of Cementitious Material Properties: assessment of water vapor sorption isotherm and permeability variation with ages. Construction and Building
Materials, v. 83, p. 237–247, 2015.
JACOBSEN, S.; AARSETH, L. I. Effect of Wind on Drying From Wet Porous Building Materials Surfaces: a simple model in steady state.
Materials and Structures, v. 32, p. 38–44, feb.
1999.
JOHANSSON, P. et al. Laboratory Study to Determine the Critical Moisture Level for Mould Growth on Building Materials. International
Biodeterioration & Biodegradation, v. 73, p. 23–
KARAGIANNIS, N. et al. Drying Kinetics of Building Materials Capillary Moisture.
Construction and Building Materials, v. 137, p.
441–449, 2017.
KUISHAN, L.; XU, Z.; JUN, G. Experimental Investigation of Hygrothermal Parameters of Building Materials Under Isothermal Conditions.
Journal of Building Physics, v. 32, n. 4, p. 355–
370, 2009.
MAROULIS, Z. B.; SARAVACOS, G. D. Drying Kinetics of Some Building Materials. Brazilian
Journal of Chemical Engineering, v. 22, n. 02, p.
203–208, 2005.
MATIASOVSKY, P.; MIHALKA, P. Pore Structure Parameters and Drying Rates of Building Materials. In: DELGADO, J. M. P. Q. Drying and
Wetting of Building Materials and Components. Berlin: Springer, 2014.
MOSQUERA, M. J. et al. Addition of Cement to Lime-Based Mortars: effect on pore structure and vapor transport. Cement and Concrete Research, v. 36, n. 9, p. 1635–1642, 2006.
PÁSCOA, L. Índice de Secagem Como
Parâmetro em Serviço dos Rebocos Aplicados em Paredes Exteriores. Master Thesis, Instituto
Técnico de Lisboa, 2012.
PEL, L.; HUININK, H. P.; KOPINGA, K. Salt Transport and Crystallization in Porous Building Materials. Magnetic Resonance Imaging, v. 21, n. 3–4, p. 317–320, abr. 2003.
RILEM. Recommended Tests to Measure the Deterioration of Stone and to Assess the
Effectiveness of Treatment Methods. Test no. II.5 – Evaporation Cruve. Materials Structures, v. 75, p. 175–253, 1980.
SCHEFFLER, G. A.; PLAGGE, R. Introduction of a Drying Coefficient for Building Materials.
ASHRAE Transactions, v. 116, 2010.
SELMO, S. M. S. Dosagem de Argamassas de
Cimento Portland e Cal Para Revestimentos de Fachada dos Edifícios. São Paulo, 1989.
Dissertação (Mestrado em Engenharia Civil) – Escola de Engenharia, Universidade de São Paulo, São Paulo, 1989.
SILVA, B. A.; FERREIRA PINTO, A. P.; GOMES, A. Natural Hydraulic Lime Versus Cement for Blended Lime Mortars For Restoration Works. Construction and Building Materials, v. 94, p. 346–360, 2015.
SOARES, A. et al. Water-Resistance of Mortars With Lightweight Aggregates. Key Engineering
Materials, v. 634, p. 46-53, dec. 2014.
SUN, H. et al. Investigating Drying Behavior of Cement Mortar Through Electrochemical Impedance Spectroscopy Analysis. Construction
and Building Materials, v. 135, p. 361–368,
2017.
VEIGA, M. DO R. Comportamento de
Argamassas de Revestimentos de Paredes:
contribuição para o estudo da sua resistência à fendilhação. Porto, 1998. Tese (Doutorado em Engenharia Civil) – Escola de Engenharia, Universidade do Porto, Porto, 1998. ZANONI, V. A. G. Influência dos Agentes
Climáticos de Degradação no Comportamento Higrotérmico de Fachadas em Brasília. PhD
Thesis, Universidade de Brasília, Brasília, 2015.
Acknowledgments
The authors would like to thank the Higher Education Personnel Improvement Coordination (CAPES) for granting a scholarship.
Maria Cláudia de Freitas Salomão
Faculdade de Engenharia Civil | Universidade Federal de Uberlândia | Av. João Naves de Ávila, 2121 Bloco Y | Uberlândia – MG – Brasil | CEP 38400-902 | Tel.: (34) 3239-4096 | E-mail: maria.salomao@ufu.br
Elton Bauer
Departamento de Engenharia Civil e Ambiental, Faculdade de Tecnologia | Universidade de Brasília | Campus Universitário Darcy Ribeiro | Brasília - DF – Brasil | CEP 70910-900 | Tel.: (61) 3107-1004 | E-mail: elbauerlem@gmail.com
Claudio de Souza Kazmierczak
Programa de Pós-Graduação em Engenharia Civil | Universidade do Vale do Rio dos Sinos | Av. Unisinos, 950 | CEP 93022-000 | São Leopoldo - RS - Brasil | Telefone: (51) 3590-8245 | E-mail: claudiok@unisinos.br
Revista Ambiente Construído
Associação Nacional de Tecnologia do Ambiente Construído Av. Osvaldo Aranha, 99 - 3º andar, Centro
Porto Alegre – RS - Brasil CEP 90035-190 Telefone: +55 (51) 3308-4084
Fax: +55 (51) 3308-4054 www.seer.ufrgs.br/ambienteconstruido
E-mail: ambienteconstruido@ufrgs.br