The influence of brick residues in the behaviour of lime
mortars
Gina Maria Lourenço Matias, Maria Isabel Torres Department of Civil Engineering
University of Coimbra [email protected]
Paulina Faria
Department of Civil Engineering Nova University of Lisbon
Key words: Lime mortar; masonry repair, pozzolan, brick residues, mortar behaviour
Abstract
Mortars have a great repercussion on the durability of a masonry construction due to its protective role. The compatibility among the masonry materials (the masonry units, the mortar of the joints, the plasters and the renders) incites the adequate behaviour of the wall and consequentially an increase in durability.
Very often we came across with rehabilitation errors due to the use of incompatible mortars whether with the pre-existing mortar or with the others wall materials, which can origin great pathologies. Repair mortars should be compatible with existent materials. Old mortars were normally air lime based and sometimes had in their composition some other products like brick dust which confer specific properties. Small grains of brick residue can take the role of a particular aggregate and brick dust of a pozzolan, reacting with the calcium hydroxide of the air lime and improving the mortars behaviour. Simultaneously its application has the great advantage of reuse an industrial by-product. With the increasing environmental concerns it is important to find appropriate solutions to the industry residues. In this way we can contribute for a better use of the material resources and to the decrease of deposition of residues in landfills by studying its performance as part of a repair mortar.
1 Introduction
Mortars have a significant importance on buildings’ functional behaviour. They protect the masonry units from destructive actions and consequent degradation. Mortars must regularize surfaces and confer some waterproofing and comfortable visual look.
Compatible mortars and support allow longevity of all materials. Therefore, it is convenient to pay attention to induced tensions on masonry elements and to all reactions that may occur with mortars application. A bad repair mortars’ solution may accelerate degradation process of all elements.
Resources location conditions some materials application. In the past, air lime and products that confer hydraulic properties to mortars were frequently combined. These are known as pozzolans, and might be products as ashes, clay and glass.
Later, development of Portland cement caused a decrease in use of air lime based mortars which is mainly caused by its economic advantages, such as easier and quicker application.
Ancient mortars’ knowledge has large importance, because lime based repair mortars effectiveness is conditioned by some physical and mechanical properties.
It’s known that about 30% of the ceramic industry’s resultant product is considered not usable, being carried into landfills in the majority of the cases. Its great strength and resistance to degradation make the problem of waste conditioning unmanageable [1]. Consequently, it is of the global interest the exploitation of ceramic industry residues, mostly because in the past was proved that those materials could, when combined with lime mortars, show good results. It brings economic and environmental benefits.
This experimental work’s intention is to analyze lime based mortars behaviour, with brick residues in its composition. The studied mixtures have brick dust as pozzolan that develops a reaction with calcium hydroxide present in air lime. They also have grounded brick particles in partial substitution of aggregate, with the same particle size distribution as sand present in mixtures. These mortars behaviour is analyzed, having old mortars most common compositions as reference, as well as some biography related to this subject. Compressive and flexural strength, dynamic elastic modulus, water vapour transmission properties and water absorption due to capillarity action are determined.
This study intends to expand the knowledge about rehabilitation mortars, using some uncommon techniques and materials, which might be useful in the future, and incite the reutilization of ceramic industry waste, once it is a present priority and concern to recycle materials.
2 Ceramic industry’s waste utilization
The reutilization of industrial waste materials must originate global concern. Reduction of materials, water and energy, and pollution emissions’ limitation is urgent. In this way, the use of waste materials from ceramic industries has two advantages:
- Reduction in binder production and sand and rock extraction.
The European Social Economics Committee indicates the strategy to prevent residues production. Some aspects are mentioned in communication 2004/C 80/14, from 11/12/2003:
- Promote regulation measures and economic rewards to reduction of residues production;
- Encourage recycled material use and production;
- Give citizens information and conditions to use recycled materials.
A strategy of multidisciplinary knowledge to product recycling is required. It should allow the processes’ vantages and advantages evaluation. The study implied must include available residues identification and qualification, residues characterization and production associated costs (legal expenses and residues deposition). Recycling process must be also evaluated, from beginning of production, to selling [2].
In Portugal, red ceramic products’ production is estimated in 4 million tonnes of material, produced by more than a hundred industries [3]. About 30% of ceramic industry production is considered waste and is deposited in landfills. Material’s strength difficult degradation processes. [1]. With residues quantity growing, solutions are urgent. As that, studies in this subject are essential.
3 Experimental program
3.1 Materials
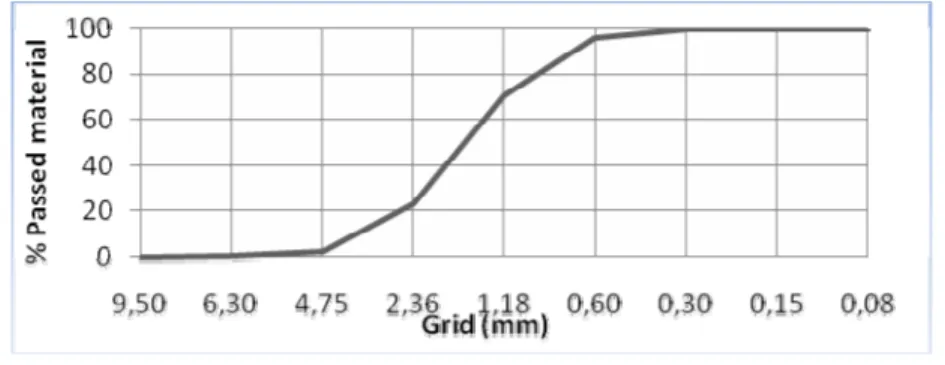
River sand was used in all mixtures and the particle size distribution was determined according to NP EN 933-1 (2000) [4]. A finesses modulus of 3,05 was obtained and its particle’s size distribution curve is represented in figure 1.
Figure 1- Particle size distribution curve
The brick with aggregate role was grounded using a hammer mill and separated with an apparatus from sand’s particle size distribution determination. It was used in mixtures with the same particle size distribution as sand. The residue obtained was used as pozzolan (particles with sizes under 0,075 mm).
All materials were submitted to determination of loose bulk density. Sand’s voids, particle density and water absorption were also determined. These properties are exposed in Table 1.
Table 1 – Material properties
Loose Bulk
Density Density Voids WA24 Mf
Maximum dimension
(g/cm3) (g/cm3) (%) (%) (mm)
sand 1,56 1,41 40 16,39 3,05 2,36
quicklime 0,76 - - - - -
cement 1,18 - - - - -
grounded brick 1,04 - - - - -
Brick dust 0,87 - - - - -
3.2 Specimen preparation
The specimens were prepared slaking quicklime, with water addition (by a method known as “hot lime”). After lowing temperature, sand and brick residues were added. This procedure was applied to all specimens with lime mortars. For the cement control mortars, water was added to the cement/sand mixture. They were all submitted to the controlled chamber conditions during cure process which were 22 ± 2 °C and relative humidity (HR) 50 ± 5 %.
Metallic moulds with 160 mm x 40 mm x 40 mm and circular plastic moulds with 106 mm of diameter and thickness of 15 mm were used. Consistence of fresh mortar, by flow table process [5] and retained water (Fe 32 UNL/DEC [6]) was determined. However, these results weren’t reliable, because they were obtained during the end of the slaking process (has “hot lime” was used). As it is known, when quick lime reacts with water, it expands, and occurs high water consumption. This affects fresh mortar’s behaviour.
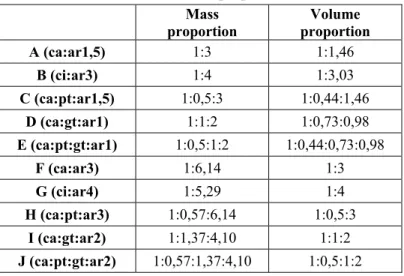
In Table 2, it is referred the volume proportions used in the mixtures composition, and in table 3 the number of specimens applied in each test.
Table 2 – Mass and volume proportion of mixtures
Mass proportion
Volume proportion
A (ca:ar1,5) 1:3 1:1,46
B (ci:ar3) 1:4 1:3,03
C (ca:pt:ar1,5) 1:0,5:3 1:0,44:1,46
D (ca:gt:ar1) 1:1:2 1:0,73:0,98
E (ca:pt:gt:ar1) 1:0,5:1:2 1:0,44:0,73:0,98
F (ca:ar3) 1:6,14 1:3
G (ci:ar4) 1:5,29 1:4
H (ca:pt:ar3) 1:0,57:6,14 1:0,5:3
I (ca:gt:ar2) 1:1,37:4,10 1:1:2
Table 3 – Tests of hardened mortars and number of specimens
3.3 Experimental description and results Water vapour permeability
The water vapour permeability was determined according to EN ISO 12572:2001 [7], related to the water vapour permeability of hardened mortars. However, some of the aspects mentioned in EN 1015-19:2000 [8], as well as information of the assay procedure Fe 05 UNL/DEC [6] were taken as reference.
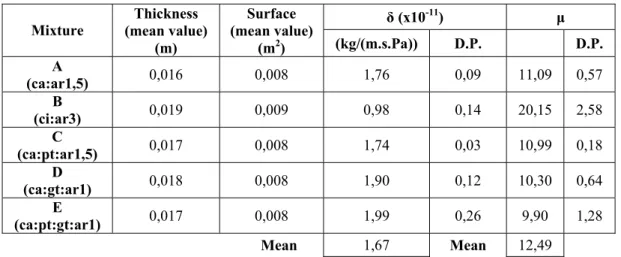
The wet cup assay was taken as the more adjusted, for conditions of RH between 50% and 100%. The role is to generate a constant water vapour flow, through the specimen. In this case, the vapour flow establishes itself from the cup’s interior to its exterior. The results for 30 and 60 days are presented in Table 4 and 5.
Table 4 – Water Vapour permeability and water vapour resistance factor in 30 days
δ (x10-11) μ
Mixture
Thickness (mean value)
(m)
Surface (mean value)
(m2) (kg/(m.s.Pa)) D.P. D.P.
A
(ca:ar1,5) 0,016 0,008 1,76 0,09 11,09 0,57
B
(ci:ar3) 0,019 0,009 0,98 0,14 20,15 2,58
C
(ca:pt:ar1,5) 0,017 0,008 1,74 0,03 10,99 0,18
D
(ca:gt:ar1) 0,018 0,008 1,90 0,12 10,30 0,64
E
(ca:pt:gt:ar1) 0,017 0,008 1,99 0,26 9,90 1,28
Mean 1,67 Mean 12,49 δ - water vapour permeability; μ – water vapour resistance factor; D.P. – Standard deviation.
Specimens D and E present the highest values of water vapour permeability. The worse behaviour is relative to the cement mortar, B, whose water vapour resistance is approximately the double of the other specimens.
Mixture A B C D E F G H I J
Water vapour permeability (28 days) 3 3 3 2 2 - - - - -
Water vapour permeability (60 days) 5 5 5 5 5 5 5 5 5 5
Flexural strength (60 days) 3 3 3 5 3 3 3 3 3 2
Compressive strength (60 days) 3 3 3 5 3 3 3 3 3 3
Dynamic elastic modulus (60 days) 3 3 3 5 3 3 3 3 3 2
Tests
Table 5 – Water vapour permeability and water vapour resistance factor in 60 days
δ (x10-11) μ
Mixture
Thickness (mean value)
(m)
Surface (mean value)
(m2) (kg/(m.s.Pa)) D.P. D.P.
A
(ca:ar1,5) 0,016 0,008 1,62 0,00 12,06 0,58
B
(ci:ar3) 0,018 0,009 1,08 0,01 18,08 0,11
C
(ca:pt:ar1,5) 0,017 0,008 1,60 0,03 12,23 0,27
D
(ca:gt:ar1) 0,017 0,008 1,74 0,15 11,29 0,96
E
(ca:pt:gt:ar1) 0,017 0,008 1,85 0,19 10,62 0,98
F
(ca:ar3) 0,016 0,008 1,54 0,04 12,70 0,30
G
(ci:ar4) 0,017 0,009 1,21 0,03 16,12 0,47
H
(ca:pt:ar3) 0,016 0,009 1,64 0,05 11,90 0,36
I
(ca:gt:ar2) 0,016 0,009 1,59 0,05 12,24 0,36
J
(ca:pt:gt:ar2) 0,016 0,009 1,41 0,03 13,82 0,22
Mean 1,53 Mean 13,11 δ - Water vapour permeability; μ – water vapour resistance factor; D.P. – Standard Deviation
The mixtures D and E have the highest value of water vapour permeability. With the
exception of cement mixture, all the specimens tested at 30 and 60 days tend to reduce
the water vapour permeability through time.
As expected, the highest values of water vapour resistance factor refer to cement mortars.
Among mixtures with brick residues, the ones with grounded brick seemed to have better
behaviour.
Water absorption due to capillarity action
Table 6 – Water absorption due to capillarity action and capillarity coefficient
C CA Mixture
[kg/(m2.min0.5)] D.P. [kg/m2] D.P.
A (ca:ar1,5) 6,05 0,38 22,69 0,65
B (ci:ar3) 1,29 0,08 17,79 1,07
C (ca:pt:ar1,5) 6,12 0,12 29,26 2,31
D (ca:gt:ar1) 6,41 0,29 26,73 0,74
E (ca:pt:gt:ar1) 6,75 0,08 30,17 1,46
F (ca:ar3) 5,38 0,13 18,10 1,12
G (ci:ar4) 1,02 0,05 14,48 0,89
H (ca:pt:ar3) 2,45 0,18 24,00 1,96
I (ca:gt:ar2) 2,91 0,15 19,72 0,89
J (ca:pt:gt:ar2) 3,45 0,35 20,13 1,52
C – Water absorption coefficient; CA– Capillarity water absorption.
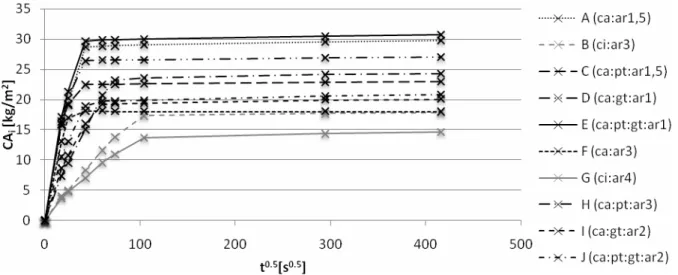
According to the results, the mixtures E and D have a higher water absorption coefficient. G and B mixtures have the lowest results, which were expectable for cement mixtures. The mixture that absorbed more water due to capillarity action was C, containing brick dust. Cement mixtures have a lower rate of water absorbed.
Figure 2 – Water absorption due to capillarity action
Compressive and flexural strength and dynamic elastic modulus
The dynamic elastic modulus was first determined, followed by flexural strength test. One of the half parts remaining from flexural strength was used to determine compressive strength. The dynamic elastic modulus was calculated by equipment with ultra-sounds propagation trough materials principle, based on Montoya [10]. The apparatus determines the period of time each impulse takes to cover the material, from one top to another. The results appear in Table 7.
Table 7 – Results from compressive and flexural strength tests and dynamic elastic modulus
Dynamic elastic modulus
Flexural Strength
Compressive strength Mixture
(Mpa) D.P. (Mpa) D.P. (Mpa) D.P.
A
(ca:ar1,5) 6150 62 0,55 0,05 0,55 0,05
B
(ci:ar3) 11944 215 2,64 0,35 6,48 0,54
C
(ca:pt:ar1,5) 6186 53 0,33 0,05 0,30 0,00
D
(ca:gt:ar1) 5738 120 0,34 0,02 0,45 0,02
E
(ca:pt:gt:ar1) 6090 59 0,34 0,04 0,32 0,03
F
(ca:ar3) 7317 95 0,34 0,04 0,44 0,10
G
(ci:ar4) 12212 658 2,13 0,13 5,47 0,77
H
(ca:pt:ar3) 7021 13 0,43 0,06 0,66 0,03
I
(ca:gt:ar2) 6370 126 0,36 0,03 0,48 0,01
J
(ca:pt:gt:ar2) 7144 24 0,48 0,04 0,23 0,01
All mixtures, except the ones with cement, present reduced values of flexural and compressive strength. Compositions C, D and E were the ones that possess the lower values of flexural strength and C, E and J the ones that have minor value of compressive strength. The mortar with lower elastic modulus is D. Although all air lime mortars register about half the values of the cement mortars.
3.4. Discussion
It was considered that flexural strength acceptable values for reparation mortars varies between 0,2 and 0,7 MPa. Consequently, all air lime mortars studied present acceptable values. To compressive strength, the interval generally indicated corresponds to values between 0,4 and 2,5 MPa. Lime mortars C, E and J have inferior values then those considered acceptable. It is considered, however, that in the generality, all lime mortars present extremely low values of compressive strength. The extremely low value of the compressive strength of mortar J is distinguished. It is possible that this result was influenced by some unknown irregularity during the specimens’ production. The dynamic elastic modulus obtained to all lime mortars is considered too high. However, this factor might be conditioned for some irregularity of the specimen bases and by the method itself.
From a composition analysis, it is verified that lime mortars in 1:3 volumetric proportion presented a better behaviour (exception for control mixture A).
As expected, cement control specimens registered higher dynamic elastic modulus, as well as flexural and compressive strength.
A complementary evaluation of the mechanical characteristics would be suitable.
In terms of water vapour permeability, it is verified that it tends to diminish in time, except for cement mortar, B. Mostly all mixtures present good behaviour to the permeability. In this subject, mortars D and E demonstrate better global behaviour, and both with grain of brick in its composition. It is consider, however, that this assay is not determinative at 30 days because the carbonation process is slow. From mortars with brick residues, the one that possess better behaviour had in its constitution brick grain and brick dust, with less amount of aggregate (mixture E).
Lime mortars absorb a high amount of water due to capillarity behaviour. They register a very high initial absorption speed. However, mixtures H and I are distinguish, because they demonstrate to have a good behaviour and they possess in its composition dust of brick and grain, respectively, with weaker traces. In this analysis, cement mixtures present better results related with the coefficient of capillarity and water absorbed. In these specimens group it is verified that water absorption speed increases with the increase of cement proportion.
In what concerns the total water absorbed, lime mortars F, I and J register a better performance, which might be related to brick grain or brick dust in larger proportions (I and J) and with a larger aggregate proportion (F). Mortars with greater cement or lime proportions present worse behaviour.
In global behaviour terms, it is verify that mixtures H and I register better performance in the studied characteristics. Therefore, it will be correct to affirm that, in adequate amounts and traces of approximately 1:3 of lime and aggregate, with brick dust or brick grain in aggregate substitution, mortars could be viable as substitution mortars.
4.Conclusions
This experimental work allowed the acquisition of some knowledge about brick residues behaviour as component in lime mortars. Through the tests done, it is possible to realize that the use of brick residues will not only be able to bring advantages in an economic and environmental level, but also revealed an industrial by-product with good characteristics as lime mortars component, that can be applied in old buildings.
However, an adjusted reparation mortar does not depend only on the most common characteristics. The support conditions are also very important. So it is necessary, for each building reparation case, to evaluate all situations.
In terms of results, mortars with a correct proportion of lime and aggregate, that possesses in its composition brick dust or brick grain, seems to present a quite appropriate behaviour.
6.References
[1] Binici, H. (2006). “Effect of crushed ceramic and basaltic pumice as fine aggregates on concrete mortars properties”. Construction and Building Materials 21 (2007), pág. 1191–1197, Elsevier Ltd.
[2] Silva, J. (2006). “Incorporação de resíduos de barro vermelho em argamassas cimentícias”. Tese de Mestrado, Universidade técnica de Lisboa, Instituto Superior Técnico, Lisboa.
[3] Castro, F., Vilarinho, C., Soares, D., (2004). “Gestão de resíduos industriais por incorporação em materiais para construção civil”. Congresso Iberoamericano De Metalurgia y Materiales, 8, Quito, 2004 -“IBEROMET: VIII Congresso Iberoamericano de Metalurgia y Materiales: actas”. [4] IPQ (2000). “Tests for geometrical properties of aggregates – Part 1: Determination of particle size distribution – Sieving method”. NP EN 933-1, Instituto Português da Qualidade, Lisboa.
[5] CEN (1999). “Methods of test for mortar for masonry – Part 3: Determination of consistence of fresh mortar (by flow table)”. EN 1015-3, European Committee for Standardization, Brussels. [6] Faria Rodrigues, M. P. (2004). “Mortars for old masonry renderings – The influence of binders” (in portuguese). PhD, Nova University of Lisbon.
[7] CEN (2001). “Hygrothermal performance of building materials and products – Determination of water vapour transmission properties”. EN ISO 12572, European Committee for Standardization, Brussels.
[8] CEN (2002). “Methods of test for mortar for masonry – Part 19: Determination of water vapour permeability of hardened rendering and plastering mortars”. EN 1015-19, European Committee for Standardization, Brussels.
[9] CEN (2002). “Methods of test for mortar for masonry – Part 18: Determination of water absorption coefficient due to capillary action of hardened mortar”. EN 1015-18, European Committee for Standardization, Brussels.
[10] Montoya, P, Meseguer, A., Cabre F. (1976). “Hormigón armado – Tomo I”. 8ª Edition, Gustavo Gili, Barcelona.