Ensaio
Business Survival in Portuguese Regions
1Alcina Nunes2l
Elsa de Morais Sarmento3
Abstract: This work addresses the post-entry performance of employer enterprises for seven regions in Portugal, at the NUT II level, by investigating the structural characteristics of survival, using non-parametric and semi-parametric methods, during the period 1985 to 2007. The last decades of the 20th century were characterized by a period of creative destruction in Portugal. In particular, regions such as Norte, Algarve and Madeira show the highest growth rates in enterprise births, deaths and firm churn. After 2000, firms´ births and deaths are relatively less turbulent. In the non-parametric analysis, we identify statistically significant disparities among regions. Norte has the lowest survival rate and Centro holds the longest surviving firms. The survival gap between these two regions widens over time. Concerning the semi-parametric analysis, firm’s current size dimension is a strong determinant for the probability of survival, particularly in the Norte and Açores. In industries characterized by high entry rates at the moment of a firm’s birth, post-entry survival becomes harder, especially in the south and in the Portuguese archipelagos, the regions with the lowest number of active employer enterprises. A higher entry rate combined with fast growth rates for any given industry also generates a shorter duration of firms. Manufacturing is the sector where more firms are more likely to abandon the market, particularly in Madeira and Norte. But it is turbulence, given by the sum of firms´ entry and exit rates that exhibits the most significant effect on survival. For every region, except for the Açores, where there is no statistical significance, those that have the highest record of firm turbulence, also display the lowest business survival probabilities. Turbulence decreases severely the survival probabilities of firms located in Madeira and Norte and to a lesser extent in the Algarve.
1. Introduction
Regional development has been a source of interest among academics and policymakers, especially in the context of endogenous growth theories and the new economic geography framework. Regional growth theory has become over the years an important branch of modern economic growth analysis. The knowledge society has brought about features such as innovation and creativity as the basis of regional dynamics and competitiveness. Business performance and the renewal of enterprises, which have been considered as engines of regional innovation, employment creation and growth, have thus aroused great interest.
The phenomena of enterprise birth, growth, contraction and death has become an important field of research in the so-called firm demographics (Bartelsman et al., 2005a and 2005b; Caves, 1998; Colantone and Sleuwaegen, 2008; Geroski, 1995; Masso et al., 2004; Robinson et al., 2006; Sharpe and Currie, 2008). The demography of firms approach is already a rather well established field of study for economic geographers and regional economists (Van Dijk and Pellenbarg, 1999; Pellenbarg and van Steen, 2003; Baptista et al., 2008; Baptista and Carias, 2007). It has developed into a research field that has close links to industrial organisation and organisational ecology but also to the evolutionary approach of spatial-economic development (Nelson and Winter 1982; Hannan and Freeman 1989; Boschma and Frenken, 2002 and 2006).
This study addresses the post-entry performance of new Portuguese firms by investigating the regional structural characteristics of the hazard and survival functions, by applying non-parametric and semi-parametric survival analysis to the active employer enterprises of Quadros de Pessoal (Employment Administrative Records). It has been subject to the application of the entrepreneurship definitions and
1
Agradecermos ao Gabinete de Estratégia e Planeamento, do Ministério do Trabalho e da Segurança Social, o fornecimento dos dados e o apoio prestado. Este trabalho reflecte unicamente as opiniões das autoras.
2
Escola Superior de Tecnologia e Gestão do Instituto Politécnico de Bragança, Portugal (alcina@ipb.pt).
3
Departamento de Economia e Gestão, Universidade de Aveiro, Portugal; Gabinete de Estratégia e Estudos do
methodology of the “Manual on Business Demography Statistics” (Eurostat/OCDE, 2007), from where a
specific entrepreneurship database was derived. This database consists of an annual average of 215.903 active employer enterprises over the period 1985 to 2007, with an annual average of 36.803 births and 23.743 deaths.
The paper is structured as follows. The next section provides an overview of business dynamics at the regional level. Section three presents the non-parametric survival analysis while section four proceeds with complementary semi-parametric survival methods. Finally, the last section concludes.
2. Regional Business Characteristics and Dynamics
As the creation of enterprises is considered a primary indicator of the level of entrepreneurship at the regional level, its closing can also be considered a primary indicator of local firms´ survival abilities. In Portugal, the regional distribution of deaths is relatively uneven across the seven NUT II regions (Figures 1 and 2). Norte is the region where more enterprise deaths occur (39% of total enterprises died in 2005 and
34% in 1985), a higher proportion than the region’s share of total active enterprises.
Figure 1. Deaths of active employer enterprises by NUT II regions
Source: Own calculations based on Quadros de Pessoal, GEP, MTSS.
The last 25 years of the 20th century may be seen as a period of creative destruction, where the development of information and communication technologies and globalisation shaped the behaviour of firms. Carree et al. (2002) argue that at least in modern economies, the secular trend of decreasing business ownership rate and its rise during this period is an indication of development changes in the level of entrepreneurship. After the 1970s, industries such as textiles, machinery and automobiles have lost comparative advantage and have been confronted by a rise of new ventures in service and knowledge-intensive sectors.
But globalisation is bringing an increasing level of risk, tougher competitive pressure and increasing barriers to entry the market for potential entrepreneurs (Colantone and Sleuwaegen, 2008). These phenomena might have had a considerable impact in Portugal, particularly from the start of the new century, causing a smoothing of the rhythm of enterprise creation and bringing tougher survival for incumbent firms. Death rates are highly correlated with birth rates and have thus accompanied this trend (Sarmento and Nunes, 2010b).
Table 1 sheds additional light onto the rhythm of growth of enterprises, its births and deaths, which has been clearly slowing down since the 2000 “peak”. Most NUT II regions follow the country’s general trend of decreasing birth and death rates (Sarmento and Nunes, 2010b). The Algarve is the only region that
4301 4393 3921 4929 6287 6000 5798 6441 8311 7572 7856 7286 7883 7966 10295 15534 14074 12298 11471 11501 14807 3605 3914 3704 4057 5237 4630 4912 4998 7422 6236 5805 5977 6317 6698 7548 8825 9672 9978 8761 8490 9165 2326 2870 2156 2455 3539 2901 3191 3362 4910 3920 4118 4077 4376 4671 5455 7363 7728 7272 6819 6545 7851 1023 1207 1009 1320 1616 1713 1593 1581 2295 1707 1510 1523 1863 1880 2088 2580 2882 2709 2681 2355 2869 512 536 496 587 990 835 907 1005 1254 1133 1072 1117 1244 1320 1486 1813 1904 1888 1812 1974 2148
0% 20% 40% 60% 80% 100%
1985 1986 1987 1988 1989 1990 1991 1992 1993 1994 1995 1996 1997 1998 1999 2000 2001 2002 2003 2004 2005
manages to dispute this tendency and maintain a positive annual growth rate of enterprise births after 2000 (1.0%), as it also has the highest growth in active enterprises throughout the whole period. On the other hand, it also shows the highest annual average growth in enterprise closures (3.4%).
Norte has the greatest proportion of active firms in the country and the second greatest increase in active employer enterprises in the country between 2000 and 2007 (Table 1). It is also in the north of the country where the greatest share of business entries and closures occurred between 1985 and 2007, causing this region to exhibit a high level and turbulence (Table 2 and Figure 2) and volatility. Despite having the greatest share of active enterprises and the greatest amount of small enterprises in the country, the weight of small and medium firms is the highest in Algarve (mainly due to services and construction firms from 2000) and Alentejo (mainly in services, agriculture and fishing sectors) (Sarmento and Nunes, 2010b).
Table 1. Annual average growth rate of employer enterprises, births and deaths by NUT II
Source: Own calculations based on Quadros de Pessoal GEP, MTSS.
From 1985 to 2005, Algarve (32.5%), Alentejo and Norte (29.9%) are the regions with the greatest amount of births and deaths in the country. In the second sub-period, from 2001, Norte and Algarve (29.4%) maintain high levels of business turbulence, though below the previous period turbulence rates (1987-2000).
Table 2. Average churn rates of Portuguese NUT II regions
Source: Own calculations based on Quadros de Pessoal, GEP, MTSS.
In Figure 2, birth, death and churn rates for each NUT II region are portrayed for three selected years, the first for which we are able to calculate both death and birth rates (1987), one of the most significative
“peak” year in terms of turbulence (2000) and the most recent year for which we are also able to compute births and deaths (2005). In the years following 2000, Portuguese regions have been moving towards the first quadrant, to the bottom left side, closer to the dividing 45º degree line.
The first three quarters of the 20th century are often characterized as a period of declining small firm presence in most industries (Carree et al., 2002). But in more recent decades, this has stabilized or has even been reversed, with the revival of small businesses in many industries of the industrialized world (Eurostat, 2009; OECD/Eurostat, 2009; Bartelsman et al., 2005a; Cabral, 2007; Núñez, 2004; Thurik, 1999; Storey, 1994; Acs, 1996; Acs and Audretsch, 1993; Loveman and Sengenberger 1991). After the 1970s, older and larger enterprises especially located in manufacturing sectors have lost ground to new smaller, more entrepreneurial and innovative counterparts. The increasing weight of services in most developed economies, which are characterized by smaller average sizes, contributed sharply to the decreasing average size of firms. In Portugal, the growing importance of services cannot be overlooked (Sarmento and Nunes, 2010b), influencing the already small sized entrepreneurial fabric and the creation
NUTII Regions 1985-2007 1995-2000 2000-2007 1987-2007 2000-2007 1985-2005 2000-2005
Norte 6.2 7.1 4.4 4.3 -1.5 6.4 -1.0
Algarve 9.2 7.9 6.7 6.2 1.0 7.4 3.4
Centro 6.6 8.6 4.0 4.6 -5,3 6.3 1.3
Lisboa e Vale do Tejo 4.5 5.1 3.4 4.3 -1.1 4.8 0.8
Alentejo 5.8 8.3 3.1 3.1 -4.2 5.3 2.1
Açores 3.7 3.9 3.1 1.1 -1.0 0.4 -4.9
Madeira 6.4 7.1 4.4 4.9 -1.1 6.3 -3,3
Portugal 5.8 6.9 4.1 4.3 -2.3 5.7 0.2
Deaths Births
Active employer enterprises
1987-2005 1987-2000 2001-2005
Norte 29,9% 30,1% 29,4%
Algarve 32,5% 34,7% 29,4%
Centro 27,3% 28,8% 25,1%
Lisboa 26,8% 27,1% 26,2%
Alentejo 29,9% 31,8% 26,6%
Açores 27,1% 28,0% 25,5%
Madeira 28,6% 29,4% 27,3%
of new enterprises. Over a period of more than 20 years, Sarmento and Nunes (2010a) find an overall decreasing average size for employer enterprises in Portugal, which is extended to all broad sectors, NUT II regions, entrants and exiters in the market.
By combining the geographical with the size class dimension, Sarmento and Nunes (2010b) observe the predominance of small firms births in most regions, in particular in Algarve (above 98,1% of enterprises are born with fewer than 20 employees throughout the period), Alentejo (97.7%), Centro (97.2%) and the Açores. Over the period, Norte is the region where relatively fewer firms are born with less than 20 employees.
Figure 2. Birth, death and churn rates in 1987, 2000 and 2005 respectively
Source: Own calculations based on Quadros de Pessoal, GEP, MTSS.
Norte
Algarve
Centro
Lisboa e Vale do Tejo
Alentejo
Açores
Madeira
0,09 0,14 0,19 0,24 0,29 0,34
0,09 0,10 0,11 0,12 0,13 0,14 0,15 0,16 0,17 Death rate, %
B
ir
th
r
a
te
,
%
Algarve
Norte Centro
Lisboa e Vale do Tejo
Alentejo
Açores
Madeira
0,09 0,14 0,19 0,24 0,29 0,34
0,09 0,10 0,11 0,12 0,13 0,14 0,15 0,16 0,17 Death rate, %
Bir
th
r
at
e,
%
Norte
Algarve Centro
Lisboa e Vale do Tejo
Alentejo Açores Madeira
0,09 0,14 0,19 0,24 0,29 0,34
0,09 0,10 0,11 0,12 0,13 0,14 0,15 0,16 0,17 Death rate, %
B
ir
th
r
a
te
,
Moreover, the average firm size of entrants, which is considered to influence growth and survival has been
decreasing throughout the country’s regions, except for size class of 20-49 employees. Lisbon has the biggest sized enterprises in the country in the size class of over 250 employees, although average firm size has been decreasing considerably in recent years (1.645 employees on average in 1989, 2.628 in 2000 and 624 in 2007), followed by Centro and Norte.
In higher birth rate years in Portugal, we observe an overall increase in firm dimension, with some
heterogeneity throughout the Portuguese regions, in particular during the “peak” years of enterprise
creation of 2000 to 2002. The year of 1994, also characterised by a sharp increase in birth rates, shows a more homogenous regional impact on average enterprises´ size (except for Centro and the Açores),
compared to the “peak” of 2000 to 2002, which had a more localised impact in respect to firm size increase
in Lisbon, Açores and Madeira.
3. Non-Parametric Survival Analysis
We shall make use of survival functions1, which show the probability of survival, considering that the firm
has been active during a certain period and hazard functions, which portray the probability of “death”
throughout a given period of time.
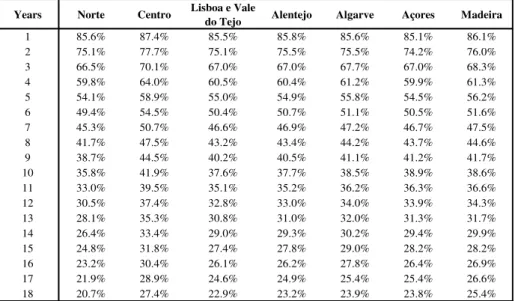
In Portugal, during the period from 1987 to 2005, approximately 86% of all the employer enterprise births remain active after one year of activity, 75% after two years and 46% after seven years. After 18 years of activity, only 22% of employer enterprise start-ups were still alive or equivalently, almost 78% had already exited the market.
Table 3 presents the results for the non-parametric estimation, for each of the seven Portuguese NUTII regions. This framework explores the relationship between age and the regional hazard of exit.
Table 3. Survival table for employer enterprise births by NUTII region, 1987-2005
Source: Own calculations based on Quadros de Pessoal, GEP, MTSS.
Over 85% of newly born employer enterprises remain active during their first year of activity in all regions. The one-year survival rate varies from a low of 85% in the Açores to a high of 87.5% in the Centro region, meaning that the new born enterprises died relatively more prematurely in Açores archipelago than in other Portuguese regions.
1
The methodology used in this section is described in greater detail in Nunes and Sarmento (2010b).
Years Norte Centro Lisboa e Vale
do Tejo Alentejo Algarve Açores Madeira
1 85.6% 87.4% 85.5% 85.8% 85.6% 85.1% 86.1%
2 75.1% 77.7% 75.1% 75.5% 75.5% 74.2% 76.0%
3 66.5% 70.1% 67.0% 67.0% 67.7% 67.0% 68.3%
4 59.8% 64.0% 60.5% 60.4% 61.2% 59.9% 61.3%
5 54.1% 58.9% 55.0% 54.9% 55.8% 54.5% 56.2%
6 49.4% 54.5% 50.4% 50.7% 51.1% 50.5% 51.6%
7 45.3% 50.7% 46.6% 46.9% 47.2% 46.7% 47.5%
8 41.7% 47.5% 43.2% 43.4% 44.2% 43.7% 44.6%
9 38.7% 44.5% 40.2% 40.5% 41.1% 41.2% 41.7%
10 35.8% 41.9% 37.6% 37.7% 38.5% 38.9% 38.6%
11 33.0% 39.5% 35.1% 35.2% 36.2% 36.3% 36.6%
12 30.5% 37.4% 32.8% 33.0% 34.0% 33.9% 34.3%
13 28.1% 35.3% 30.8% 31.0% 32.0% 31.3% 31.7%
14 26.4% 33.4% 29.0% 29.3% 30.2% 29.4% 29.9%
15 24.8% 31.8% 27.4% 27.8% 29.0% 28.2% 28.2%
16 23.2% 30.4% 26.1% 26.2% 27.8% 26.4% 26.9%
17 21.9% 28.9% 24.6% 24.9% 25.4% 25.4% 26.6%
After three years, Norte presents the lowest survival rate, which is maintained throughout the period, while
Centro has the best survival performance. In fact, Centro has a higher survival rate than the economy’s
average, it is where firms manage to survive longer during the period considered. After 6 years of firm activity, Norte is the only region with less than 50% of survival probability, lagging behind all other regions in terms of enterprise survival. Table 2 also reveals that the survival gap between these two regions grows systematically with time. At the end of the period, Norte is the region that presents the lowest survival rate, with only 20.7% of the firms’ population managing to survive throughout eighteen years of activity. Centro, in turn, has 27.4% of its 1987 start-ups still active after 18 years.
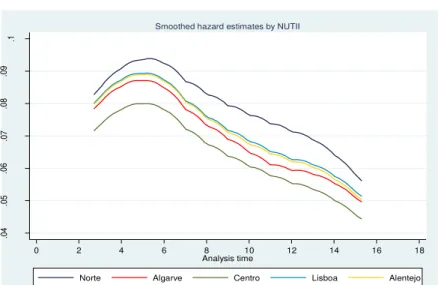
There are also clear disparities between regions, in particular between Norte and Centro, in terms of median duration survival (Figure 3). The median duration of firms at the regional level is below seven years for most regions, except for Centro (around the eight year).
The disparities among the Portuguese regions are confirmed by equality tests. Both Log-rank and Wilcoxon (Breslow) tests allow for the rejection of the hypothesis of survival equality among regions.
Figure 3. Smoothed hazard estimate by NUTII, 1987-2005
Source: Own calculations based on Quadros de Pessoal, GEP, MTSS.
4. A Semi-Parametric Survival Analysis
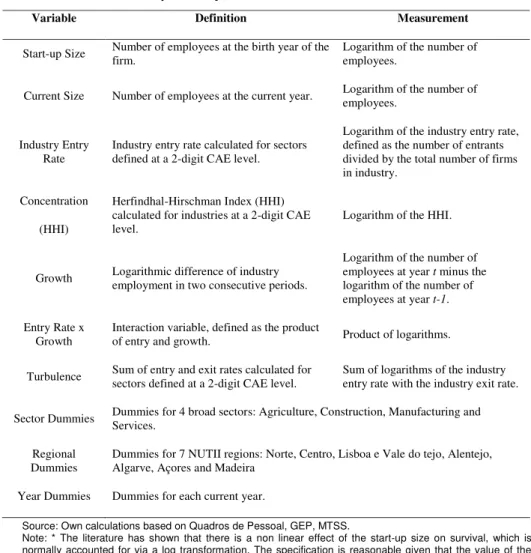
For the semi-parametric approach, there are seven explanatory variables, beyond sector and year dummies (Table 4).
.0
4
.0
5
.0
6
.0
7
.0
8
.0
9
.1
0 2 4 6 8 10 12 14 16 18
Analysis time
Norte Algarve Centro Lisboa Alentejo
Table 4. Explanatory variables considered in the model
Source: Own calculations based on Quadros de Pessoal, GEP, MTSS.
Note: * The literature has shown that there is a non linear effect of the start-up size on survival, which is normally accounted for via a log transformation. The specification is reasonable given that the value of the likelihood increases.
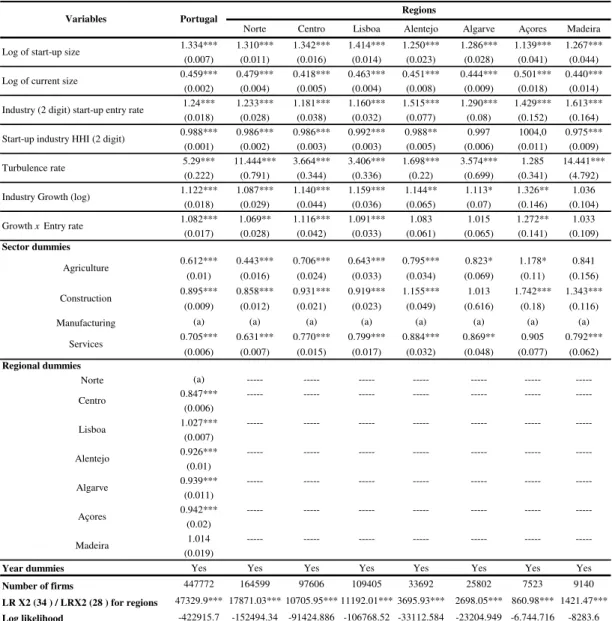
A cloglog regression estimation process1 was conducted for Portugal and for its seven NUT II regions, for the period 1995 to 20052. All the models control for structural effects, through industry dummies and for macroeconomic effects, through year dummies3.
The values presented in Table 5 correspond to the hazard ratios, that is, the ratio of hazard rate when the variable increases by the one unit. A hazard ratio over one implies that an increase in the given explanatory variable increases the probability of exit and, correspondingly, a hazard ratio below one means that an increase in the variable decreases the hazard.
Since the number of firms in each region is quite diverse, ranging from 164.599 firms in the Norte to 7.523 firms in Açores, the conclusions are not straightforward when we take into consideration the absolute values of the coefficients. Therefore, the analysis must rely more on the overall results than on the absolute values of the hazard coefficients.
As argued in the literature and mentioned previously, the start-up size of a firm improves the chances of survival. However, this is not apparent from Table 5. These results show hazard ratios which are greater than one, not only for the total economy but also for each region, as the model does not isolate the effects of initial firm size from the effects of current firm size. When the hazard ratios for the variable that proxies
1
For further methodology details please see Nunes and Sarmento (2010a). 2
The regional disaggregation is only provided after 1995 due to the introduction of the System of European Accounts in 1995 and up to 2006 due to the problems of compatibility with the Portuguese Classification of Economic Activities (CAE Rev. 3) after 2007. We only estimate until 2005 given that the Eurostat/OECD methodology requires checking for reactivations in the two following years before an enterprise is actually considered to be “dead”.
3
The year dummies values have been introduced but the values are not shown, as no clear pattern is discernible from the estimated coefficients, as is usually the case (Mata et al., 1995).
Variable Definition Measurement
Start-up Size Number of employees at the birth year of the firm.
Logarithm of the number of employees.
Current Size Number of employees at the current year. Logarithm of the number of employees.
Industry Entry Rate
Industry entry rate calculated for sectors defined at a 2-digit CAE level.
Logarithm of the industry entry rate, defined as the number of entrants divided by the total number of firms in industry.
Concentration
(HHI)
Herfindhal-Hirschman Index (HHI) calculated for industries at a 2-digit CAE level.
Logarithm of the HHI.
Growth Logarithmic difference of industry employment in two consecutive periods.
Logarithm of the number of employees at year t minus the logarithm of the number of employees at year t-1.
Entry Rate x Growth
Interaction variable, defined as the product
of entry and growth. Product of logarithms.
Turbulence Sum of entry and exit rates calculated for sectors defined at a 2-digit CAE level.
Sum of logarithms of the industry entry rate with the industry exit rate.
Sector Dummies Dummies for 4 broad sectors: Agriculture, Construction, Manufacturing and Services.
Regional Dummies
Dummies for 7 NUTII regions: Norte, Centro, Lisboa e Vale do tejo, Alentejo, Algarve, Açores and Madeira
current size are considered, the effect of a firms’ current size seems to be predominant. This effect cannot be observed in the table, since it does not detail the common cloglog estimators, but only the hazard ratios. However, when introducing the sum of the start-up and the current size (by denoting
S
0 andS
t theinitial and current size, respectively, and
and
the correspondent coefficients, the effect of size is expressed by
S0
St), it becomes evident that the current size improves the chances of survival andthat the initial size does not. This effect is observed for all Portuguese regions and is consistent with the results of Mata, Portugal and Guimarães (1995). According to the previous authors, firms that have started smaller and have experienced faster post-entry growth do face a higher probability of survival.
International studies also indicate that in industries characterized by high entry rates at the moment of birth, post-entry survival becomes harder. Firms that experience more competition from entrants, have a
higher probability of failure. This is also observed for Portugal and for the country’s NUT II regions.
However, this is particularly enhanced in regions where the entrepreneurial background is not as developed as those of other regions1 (Açores) and in those dominated by sectors which do not pose high entry barriers to new firms, such as services (Madeira, Algarve and Lisboa). From 2000 to 2007, Algarve (6.7%) and Madeira (4.4%) displayed the greatest annual average growth rates in active employer enterprises (Table 1). Algarve is also systematically the region with the highest birth rates in Portugal and Madeira is within the three regions with the highest birth rates throughout the period. Moreover, Madeira, Algarve and Lisboa are regions where service firms are relatively more predominant.
A high entry rate combined with fast growth rates for any given industry generates, in general, a shorter duration of firms (Mata, et al., 1995; Gort and Klepper, 1982). This conclusion can also be drawn from these results, even if statistical significant estimators are not obtained for some of regions (Algarve, Alentejo and Madeira). It might seem easier to enter the market in earlier stages of the product life-cycle, when markets are expanding, but it becomes particularly difficult to survive. It is particularly so in the Açores archipelago, in Centro, Lisboa and Norte.
Herfindhal-Hirschman Index estimation results for concentration influence on survival probabilities do not provide very disparate conclusions at the regional level, except for the Açores, where the small entrepreneurial fabric in terms of number and firm average size, might be relatively more susceptible to firm concentration.
These results have stressed the literature’s conclusions so far. However, the effect of industry growth is at odds with the mainstream results in the literature. One would expect that firms operating in industries with faster growth would suffer from a smaller probability of failure, since they can penetrate the market without harming the competitors, but the estimation results show otherwise. In order to help shedding light over this result, it should be pointed out that industries in the early stages of their life-cycles usually register high rates of entry and exit (Agarwal and Gort, 1996; Baptista and Karaoz, 2007). In general, industries with higher than average entry rates also exhibit higher than average exit rates (Cabral, 2007), due to birth and death rates being highly correlated across industries, corroborating the idea that “entry barriers are
exit barriers” (Mata et al., 1995). The combined effect of entry and growth can explain this unexpected
effect of industry growth on survival probabilities. Industries experiencing higher growth rates are also
more turbulent, registering high rates of entry and also of exit (the “revolving door” at work), thus
decreasing the likelihood of survival.
Sarmento and Nunes (2010b) show that the correlation between turbulence (sum of the entry and exit rates) and growth rate is positive (58%) and statistically significant at 5% confidence level, corroborating the previous argument. These results can be extended to the Portuguese regions, underlining that turbulence is indeed a major driver of Portuguese firms´ survival chances.
1
Table 5. Estimation results for the total economy and for each one of the seven Portuguese NUT II regions
Source: Own calculations based on Quadros de Pessoal, GEP, MTSS. Notes: (a) refers to the reference sector; The year dummies
“yes” means that they have been included in the estimation; Standard deviation is shown in brackets and *. **, *** means, respectively, 10, 5 and 1% level of significance.
From Table 5, it is also possible to conclude that the turbulence rate exhibits the most significant effect when considering other determinants in the model, such as firm and market characteristics. For all the regions, with the exception the Açores1, where there is no statistical significance, those that have the highest record of firm turbulence, also display the lowest business survival probabilities. Turbulence decreases severely the survival probabilities of firms located in Madeira and Norte and to a lesser extent in the Algarve. The hazard ratios obtained range from around 14.5 % in Madeira to 1,2% in Açores. The
Açores display a lower entrepreneurial turbulence than the country’s average for most of the years up to
2005 (GEE, 2010b) and the lowest regional churn rates, factors accruing to explaining the lowest regional hazard ratio. From 1987 to 2005, the Algarve shows the greatest churn rate (32.5%) in the country, followed by Norte (29.9%).
Norte has the highest hazard rate within the continental regions (11.5%) and possesses clear regional specificities (INE, 2009; Nunes and Sarmento, 2010c), showing one of the highest regional rates of turbulence (Table 2). Madeira in turn, has 28.6% for firm churn in the 1987-2005 period, but has the
1
As regiões autónomas apresentam resultados sensivelmente distintos das regiões de Portugal continental, pois apresentam características na demografia empresarial distintas das restantes regiões do país (GEEa and b, 2010; Sarmento e Nunes, 2010).
Norte Centro Lisboa Alentejo Algarve Açores Madeira 1.334*** 1.310*** 1.342*** 1.414*** 1.250*** 1.286*** 1.139*** 1.267*** (0.007) (0.011) (0.016) (0.014) (0.023) (0.028) (0.041) (0.044) 0.459*** 0.479*** 0.418*** 0.463*** 0.451*** 0.444*** 0.501*** 0.440***
(0.002) (0.004) (0.005) (0.004) (0.008) (0.009) (0.018) (0.014) 1.24*** 1.233*** 1.181*** 1.160*** 1.515*** 1.290*** 1.429*** 1.613*** (0.018) (0.028) (0.038) (0.032) (0.077) (0.08) (0.152) (0.164) 0.988*** 0.986*** 0.986*** 0.992*** 0.988** 0.997 1004,0 0.975***
(0.001) (0.002) (0.003) (0.003) (0.005) (0.006) (0.011) (0.009) 5.29*** 11.444*** 3.664*** 3.406*** 1.698*** 3.574*** 1.285 14.441*** (0.222) (0.791) (0.344) (0.336) (0.22) (0.699) (0.341) (4.792) 1.122*** 1.087*** 1.140*** 1.159*** 1.144** 1.113* 1.326** 1.036
(0.018) (0.029) (0.044) (0.036) (0.065) (0.07) (0.146) (0.104) 1.082*** 1.069** 1.116*** 1.091*** 1.083 1.015 1.272** 1.033
(0.017) (0.028) (0.042) (0.033) (0.061) (0.065) (0.141) (0.109)
Sector dummies
0.612*** 0.443*** 0.706*** 0.643*** 0.795*** 0.823* 1.178* 0.841 (0.01) (0.016) (0.024) (0.033) (0.034) (0.069) (0.11) (0.156) 0.895*** 0.858*** 0.931*** 0.919*** 1.155*** 1.013 1.742*** 1.343***
(0.009) (0.012) (0.021) (0.023) (0.049) (0.616) (0.18) (0.116) Manufacturing (a) (a) (a) (a) (a) (a) (a) (a)
0.705*** 0.631*** 0.770*** 0.799*** 0.884*** 0.869** 0.905 0.792*** (0.006) (0.007) (0.015) (0.017) (0.032) (0.048) (0.077) (0.062)
Regional dummies
Norte (a) --- --- --- --- --- --- ---0.847*** --- --- --- --- --- ---
---(0.006)
1.027*** --- --- --- --- --- --- ---(0.007)
0.926*** --- --- --- --- --- --- ---(0.01)
0.939*** --- --- --- --- --- --- ---(0.011)
0.942*** --- --- --- --- --- --- ---(0.02)
1.014 --- --- --- --- --- --- ---(0.019)
Year dummies Yes Yes Yes Yes Yes Yes Yes Yes
Number of firms 447772 164599 97606 109405 33692 25802 7523 9140
LR X2 (34 ) / LRX2 (28 ) for regions 47329.9*** 17871.03*** 10705.95*** 11192.01*** 3695.93*** 2698.05*** 860.98*** 1421.47***
Log likelihood -422915.7 -152494.34 -91424.886 -106768.52 -33112.584 -23204.949 -6.744.716 -8283.6 Algarve
Açores
Madeira Services
Centro
Lisboa
Alentejo Industry Growth (log)
Growth x Entry rate
Agriculture
Construction Log of current size
Industry (2 digit) start-up entry rate
Start-up industry HHI (2 digit)
Turbulence rate
Variables Portugal Regions
second greatest from 2001. Turbulence is in fact the most significant determinant in the survival probabilities of Portuguese firms in all regions, notably in the Norte.
A known stylized fact is that turbulence is usually higher in services than in the manufacturing sector (Bartelsman et al., 2005a). For the period 2005 and 2006, the Eurostat/OECD (2009) observes that birth (and death) rates are significantly higher in the service sector for the vast majority of countries. This is also the case in Portugal (Sarmento and Nunes, 2010b). Despite this fact, manufacturing is the sector whose firms have the biggest probability of exiting from the market. Concerning the model’s sector dummies, all regions, with the exception of the archipelagoes of Madeira and Açores, show similar results. Norte shows a lower hazard probability rate relatively to manufacturing, when compared to the remaining regions, indicating lower survival chances for industrial firms, already diagnosed by the non-parametric analysis and by the firm demography analysis (GEE, 2010c; Sarmento e Nunes, 2010c). Manufacturing is in fact, the sector where firms are more likely to abandon the market in general, but in particular in the north of the country.
In the estimation of the regional components for the total economy, we can observe disparities among regions. When compared to firms in the Norte, only firms located in Lisbon show a higher probability of exiting the market.
5. Final Remarks
Entrepreneurship has acquired a greater level of importance among the critical success factors that shape regional economic change. Regional growth is very much a product of its human capital, R&D, knowledge-spillovers, networks, industrial culture and last but not least, smart public policy. But it is no less a product of entrepreneurial activity and firm ability, in which the entry of newly created firms results in increased innovation, competition and job creation and the growth of surviving of firms assures a stable pool of employment and value added generation.
Regions face two main imperatives in a globalised and market-driven society, the increase of social welfare through job creation and economic development, brought about by structural change and productivity improvements. As there are usually large sectoral and geographical variations among the success and survival rates of new firms, entrepreneurial adjustment as a consequence of the cycles of enterprise birth, growth and survival is of decisive importance to structural change and for the triggering of converging or diverging patterns in regional ecosystems.
The last decades of the 20th century were characterized by a period of creative destruction in Portugal. In particular, regions such as Norte, Algarve and Madeira show the highest growth rates in enterprise births and deaths and naturally firm churn. After 2000, a new tendency seems to emerge, where both births and deaths of employer enterprises are relatively less turbulent.
The decreasing average size of entrants and exiters in the market occurring during this two decades, can also be considered a major factor hindering firm survival in Portugal, especially in sectors more exposed to international competition.
In the non-parametric analysis for Portugal, we find that around 25% of enterprises entering the market fail within the first 2 years of activity and that more than 50% fail within a period of six years. Breaking down the analysis, we identify statistically significant disparities among regions. Norte has the lowest survival rate and Centro is where firms manage to survive longer. The survival gap between these two regions gets amplified over time.
In line with the literature, we also find that firms that start small and experience faster post-entry growth,
face a higher probability of survival. Firm’s current size dimension is extremely important in determining the
probability of survival, particularly in the Norte and Açores.
industry also generates a shorter duration of firms. It might seem easier to enter the market in earlier stages of the product life-cycle, when markets are expanding, but it becomes particularly hard to survive. Firms that experience more competition from entrants, also face higher probabilities of failure.
However, we observe a different result from the literature, for the effect of industry growth in survival rates. Firms operating in industries which are growing faster seem to suffer from a higher probability of failure. The combined effect of entry and growth helps clarifying this unexpected effect of industry growth on survival probabilities. It is related to turbulence and the high rates of entry and exit verified in most the Portuguese regions throughout this period. Turbulence is in fact the most significant determinant of survival probabilities of Portuguese employer enterprises, particularly in the north of the country. Manufacturing is the sector where more firms are more likely to abandon the market, particularly in the regions of Madeira and Norte.
References
Acs, Z. J. (1996), “Small Firms and Economic Growth”, in P. H. Admiraal (ed.), Small Business in the Modern Economy, De Vries Lectures in Economics, Oxford, U.K.: Blackwell Publishers.
Acs, Z. J. and Audretsch, D. B. (1993), “Conclusion”, in Z. J. Acs and D. B. Audretsch (eds.), Small Firms
and Entrepreneurship: an East-West Perspective, Cambridge, U.K.: Cambridge University Press. Baptista, R., Escária, V. and Madruga, P. (2008), "Entrepreneurship, Regional Development and Job
Creation: the Case of Portugal." Small Business Economics, n. 30, 49-58.
Baptista, R. and Carias, C. (2007), “Job Creation and Destruction by Small Businesses in the Portuguese
Regions”, IN+, presented at the European Regional Science Association, ERSA 2007.
Bartelsman, E.J., Scarpetta, S. and Schivardi, F. (2005a), "Comparative Analysis of Firm Demographics and Survival: Evidence from Micro-level Sources in OECD Countries", Industrial and Corporate Change, Vol. 14 (3), 365–391.
Bartelsman, E. J., Haltiwanger, J. and Scarpetta, S. (2005b), "Measuring and Analyzing Cross Country Differences in Firm Dynamics," (co-authored with Eric Bartelsman and Stefano Scarpetta), in Producer Dynamics: New Evidence from Micro Data, (Dunne, Jensen and Roberts, eds.) NBER/University of Chicago Press.
Boschma, R. and Frenken, K. (2006), “Applications of Evolutionary Economic Geography”, Nº 06-26, DRUID Working Papers, DRUID, Copenhagen Business School.
Boschma, R. and Frenken, K. (2002), “Why is economic geography an evolutionary science?”, ERSA
conference papers, European Regional Science Association.
Cabral, L. (2007), “Small firms in Portugal: A selective Survey of Stylized Facts, Economic Analysis and Policy Implementation”, Portuguese Economic Journal, vol. 6 (1), 65-88.
Carree, M., A. van Stel, R. Thurik and S. Wennekers (2002), “Economic development and business
ownership: an analysis using data of 23 OECD countries in the period 1976-1996”, Small Business Economics 19, 271-290.
Caves, R. E. (1998), "Industrial Organization and New Findings on the Turnover and Mobility of Firms", Journal of Economic Literature 36: 1947-1982.
Colantone, I. and L. Sleuwaegen (2008), "Entry and exit of firms in a global economy: a cross-country and industry analysis", Vlerick Leuven Gent Management School Working Paper Series 2007-36, Vlerick Leuven Gent Management School.
Davelaar, E. J. (1991), “Incubation and innovation: a spatial perspective”, Ashgate, Aldershot.
Eurostat/OECD (2007), "Eurostat/OECD Manual on Business Demography Statistics".
Eurostat (2009), "Business Demography: employment and survival", Statistics in focus, nº 70/2009. GEE (2010a), “Síntese Estatística da Dinâmica Empresarial: Região Madeira”, Gabinete de Estratégia e
Estudos do Ministério da Economia, da Inovação e do Desenvolvimento.
GEE (2010c), “Síntese Estatística da Dinâmica Empresarial: Região Norte”, Gabinete de Estratégia e
Estudos do Ministério da Economia, da Inovação e do Desenvolvimento.
Geroski, P. (1995), "What do we know about entry?", International Journal of Industrial Organization, Vol. 13, p. 421-440.
Gort, M. and Klepper, S. (1982), “Time Paths in the Diffusion of Product Innovations”, Economic Journal,
n. 92, 630-653.
Hannan, M. T. and Freeman, J. (1989), Organizational Ecology, Cambridge, MA: Harvard University Press.
INE (2009), "Anuários Estatísticos Regionais-Informação estatística à escala regional e municipal, 2008”, Destaque, Instituto Nacional de Estatística, 26 de Novembro de 2009.
Loveman, G. and Sengenberger, W. (1991), “The Re-emergence of Small-Scale Production: an
International Comparison”, Small Business Economics 3, 1–37.
Masso, J., R. Eamets and K. Philips (2004) ,“Creative Destruction and Transition: The Effects of Firm Entry
and Exit on Productivity Growth in Estonia”, Discussion Paper Series, Institute for the Study of Labor (IZA).
Mata, J., Portugal, P. and Guimarães, P. (1995), "The survival of new plants: Start-up conditions and post-entry evolution", International Journal of Industrial Organization, n.13, 459-481.
Nelson, R. R., and Winter, S. G. (1982), An Evolutionary Theory of Economic Changes, Cambridge MA: Harvard University Press.
Nunes, A. and Sarmento, E. de Morais (2010a), “Business demography dynamics in Portugal: a
semi-parametric survival analysis”, Working Papers do Grupo de Estudos Monetários e Financeiros, nº
9/2010, Universidade de Coimbra (2010).
Nunes, A. and Sarmento, E. de Morais (2010b), “Business demography dynamics in Portugal: a non -parametric survival analysis”, Working Papers do Grupo de Estudos Monetários e Financeiros, nº 10/2010, Universidade de Coimbra (2010).
Nunes, A. and Sarmento, E. de Morais (2010c), “Análise comparativa de sobrevivência - o caso da região
Norte de Portugal”, Actas do 16º Congresso da Associação Portuguesa de Desenvolvimento Regional, Coimbra, 2010.
Núñez, S. R. (2004), “Salida, entrada y tamaño de las empresas españolas”, Boletín económico, Banco de España, Nº 3, 2004, page 53.
OECD/Eurostat (2009), "Measuring Entrepreneurship A Collection of Indicators 2009 Edition", OECD/Eurostat Entrepreneurship Indicators Programme.
Pellenbarg, P. H. and van Steen, P. J.M. (2003), "Spatial Perspectives on Firm Dynamics in The Netherlands," Tijdschrift voor Economische en Sociale Geografie, Royal Dutch Geographical Society KNAG, vol. 94(5), pages 620-630, December.
Robinson, C., O´Leary, B., Rincon, A. (2006), “Business start-ups, closures and economic churn, a review
of the literature”, National Institute of Economic and Social Research, Final Report prepared for the Small Business Service, 23rd August of 2006.
Sarmento, E. Morais and Nunes, A. (2010a), “Getting smaller: size dynamics of employer enterprises in Portugal”, presented in the II International Workshop Entrepreneurship Culture and Finance, Spain.
Sarmento, E. de Morais and Nunes, A. (2010b), “Entrepreneurship Performance Indicators for Active Employer Enterprises in Portugal”, Temas Económicos nº 9, Ministério da Economia, da Inovação e do Desenvolvimento.
Sharpe, A. e Currie, I. (2008), "Competitive Intensity as Driver of Innovation and Productivity Growth: A Synthesis of the Literature", CSLS Research Reports 2008-3, Centre for the Study of Living Standards.
Storey, D. ed. (1994), Understanding the small business sector, Thomson Learning.
Thurik, A. R. (1999), “Entrepreneurship, Industrial Transformation and Growth”, in G. D. Libecap (ed.), The
Sources of Entrepreneurial Activity: Vol. 11, Advances in the Study of Entrepreneurship, Innovation, and Economic Growth, JAI Press, pp. 29–65.
Van Dijk, J. and Pellenbarg, P. H. (1999), "Firm relocation decisions in The Netherlands: an ordered logit