Braz. J. of Develop.,Curitiba, v. 6, n. 2,p.6440-6463 feb. 2020. ISSN 2525-8761
Research on risk management in logistics: metrics and trends/
Pesquisa sobre gestão de riscos em logística: métricas e tendências
DOI:10.34117/bjdv6n2-082
Recebimento dos originais: 30/12/2019 Aceitação para publicação: 07/02/2020
Ercilia de Stefano
Doutora em Engenharia de Transportes - UFRJ - COPPE - PET Professora Adjunta UFF
Endereço:Rua Domingos Silvério, 01 - Quitandinha – Petrópolis E-mail: ercilia@ufrj.br
Leonardo de Oliveira Farroco
Pós-graduado em Plataforma de Desenvolvimento Web Endereço:Rua Maria da Silva Ligeiro, Taquara - Petrópolis - RJ
Gilson Brito Alves Lima
Doutor em Engenharia de Produção, UFRJ Professor Titular UFF
Endereço:R. Passo da Pátria, 156 - Boa Viagem - Boa Viagem, Niterói - RJ, 24210-240
Osvaldo Luiz Gonçalves Quelhas
Doutor em Engenharia de Produção, UFRJ Professor UFF
Endereço:R. Passo da Pátria, 156 - Boa Viagem - Boa Viagem, Niterói - RJ, 24210-240
ABSTRACT
This study intends to provide researchers with metrics and trends in the area of Supply Chain Risk Management (SCRM). This study analyzed 980 scientific articles with diverse methods, including counting of references, co-authorship, research share per country and visual representations of the partnerships between authors and most common words per country.The research used a set of tools, named MetrIA, to perform the processing of data. The results highlighted the cooperation between countries, and indicated what the institutions are engaging in research about the theme. Other indicators also point what are the most common themes being studied and how this interest changed over time.
Braz. J. of Develop.,Curitiba, v. 6, n. 2,p.6440-6463 feb. 2020. ISSN 2525-8761
RESUMO
Este estudo pretende fornecer aos pesquisadores métricas e tendências na área de Supply Chain Risk Management (SCRM). Este estudo analisou 980 artigos científicos com diversos métodos, incluindo contagem de referências, coautoria, participação em pesquisas por país e representações visuais das parcerias entre autores e palavras mais comuns por país.A pesquisa utilizou um conjunto de ferramentas, chamado MetrIA, para executar o processamento de dados. Os resultados destacaram a cooperação entre os países e indicaram o que as instituições estão realizando na pesquisa sobre o tema. Outros indicadores também apontam quais são os temas mais comuns em estudo e como esse interesse mudou com o tempo.
Palavras-chave:Gerenciamento de riscos da cadeia de suprimentos, Revisão de literatura,
Bibliometria, MetrIA
1 INTRODUCTION
Buying small goods from distant countries and having them delivered on time and for a reasonable price is a marvel of the modern distribution system. This type of task used to be an expensive, bureaucratic and slow process - which made such endeavors privilege of large corporations. This is possible thanks to an extensive infrastructure that involves thousands of people and systems distributed in the supply chain. This development of the Logistics sector would not be enough to ensure an effective system, as there are risks involved into these operations.
The increase of outsourcing of goods and services in the supply chain has also added risks to the operations: “... as organizations increase their dependence on the suppliers of outsourced raw materials and components, they become more susceptible to their risk profiles” (Lockamy & McCormack 2010).
Due to the risks involved in each operation, the research about Supply Chain Risk Management (SCRM) gains importance, as new tools and techniques needs developing to deal with these challenges.
The introduction of new technologies created new opportunities, but also increase numbers of variables that need to be evaluated. Due to that, these risks need to be accounted, managed and treated accordingly to their specificities. As these risks need to be identified and be properly treated, how have scientific interest tackled these new challenges?
The increasing amount of information available for research makes it harder to follow the advances in a field of study. The amount of papers available for reading can be overwhelming for students or researchers without previous knowledge of the area of study. Estimates indicate that the amount of new papers published per year surpasses 1 million, and
Braz. J. of Develop.,Curitiba, v. 6, n. 2,p.6440-6463 feb. 2020. ISSN 2525-8761
this number increases by 5.6% yearly (Larsen & von Ins 2010). In order to deal with this information overload, researchers can find in bibliometrics tools to identify influential works in their area of study.
This paper is composed of four sections. The first one presents the theoretical background for the research, with a review of SCRM and bibliometrics. The second one details the process of data gathering and what analyses have been performed over it. The third section presents the results obtained with the analysis. The fourth one contains a discussion about the results obtained in the previous section, the difficulties faced in the process, conclusions and outlines possible future research.
2 METHODOLOGY
2.1. SUPPLY CHAIN RISK MANAGEMENT
There are multiple definitions of SCRM in the researched literature. It can be defined as “the management of supply chain risks through coordination or collaboration among the supply chain partners so as to ensure profitability and continuity” (Tang 2006). According to the author, the area is the intersection between Risk Management and Supply Chain management, two established fields of study. Vanany et al. (2009) also defines SCRM, pointing that it “is a set of activities aimed at reducing supply chain risks. These activities often include identifying supply chain risks, assessing the probabilities and the severity of impacts”. In another definition (Wieland A, Marcus Wallenburg C. 2013) it is “the implementation of strategies to manage both daily and exceptional risks along the supply chain based on continuous risk assessment with the objective of reducing vulnerability and ensuring continuity”.
These definitions help to portrait SCRM as an area of study that attempts to reduce the vulnerability of the Supply Chain using broad and coordinated action between the actors involved in it, helping to identify what are the risks and flaws in the chain. SCRM also promotes the continuity of business, activities, operations and routine processes.
In order to prioritize and catalog the risks, companies need to define a set of criteria to identify a risk for its operations. Once these risks are identified as internal or external, it is possible to develop plans to treat these risks. This included measures to protect the supply chain from these risks and to answer to events that these risks might cause, as well how to continue operations and recover from the impacts if they indeed happen.
Braz. J. of Develop.,Curitiba, v. 6, n. 2,p.6440-6463 feb. 2020. ISSN 2525-8761
To measure risks and performance of the plans to limit and/or answer interruptions, company also need to perform continuous training and monitoring to follow this process. The monitoring and revision of the plans implicate not only the evaluation of the effects and its risk treatment, but also the continuous identification of opportunities and improvement. Some commonly mapped risks to the supply chain are volatile costs, insufficient materials, problems and financial flaws from suppliers and natural disasters of human origin. SCRM strategies and software help organizations to prevent possible problems and to adapt to these risks in the fastest and efficient possible way (Granot, E. et al. 2012).
It is also possible to point other factors including bad communication and uncertain about the performance from goods provided by suppliers (Blos et al. 2009). Other factors, like natural disasters and political unrest also need to be taken into account. There are multiple factors that push the need for risk management in an operation, such as safety and competitive performance (Pereira et. al., 2015).
Besides not being formalized as a single area of knowledge, the activities related to Supply Chain Risk Management can be traced back to ancient times. Many techniques have been the point of interest of merchants, governments and military leaders through the ages. According to Tepić et al. (2011), the earliest forms of insurance have been registered in the Chinese and Babylonian societies, going as far as the 3rd and 2nd millennia BC. Chinese merchants would split goods between different vessels to reduce the risk of losing cargo if one of the ships would sink. In the Babylonian society, the Code of Hammurabi (the oldest registered law code, created at 1750 BC) shows the practice of insurance: if a merchant acquired a loan to transport goods, he could pay an additional sum to the lender to allow the cancellation of the loan if the cargo was lost at sea or stolen.
According to Dionne (2013), the study of risk management started to grow faster after World War II. Besides being associated with the usage of insurance to protect persons and companies from accidents, the market found others uses for it in the following decades.
The author points that the techniques related to risk management have been improved in the 1970s and 1980s, when it also gained regulation for international activities. The governance of risk management gained importance inside corporations, with employees responsible for these processes being placed in high positions into companies.
Braz. J. of Develop.,Curitiba, v. 6, n. 2,p.6440-6463 feb. 2020. ISSN 2525-8761 2.2 SCRM BIBLIOMETRICS
Because authors cite earlier work in order to support, describe or develop a particular point in their own work, the citation of a scientific paper is an indication of the importance that the community attaches to the research. Thus, citations can be considered a criterion for selecting the most highly esteemed scientific journals on the basis of the articles they contain (Okubo 1997).
According to Wouters (1999), one of the main breakthroughs in the area of bibliometrics was the creation of the Science Citation Index (SCI). The SCI is a bibliometric index with citations from more than 8500 journals since 1900. It established the grounds to the statistical analysis of scientific production and the creation of indicators of scientific production.(Seglen 1992; Wouters 1999).
One of main problems about collecting academic information for analysis is establishing what constitutes a trust able publication - as Garfield (2006) points out that establishing what is a scientific journal is not an objective task. The introduction of the Science Citation Index established this distinction: publications listed in the index started to be considered “mainstream”, and the one outside of considered alternative (Frame, 1977).
Bibliometric studies have also established a “boundary” between “strong” and “weak” journals, as journals included in the SCI gained prestige.
The interest of researchers can be portrayed by scientific publications, as publishing articles in an expression of their work. The analysis of peer-reviewed articles also provide quality-control about the produced works, making sure that the information being analyzed is objective, precise and it is shared in a properly-themed journal. According to Okubo (1997), tracking publications is an effective method to assert the developing of knowledge, because there are many factors that push researchers into publishing: by performing this act, researchers are protecting the intellectual property of their work, as claims of ownership of an idea can be laid on those that published it (Okubo 1997). In addition, researchers are compelled to publish by their institutions, thus sharing the information with other scientists and promoting advances in the studied field. The author also points out that there is a social factor: personal recognition in the scientific community.
One of the ways to analyze such interest is to study the corpus of scientific texts using bibliometric analysis. Bibliometrics, according to Okubo (1997), is “tool by which the state of science and technology can be observed through the overall production of scientific literature”. This type of analysis allows looking at a macro levels (countries, fields of research,
Braz. J. of Develop.,Curitiba, v. 6, n. 2,p.6440-6463 feb. 2020. ISSN 2525-8761
institutions, and networks of publishers) and micro levels (a specific publication in a given year, a single author, etc.).
According to van Raan (2004), the advantage of this type of analysis is to overcome some limitations provided by the peer review process:
“(…) peer review may have serious shortcomings and disadvantages. Subjectivity, i.e. dependence of the outcomes on the choice of individual committee members, is one of the major problems. This dependence may result in conflicts of interests, unawareness of quality or a negative bias against younger people or newcomers to the field. To make peer review more objective and transparent, it should be supported by advanced bibliometric methods.”
Okubo (1997) also highlights that type of analysis allows assessing the state that science has achieved at that moment, aiding in decisions making for policies in the relative areas of study.
Citations are a usual metric in bibliometrics, because they provide some insights into the origins of the information contained in the article. In addition, citations are a measure of the overall impact of an article’s influence, or its authors, on the scientific community; they are a complex socio-epistemological parameter which probably induces a quality factor, but this factor is neither equivalent to, nor unequivocally correlated with, scientific quality (Seglen, 1992).
There are some points that require the attention of researchers when dealing with metrics from citations: some citations are negative (discrediting work), not endorsements.
It is also worth to note bibliometric alone is not enough to justify a decision or replace an expert in a given field, according to Okubo (1997). These indicators should be employed alongside other tools, in order to provide an overview of a field.
3 THEORETICAL FRAMEWORK AND DATA COLLECTION
This study analyzed 979 items, with 722 of them being articles and 257 conference papers. The studied items were published between the years 1975 to 2016. As this study
Braz. J. of Develop.,Curitiba, v. 6, n. 2,p.6440-6463 feb. 2020. ISSN 2525-8761
intends to analyze peer-reviewed articles, other results including editorials, books and dissertations where excluded from the analysis.
One difficulty found when parsing citation data was the lack of a clear standard, making necessary to perform multiple adjustments to the parsing algorithm. In some citations the paper date comes after the authors and the title, in other ones it comes between them.
The 979 items being analyzed performed 37,697 citations, with 5,101 (13.5% of the total) being defective. These items create some noise into the database, but do not compromise the results, as their sum achieves a low percentage.
By using MetrIA (de Stefano et al., 2016), the results presented in this study can be replicated by following the methodology described below. It is possible to adjust the analysis with other parameters to discover new scenarios. The MetrIA (de Stefano et al., 2016) tools used to model the data have open source code, allowing additional customization of results.
When counting citations, co-authorship has been counted as one per author, instead of using fractions. If two people author a paper, each is assigned the authorship of a “whole” paper, instead of half per each. Choosing to use between a whole counting and a fraction counting is an extensive question when analyzing citations, but using the fraction method is known to create difficulties when cooperation between countries is involved (Leydesdorff, 1991).
One of the main problems when performing a bibliometric analysis is deciding on which database to use. As this study intends to analyze papers that cover the subjects “risk management” and “supply chain”, there is not a specific journal to be studied. Due to this, the researchers of this study chose to use the Scopus database to query these terms and analyze its results. Therefore, as Scopus provides information like abstract, reference list, author’s names and affiliations, there is enough information to perform diverse analysis.
As Scopus provides the data in Comma Separated Values (CSV) files, it is possible to model the data in other software.
3.1 THE METRIA SOFTWARE
As the data provided by Scopus did not provide enough details about the existing relationships in the data set, nor additional details about the references contained in the report, this study employed a specialist software named MetrIA (de Stefano et al., 2016). The software allows performing Natural Language Processing tasks in groups of text. As the data exported by Scopus contains the abstract of each article, it was possible to have a graphical
Braz. J. of Develop.,Curitiba, v. 6, n. 2,p.6440-6463 feb. 2020. ISSN 2525-8761
representation of the content produced in the database by location and date. The graphs were rendered in the Gephi (Bastian et al. 2009) software using CSV files generated by MetrIA.
The file “parse-coops.js” parses the “Affiliations” column of the input file (the CSV exported by Scopus). For each row, it splits each affiliation and identifies its origin country. As affiliations do not have a standard formatting (some include the complete address, others skip the city name, etc.), the script searchers for common keywords (“univ-” from “University”, “instit-” from “Institute”, and so on) and uses the section of the affiliation that uses the keyword. If it is unable to find one the keywords, it uses the whole affiliation name. After the identification, the software registers the cooperation between institutions and countries. If an article is authored by different institutions, MetrIA registers this relationship in an undirected graph. This type of graph is “the graph formed by converting each edge of the directed graph into an undirected edge and removing duplicate edges. An undirected graph is connected if there is a path between every pair of vertices” (Tarjan, 1972). There is not a “source” and “target” relationship in an undirected graph – it just documents that there is a connection between two nodes.
The “count-references.js” file counts all the items contained in the “References” column (each text in the extracted corpus can have multiple references in a single cell). As this information is not provided in a structured way, the script normalizes the reference and isolates its title and publishing date, as the data provided in the input file has variations between two instances of the same reference. Some references have as much as 10 variations, like including a print instead of an online version, presence/absence of page number, year being list before or after the title and others. The script attempts identify the parts of the reference, having an 87% success rate.
The “parse-words.js” file identifies common words in the whole group of the input file, and by country. The file uses an open source Natural Language Processing (NLP) library, named Natural Node1. NLP “is an area of research and application that explores how computers can be used to understand and manipulate natural language text or speech to do useful things” (Chowdhury, G.G., 2003). The script identifies the column containing the abstract of the text and then separates each text into an array of words (tokenization). The following step is to remove common words from the English language (Stop Words), comparing each word with a dictionary and removing matches. Each word is also normalized
Braz. J. of Develop.,Curitiba, v. 6, n. 2,p.6440-6463 feb. 2020. ISSN 2525-8761
into the singular form. This script also creates a graph of the words, showing the relationship between words used in the same abstract. To do so, it registers each word as a node and all words that occur in the same text are registered as edges. After the processing is completed, words that occurred less than five times are excluded to increase the performance of Gephi – even by doing so, graphs using large corpus tend to still have thousands of words.
3.2 THE SCOPUS DATABASE
To obtain large amount of scientific articles is a challenging task – a researcher interested into doing so needs to confront multiple systems that catalog their content without following a standard, creating difficulties to parsing the information. In addition, given the amount of scientific articles that are published yearly, having the infrastructure to download and store large data sets of information – and the computational power to process them – requires expansive investment.
In order to have access to many articles, the researchers of this study chose to employ the Scopus database. Scopus presents itself as a bibliographic database with abstracts and citations from scientific articles. As of January 2017, According to its web page, the database claims to contain 22,000 publications from 5,000 different publishers.
This study chose the Scopus database for the size of its catalogue and due to its ease of use – as it allows exporting query results into Comma Separated Value (CSV) files and then to model the data into other software.
The first step was to access the Scopus database homepage and query the following parameters: Risk Management AND Supply Chain. The “AND” keyword is a logic operator to ensure that results will contain the expressions “Risk Management” and “Supply Chain”.
The database provides around 12 thousand results for this query. As the concept of Risk Management and Supply Chain can be employed into different areas of study, adding a filter is required. The results have been limited to papers in the areas of “Business, Management and Accounting”, “Decision Sciences” and “Economics, Econometrics and Finance”.
This filtering reduced the amount of results to 979 items. As this study intended to list the main references of each year since 2006, the results from the year 2017 were excluded from the query, as this year was not finished until the submitting of this study.
Braz. J. of Develop.,Curitiba, v. 6, n. 2,p.6440-6463 feb. 2020. ISSN 2525-8761
Scopus provides some built-in tools to verify some insights about the queried data: authors, journals and countries listed by publication. Some of these results were also put into context in this study.
To perform additional analyses, the query results were exported to a CSV file (by checking the “export all available information” option). Some tools from MetrIA are employed to parse the exported data. The objective of this analysis is to verify what the main sources of information in the corpus are.
4 RESULTS
The results generated by MetrIA using the data from Scopus are listed below:
4.1 COOPERATION MAP - INSTITUTIONS
The CSV data obtained on Scopus have been parsed by MetrIA and generated two CSV files for Gephi – one for the nodes (institutions) and one for the edges (cooperation between them).
This is a graphical representation of the cooperation between different institutions. A total of 713 nodes and 537 edges have been identified in this graph, but as there is a limitation to the amount of information that can be registered in paper, 31 nodes (a 4, 35 % of the total) and 61 edges (11, 36% of the total) are visible in the graph below, showing nodes that had at least 5 links to other institutions in the examined period.
The collaboration between institutions and countries has become more important in modern days, according to van Leeuwen (2008). The author points out that “scientific cooperation has taken a much more significant place in the worldwide science system”, as the number of articles elaborated by a single author shows a trend of decrease.
Braz. J. of Develop.,Curitiba, v. 6, n. 2,p.6440-6463 feb. 2020. ISSN 2525-8761 Fig.1 - Cooperation graph per institutions, rendered by Gephi
The graph allows visualizing the relation between various universities and institutes. The size of the circles indicates the degree of the node - larges circles have more connections. It is possible to see a relation between universities from the UK and the Hong Kong Polytechnic University that acts as a gate linking British to Chinese research, creating a chain. Various state universities from the US form a link, with only Michigan State University and
Iowa State University having external connections.
4.2 COLLABORATION MAP - COUNTRIES
The country affiliation from the authors of the studied items has also been analyzed. MetrIA used the CSV file provided by Scopus as a input and provided two CSV files ready for use on Gephi – one for the nodes (countries) and for the edges (when two or more countries cooperate for publishing an article).
Braz. J. of Develop.,Curitiba, v. 6, n. 2,p.6440-6463 feb. 2020. ISSN 2525-8761 Fig.2 - Cooperation between countries
This graph displays the cooperation between different countries when doing Risk Management on Supply Chain research. The complete graph has 66 nodes and 209 edges. The filtered version displayed above shows countries that published with at least three different countries. This version reduced the number of nodes to 31 (41, 97% of the total) and 183 edges (87, 56% of the total). Larges nodes indicate a greater number of connections to other nodes. Larger nodes have darker colors.
The graph shows that China, USA and UK are not only the leading publishers; they are also the most involved into collaborative research. The three countries also develop work together constantly, as the edges between them indicate. The graph allows the visualization
Braz. J. of Develop.,Curitiba, v. 6, n. 2,p.6440-6463 feb. 2020. ISSN 2525-8761
that China has partnerships with its neighbors, composing most of its connections. The countries that have connections to all top three ones are Singapore, Canada, Sweden and Hong Kong – other countries have up to two out of three connections. In addition, Europe shows three hubs, one centered in France, other in Germany and another in Spain.
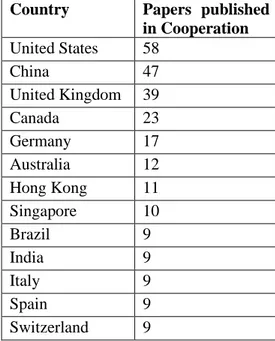
4.3 COUNTRIES INVOLVED ON INTERNATIONAL COOPERATION (2006-2016) The countries that published most articles in cooperation with other countries are listed below. The list includes countries that published 9 or more papers alongside other countries.
Country Papers published
in Cooperation United States 58 China 47 United Kingdom 39 Canada 23 Germany 17 Australia 12 Hong Kong 11 Singapore 10 Brazil 9 India 9 Italy 9 Spain 9 Switzerland 9
Table 1 - Countries that co-authored nine or more papers
The five countries in the top of list (United States, China, United Kingdom, Canada and Germany) have additional details listed below.
4.3.1 – Cooperation - United States
The United States worked alongside other nations in 58 articles, being the country in the top of list of the most active locations. Its main collaborators are China, France and Canada. Countries with less than two works published in cooperation with the US have been grouped in the “Others” section.
Braz. J. of Develop.,Curitiba, v. 6, n. 2,p.6440-6463 feb. 2020. ISSN 2525-8761 Fig.3 - Cooperation Chart, USA
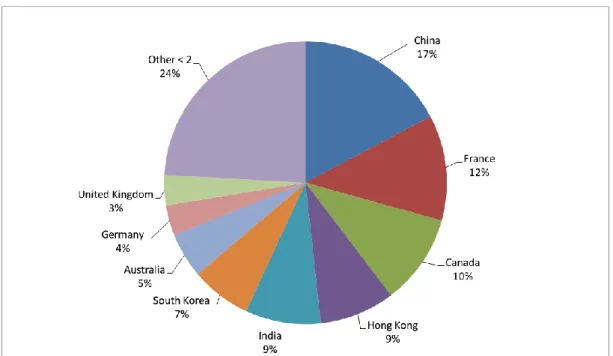
4.3.2 Cooperation – China
The China chart shows that the United States and Hong Kong are China’s main partners in research. Countries that had less than two works published with the China have been grouped in the “Others” section.
Braz. J. of Develop.,Curitiba, v. 6, n. 2,p.6440-6463 feb. 2020. ISSN 2525-8761
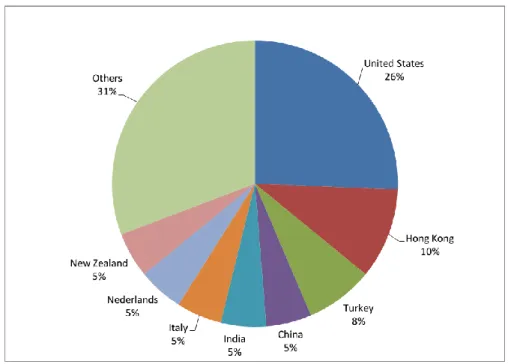
4.3.3 Cooperation– United Kingdom
The United Kingdom have the United States and Hong Kong as the main partners in research, the same two as China. Countries that had less than two works published with the UK have been grouped in the “Others” section.
Fig. 5 - Cooperation Chart, UK
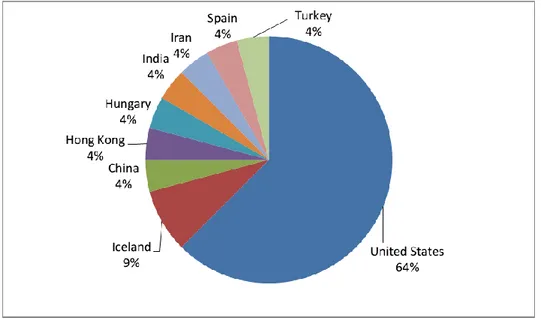
4.3.4 Cooperation Chart – Canada
The main partner of Canada’s research is the United States, followed by Iceland. Other countries that are listed in the chart have a single work of cooperation.
Braz. J. of Develop.,Curitiba, v. 6, n. 2,p.6440-6463 feb. 2020. ISSN 2525-8761 Fig. 6 - Cooperation Chart, Canada
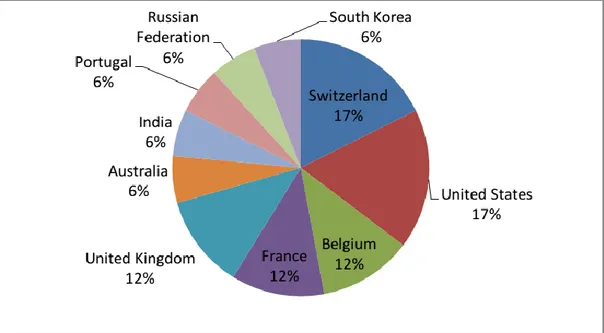
4.3.5 Cooperation Chart – Germany
Germany shows as main partners the United States and Switzerland, followed by France, Belgium and the United Kingdom.
Germany shows as main partners the United States and Switzerland, followed by France, Belgium and the United Kingdom
Braz. J. of Develop.,Curitiba, v. 6, n. 2,p.6440-6463 feb. 2020. ISSN 2525-8761 Fig. 7 - Cooperation Chart, Germany
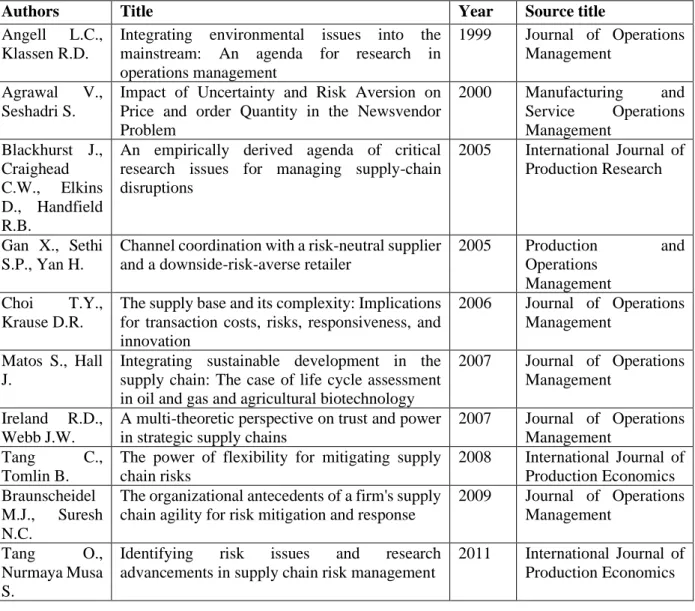
4.4 MOST CITED PAPERS
The counting of cited papers is a simple metric that helps to determine the impact level of a publication. Below are listed the most cited articles amongst the analyzed items. According to Verbeek et al. (2002), “highly cited articles represent fundamental themes, concepts, research streams, and methods in science”. In other words, articles that are effective into presenting concepts have a higher chance of being cited, because other authors can refer to them to present new concepts.
According to Wallin (2005), the number of references demonstrates correlation with the “peer judgments about scientific merit and excellence and the significance of contributions”.
The table below lists the most cited papers in the group of 979 items that are being analyzed. It is important to note this number references to the total of citations that the papers received, including from sources beyond the analyzed papers.
Braz. J. of Develop.,Curitiba, v. 6, n. 2,p.6440-6463 feb. 2020. ISSN 2525-8761
Authors Title Year Source title
Angell L.C., Klassen R.D.
Integrating environmental issues into the mainstream: An agenda for research in operations management
1999 Journal of Operations Management
Agrawal V.,
Seshadri S.
Impact of Uncertainty and Risk Aversion on Price and order Quantity in the Newsvendor Problem 2000 Manufacturing and Service Operations Management Blackhurst J., Craighead C.W., Elkins D., Handfield R.B.
An empirically derived agenda of critical research issues for managing supply-chain disruptions
2005 International Journal of Production Research
Gan X., Sethi S.P., Yan H.
Channel coordination with a risk-neutral supplier and a downside-risk-averse retailer
2005 Production and
Operations Management
Choi T.Y.,
Krause D.R.
The supply base and its complexity: Implications for transaction costs, risks, responsiveness, and innovation
2006 Journal of Operations Management
Matos S., Hall J.
Integrating sustainable development in the supply chain: The case of life cycle assessment in oil and gas and agricultural biotechnology
2007 Journal of Operations Management
Ireland R.D., Webb J.W.
A multi-theoretic perspective on trust and power in strategic supply chains
2007 Journal of Operations Management
Tang C.,
Tomlin B.
The power of flexibility for mitigating supply chain risks 2008 International Journal of Production Economics Braunscheidel M.J., Suresh N.C.
The organizational antecedents of a firm's supply chain agility for risk mitigation and response
2009 Journal of Operations Management
Tang O.,
Nurmaya Musa S.
Identifying risk issues and research
advancements in supply chain risk management
2011 International Journal of Production Economics
Table 2 – Most cited papers in the analyzed group
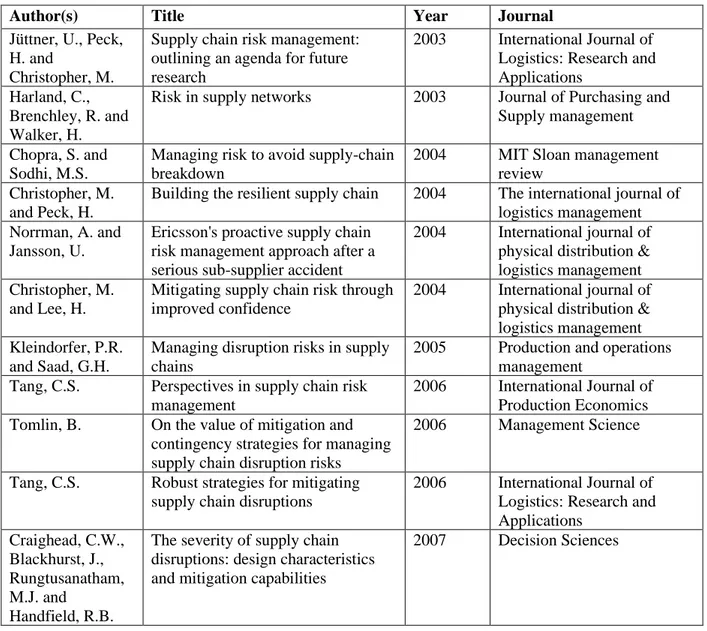
4.5 MOST CITED PAPERS BY THE ANALYZED GROUP
The references contained in the analyzed items composed another group of cited articles, making it possible to list the most cited papers by the studied items. It is possible to note the author Blackhurst, J. is present in this list and the previous list of papers with most citations amongst the corpus of this study.
Braz. J. of Develop.,Curitiba, v. 6, n. 2,p.6440-6463 feb. 2020. ISSN 2525-8761
Author(s) Title Year Journal
Jüttner, U., Peck, H. and
Christopher, M.
Supply chain risk management: outlining an agenda for future research
2003 International Journal of
Logistics: Research and Applications
Harland, C., Brenchley, R. and Walker, H.
Risk in supply networks 2003 Journal of Purchasing and
Supply management Chopra, S. and
Sodhi, M.S.
Managing risk to avoid supply-chain breakdown
2004 MIT Sloan management
review Christopher, M.
and Peck, H.
Building the resilient supply chain 2004 The international journal of logistics management Norrman, A. and
Jansson, U.
Ericsson's proactive supply chain risk management approach after a serious sub-supplier accident
2004 International journal of
physical distribution & logistics management Christopher, M.
and Lee, H.
Mitigating supply chain risk through improved confidence
2004 International journal of
physical distribution & logistics management Kleindorfer, P.R.
and Saad, G.H.
Managing disruption risks in supply chains
2005 Production and operations
management
Tang, C.S. Perspectives in supply chain risk
management
2006 International Journal of
Production Economics
Tomlin, B. On the value of mitigation and
contingency strategies for managing supply chain disruption risks
2006 Management Science
Tang, C.S. Robust strategies for mitigating
supply chain disruptions
2006 International Journal of
Logistics: Research and Applications Craighead, C.W., Blackhurst, J., Rungtusanatham, M.J. and Handfield, R.B.
The severity of supply chain disruptions: design characteristics and mitigation capabilities
2007 Decision Sciences
Table 3 – Most cited papers by the studied corpus
It is worth to note as the analyzed texts were from the 1975 to 2016 period, texts from the last years had a lower chance of being referred, creating a bias towards the counting of texts from earlier years.
4.6 PUBLICATIONS ABOUT SCRM BY COUNTRY (2006-2016)
The interest in the area of SCRM per country is demonstrated in the table below which lists the 10 countries with most publication in the area. It is possible to notice a surge in numbers of published articles by China in the years 2010-2011. The table is limited for the last 10 years to provide a clearer visualization of data.
Braz. J. of Develop.,Curitiba, v. 6, n. 2,p.6440-6463 feb. 2020. ISSN 2525-8761 Country 2006 2007 2008 2009 2010 2011 2012 2013 2014 2015 2016 USA 3 9 14 25 29 25 19 24 39 23 30 China 1 5 20 19 60 25 11 8 13 17 12 UK 2 7 3 8 8 5 6 7 9 10 8 German y 0 0 2 4 5 7 5 7 8 5 6 India 1 2 0 1 2 3 7 5 2 9 8 Italy 3 0 0 1 3 2 2 5 7 3 3 Hong Kong 2 0 1 2 5 1 4 2 0 5 2 Australi a 0 0 1 3 1 4 2 3 2 5 3 Canada 0 2 0 0 1 1 3 1 4 2 5 South Korea 0 0 1 0 2 2 6 3 1 1 3 Others 3 14 17 18 12 14 23 26 37 33 34
Table 4 – Countries with most publications between 2006 and 2016 4.7 AUTHORS WITH MOST PUBLICATIONS ABOUT SCRM
The most frequent authors, their affiliations and countries have also been counted and parsed from the source file. This quantitative metric allows identifying what authors are focusing into the area of SCRM.
As this metric presents a raw number, it does not address the quality or the impact of the counted articles – to do that additional indicators are required. Still, it is possible to affirm that an article published in a peer-reviewed journal possess “a minimum level of quality or utility in terms of its success in passing the journal selection process” (Nederhof 2007). Due to this, the counted articles might not be the best of their group, but they indeed have at least some degree of quality.
It is possible to notice that the name of Jennifer J. Blackhurst, from the University of Iowa, is listed in both the most cited articles and most cited by the corpus.
Authors Articles Affiliation Country
Wagner, S.M. 11 Swiss Federal Institute of Technology Zurich Switzerland
Cheng, T.C.E. 7 The Hong Kong Polytechnic University Hong Kong
Choi, T.M. 7 The Hong Kong Polytechnic University Hong Kong
Cruz, J.M. 6 University of Connecticut USA
Blackhurst, J. 5 University of Iowa USA
Govindan, K. 5 University of Southern Denmark Denmark
Gunasekaran, A. 5 University of Massachusetts Dartmouth USA
Gurnani, H. 5 Wake Forest University USA
Olson, D.L. 5 University of Nebraska USA
Shankar, R. 5 Indian Institute of Technology Delhi India
Xiao, T. 5 Nanjing University of Finance and Economics China
Braz. J. of Develop.,Curitiba, v. 6, n. 2,p.6440-6463 feb. 2020. ISSN 2525-8761
The combined results show that there was a spike in Chinese output between the years 2010-2011, indicating that this area of research received additional attention in this period. This attention might be caused due to governmental, academic or corporate guidelines to perform analysis in this area. Looking at the list of papers in this period it is possible to notice that most of the articles have similar titles, hinting that the subjects have been partitioned between researchers, allowing covering whole topics in a reduced period.
The cooperation between countries in the area of SCRM also provided some insights, displaying regional hubs of research of cooperation between distant locations, including the UK and Hong Kong
Citations are able to provide relevant data to analyze the evolution of science and technology, but their analysis alone is not enough to create a trustful portrait. As citations have their limitations (not all citations have the same “weight”, some citations have “negative value” when used to as a parameter to be countered), it is needed to use additional indicators to achieve a safer conclusion.
The study found it difficult to parse reference text from the source data, but managed to obtain an 87% success rate. Moed et al. (1985) noticed these problems related to data collection and handling in the field of bibliometrics, but also pointed that it is possible to overcome most of these problems. The author also observed that bibliometric indicators “can provide a ‘monitoring device’ for university research-management and science policy”.
Countries around the whole world show interest into SCRM, as countries in the Americas, Europe and Asia show engagement in the theme. The cooperation of different institutions has also been observed, making it possible to identify distinct “hubs” of research, notably the international connections of universities in China, Hong Kong, the USA and the UK.
Future research in the field may create additional discussions about these results, portraying which topics of SCRM correlate with these co-authorships, allowing researchers in the field to identify the strategic interest of companies and governments in the area, as well hinting about new techniques and tools in development.
5 CONCLUSION
This amount of research about Risk Management in Logistics happens around the whole globe and is aligned with the importance that external trade has for a given country. The
Braz. J. of Develop.,Curitiba, v. 6, n. 2,p.6440-6463 feb. 2020. ISSN 2525-8761
countries that create more content in the area are also the ones that perform more research in partnerships with institutions of other countries. The cooperation between different countries happens mostly in countries that display strong economic activity between each other, with hubs centered in the US, China, UK and Germany. There are also local hubs of interaction in Europe and Asia.
The variation in the amount of publications about SCRM shows a growing interest from researchers, their universities and support from their governments to perform the creation of content in the area.
Future research about bibliometrics in the area of SCRM may explore its relations with other areas of knowledge, as well to investigate more details about the co-authorships and the motivations to research in the area.
REFERENCES
Bastian, M., Heymann, S. & Jacomy, M., 2009. Gephi: an open source software for exploring
and manipulating networks. ICWSM. Available at:
http://www.aaai.org/ocs/index.php/ICWSM/09/paper/viewFile/154/1009/.
Blos, M.F. et al., 2009. Supply chain risk management (SCRM): a case study on the automotive and electronic industries in Brazil. Supply Chain Management: An International
Journal, 14(4), pp.247–252.
Chowdhury, G.G., 2003. Natural language processing. Annual review of information science
and technology, 37(1), pp.51-89.
de Stefano, E., de Sequeira Santos, M.P. and Balassiano, R., 2016. Development of a software for metric studies of transportation engineering journals. Scientometrics, 109(3), pp.1579-1591.
Dionne, G., 2013. Risk Management: History, Definition, and Critique. Risk Management and Insurance Review, 16(2), pp.147–166.
Frame, J.D. (1977), “Mainstream Research in Latin America and the Caribbean”, Interciencia, Vol. 2 (3), pp. 143-148.
Garfield, E., 2006. Citation indexes for science. A new dimension in documentation through association of ideas. International journal of epidemiology, 35(5), pp.1123-1127.
Braz. J. of Develop.,Curitiba, v. 6, n. 2,p.6440-6463 feb. 2020. ISSN 2525-8761
Granot, E., Brashear, T.G. and Cesar Motta, P., 2012. A structural guide to in-depth interviewing in business and industrial marketing research. Journal of Business & Industrial
Marketing, 27(7), pp.547-553.
Larsen, P.O. & von Ins, M., 2010. The rate of growth in scientific publication and the decline in coverage provided by Science Citation Index. Scientometrics, 84(3), pp.575–603.
van Leeuwen, T.N., 2008. Strength and weakness of national science systems: A bibliometric analysis through cooperation patterns. Scientometrics, 79(2), pp.389–408.
Leydesdorff, L., 1991. On the “scientometric decline” of British science. One additional graph in reply to Ben Martin. Scientometrics, 20(2), pp.363-367.
Lockamy, A. & McCormack, K., 2010. Analysing risks in supply networks to facilitate outsourcing decisions. International Journal of Production Research, 48(2), pp.593–611. Moed, H.F. et al., 1985. The use of bibliometric data for the measurement of university research performance. Research policy, 14(3), pp.131–149.
Nederhof, A.J., 2007. Policy impact of bibliometric rankings of research performance of departments and individuals in economics. Scientometrics, 74(1), pp.163–174.
Okubo, Y., 1997. Bibliometric Indicators and Analysis of Research Systems. OECD Science,
Technology and Industry Working Papers. Available at:
http://dx.doi.org/10.1787/208277770603.
Pereira, J.C., Bordeaux, R., Zotes, L.P., Lima, G.B. and Quelhas, O.L.G., 2015. Probabilistic risk analysis of safety management system failure and impact on economic performance: the case of jet engine manufacturing. International Journal of Management and Decision Making, 14(4), pp.345-372.
Tang, C.S., 2006. Perspectives in Supply Chain Risk Management: A Review. SSRN Electronic Journal. Available at: http://dx.doi.org/10.2139/ssrn.925274.
Tarjan, R., 1972. Depth-first search and linear graph algorithms. SIAM journal on computing, 1(2), pp.146-160.
Tepić, J., Tanackov, I. & Stojić, G., 2011. ANCIENT LOGISTICS-HISTORICAL TIMELINE AND ETYMOLOGY. Tehnicki vjesnik/Technical Gazette, 18(3).
Vanany, I., Zailani, S. and Pujawan, N., 2009. Supply chain risk management: literature review and future research. IGI Global, pp.16-33.
Van Raan, A.F., 2004. Measuring science. In Handbook of quantitative science and technology research (pp. 19-50). Springer Netherlands.
Braz. J. of Develop.,Curitiba, v. 6, n. 2,p.6440-6463 feb. 2020. ISSN 2525-8761
Wallin, J.A., 2005. Bibliometric methods: pitfalls and possibilities. Basic & clinical pharmacology & toxicology, 97(5), pp.261-275.
Wieland, A. and Marcus Wallenburg, C., 2013. The influence of relational competencies on supply chain resilience: a relational view. International Journal of Physical Distribution & Logistics Management, 43(4), pp.300-320.