MERGERS AND ACQUISITIONS IN THE PORTUGUESE
BANKING SYSTEM – SANTANDER TOTTA CASE
Andreia Filipa Torres Gabriel
Project submitted as partial requirement for the conferral of
Master in Finance
Supervisor:
Prof. Pedro Manuel de Sousa Leite Inácio, ISCTE Business School, Finance Department
i
RESUMO
A atual conjuntura económica combinada com os inúmeros fatores externos a que os bancos estão expostos levam à avaliação de possíveis alternativas estratégicas a implementar. Uma das estratégias a seguir é o aumento da dimensão da estrutura do banco com vista ao reforço da estrutura de capital e aumento da quota de mercado, melhoria de resultados e eliminação de custos redundantes.
A fusão entre o Santander Portugal, Totta & Açores e Crédito Predial Português ocorreu em 2004 e criou o Santander-Totta. Neste período verificaram-se inúmeras restruturações no sistema bancário português, para aumentar a dimensão da estrutura e, consequentemente, incrementar a vantagem competitiva e valor acionista.
Este projeto estuda a fusão dos três bancos comerciais e as motivações, ganhos esperados e criação de valor acionista.
Foram calculadas potenciais sinergias através do Discounted Cash Flow Method numa perspetiva de Equity Cash Flows. Comparando o Valor dos Capitais Próprios da empresa combinada com a avaliação das três instituições financeiras conclui-se que existiram ganhos com a fusão.
De modo a validar os resultados obtidos foi realizada uma Relative Valuation, que permitiu concluir que a avaliação é conservadora face à decorrente dos múltiplos de mercado. Para complementar a análise é avaliada a reação do mercado ao anúncio da fusão, revelando que o mercado já aguardava a fusão.
Com esta reestruturação, o Santander-Totta criou um único banco comercial cujo capital é diretamente gerido por uma holding portuguesa e o Grupo Santander alcançou uma quota de mercado de 11% tornando-se um dos maiores players em Portugal.
Palavras-Chave: Fusões e Aquisições, Sistema Bancário, Sinergias, Equity Cash Flows
ii
ABSTRACT
The current economic environment combined with the innumerous external factors that banks are exposed to lead to the evaluation of possible strategical alternatives to be implemented. One of the strategies that may be followed is the increase of the bank structure in order to reinforce the capital structure and obtain higher market share, improving income and eliminating redundant costs.
The merger between Santander Portugal, Totta & Açores and Crédito Predial Português occurred in 2004 and created Santander-Totta. During this period innumerous restructurings happened in the Portuguese banking system, in order to increase competitive advantage and create value for shareholders.
This project studies the merger of the three commercial banks and the motivations, expected gains and value creation for shareholders.
Potential synergies are computed through the Discounted Cash Flow Method with an Equity Cash Flow approach. By comparing the Equity Value of the combined company with the valuation of the three financial institutions, we conclude the existence of a merger gain. To prove the accuracy of the obtained results a Relative Valuation is also performed, concluding that our valuation is conservative compared to the one derived from the market multiples. To complement the analysis the stock market reaction on the merger announcement is assessed, revealing that the market was already expecting the combination of the banks.
With this restructuration, Santander-Totta created a single commercial bank with its share capital directly held by a Portuguese holding and Santander Group reached 11% market share becoming one of the major players in Portugal.
Key Words: Mergers and Acquisitions, Banking System, Synergies, Equity Cash Flows
iii
ACKNOWLEDGEMENTS
I would like to thank to my Supervisor Pedro Inácio, for all the suggestions, dedication, availability and share of knowledge that contributed to the improvement of my Project. To Professor José Dias Curto, for his help in the empirical part of this Project.
A special thanking to my family and friends for the support and incentives to always do my best.
To my manager and colleagues from KPMG, for listening and supporting me in this final phase of my academic journey.
To Duarte Teixeira, for the constant encouragement in this long journey. For gave me strengths to go forward and to develop this project. For believing in me and supporting me through good and bad times.
Lastly, I would like to thank to Dr. Pedro Fialho, for giving me the opportunity to realize a Mentoring Programme in Santander-Totta that motivated me for choosing this theme.
iv
INDEX
RESUMO I ABSTRACT II ACKNOWLEDGEMENTS III INDEX IV INDEX OF TABLES VIINDEX OF FIGURES VIII
GLOSSARY VIX
1 – INTRODUCTION 1
2 – LITERATURE REVIEW 4
2.1. Motives and Reasons for M&A 4
2.2. Forms of M&A Deals 9
2.3. Types of M&A Deals 10
2.4. Valuation adopted in M&A Deals 10
2.5. Deal Structuring: Methods of Payment 12
2.6. Valuation Methods 17
2.7. Event Studies 23
2.8. Who wins with a merger, acquirer or target firms? 26
3 – CONTEXT OF THE PORTUGUESE MARKET 28
3.1. Evolution of the Portuguese banking system 28
3.2. Portuguese Economic Environment 31
4 – GROUP SANTANDER, TOTTA & AÇORES, CRÉDITO PREDIAL PORTUGUÊS 35
4.1. History of Group Santander 35
4.2. History of Totta & Açores 35
4.3. History of Credito Predial Português 36
4.4. Santander in Portugal 36
4.5. Analysis of the financial institutions involved in the merger 39
5 – DATA AND METHODOLOGIES 44
5.1. Equity Cash Flow Valuation 44
5.2. Relative Valuation Method 46
v
6 – CASE STUDY 48
6.1. Case Study Objectives 48
6.2. Lifecycle of the Merger 48
6.3. Deal structure 51
6.4. Equity Cash Flow Valuation 55
6.5. Economic Value Added 59
6.6. Relative Valuation Method 60
6.7. Stock Market Reaction to the announcement 61
7 – RESULTS OF THE MERGER 66
7.1. Shareholders and Organizational Structure 66
7.2. Business Segments 67 7.3. Shares Behavior 67 7.4. Economic Indicators 67 8 – CONCLUSION 71 9 – BIBLIOGRAPHY 74 10 – ANNEXES 82
vi
INDEX OF TABLES
Table 1 – Earnings Growth Example 7
Table 2 – Cash Offer Example 12
Table 3 – Benefits and Issues of a Cash Offer 13
Table 4 – Benefits and Issues of a Stock Offer 16
Table 5 – Number of Financial Institutions in Portugal from 1983-2002 28
Table 6 – Banking Institutions in June 2004 (before merger of BTA, BSP, CPP) 30
Table 7 – Economic Indicators in Portugal, 2000-2004 31
Table 8 – Credits and Deposits in Portugal, 2003-2004 32
Table 9 – Shareholder Structure of Group Totta 40
Table 10 – Subsidiaries of Group Totta 40
Table 11 – Financial indicators of Group Totta, 2000-2003 42
Table 12 – Capital from the new financial institution Santander-Totta 50
Table 13 – Impact of the spin-off in Totta & Açores 50
Table 14 – Equity Cash Flow to BTA 55
Table 15 – Equity Cash Flow to Santander Portugal 55
Table 16 – Equity Cash Flow to Crédito Predial Português 55
Table 17 – Cost of Equity to Group Totta 55
Table 18 – Residual Value to BTA 56
Table 19 – Residual Value to Santander Portugal 56
Table 20 – Residual Value to Crédito Predial Português 56
Table 21 – Equity Value to BTA 56
Table 22 – Equity Value to Santander Portugal 57
Table 23 – Equity Value to Crédito Predial Português 57
Table 24 – Equity Cash Flow to Santander-Totta 58
Table 25 – Cost of Equity to Santander-Totta 58
Table 26 – Residual Value to Santander-Totta 58
Table 27 – Equity Value to Santander-Totta 58
Table 28 – Synergies of the Merger 59
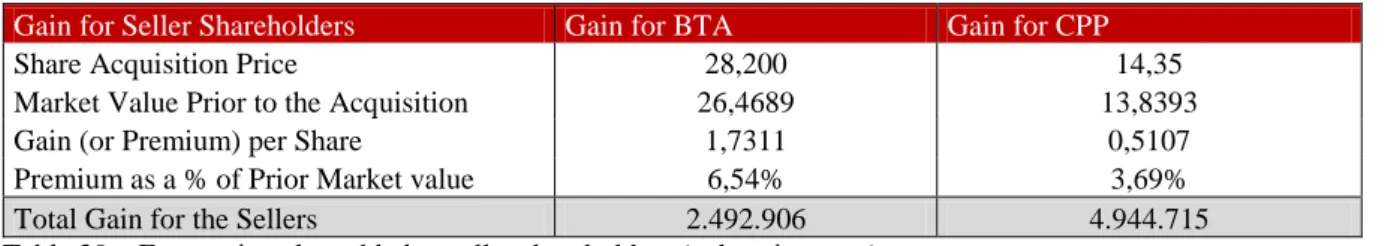
Table 29 – Economic value added to seller shareholders 59
Table 30 – Economic value added to acquirer shareholders 60
Table 31 – Implied Multiples for Santander-Totta 60
vii
Table 33 – Market Multiples of comparable companies 60
Table 34 – Market Capitalization of Santander-Totta through multiples valuation 61
Table 35 – Abnormal and Cumulative Abnormal Returns of BTA, CPP and BSCH at April 7th, 2000 61
Table 36 – Significance Test of the average cumulative returns at event window, in BTA at April 7th 2000 62
Table 37 – Significance Test for the difference between average cumulative returns, in BTA at April 7th, 2000 63
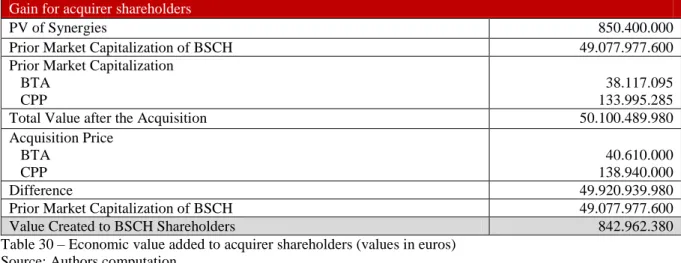
Table 38 – Abnormal and Cumulative Abnormal Returns of BTA and BSCH at January 20thth, 2004 64
Table 39 – Significance Test of the average cumulative returns at event window, in BSCH at January 20th 2004 65
Table 40 – Significance Test for the difference between average cumulative returns, in BSCH at January 20th 2004 65
Table 41 – Shareholder Structure of Santander-Totta 66
Table 42 – Shareholder Structure of Santander-Totta SGPS 66
Table 43 – Financial indicators of Santander-Totta 68
Table 44 – Variations from major financial indicators of Santander-Totta 68
viii
INDEX OF FIGURES
Figure 1 – Estimation Period, Event Window and Event Day of a Short-term
Market Reaction 24
Figure 2 – Evolution of Euribor, in 2004 33
Figure 3 – Evolution of Euro’s exchange rates 34
Figure 4 – Business segments of Group Totta 39
Figure 5 – Shares of BTA between 2000 and 2004 41
Figure 6 – Real Value vs Offered Value, April 18th – December, 31st, 2000, BTA 52
Figure 7 – Real Value vs Offered Value, April 18th – November, 24th, 2000, CPP 53
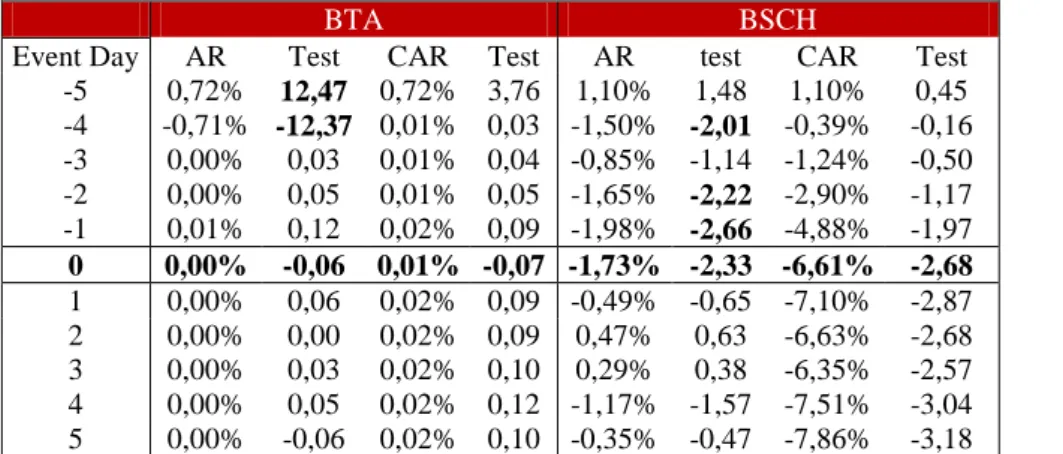
Figure 8 – Organization of Group Santander in Portugal 67
ix
GLOSSARY
APM – Arbitrage Pricing Model AR – Abnormal Return
AAR – Average Abnormal Return BBI – Banco Borges & Irmão
BCI – Banco de Comércio e Indústria BCP – Banco Comercial Português BES – Banco Espírito Santo BFB – Banco Fonsecas & Burnay BFE – Banco Fomento Exterior BL – Beta Levered
BPA – Banco Português do Atlântico BPI – Banco Português de Investimento BPSM – Banco Pinto e Sotto Mayor BSCH – Banco Santander Central Hispano BSNP – Banco Santander Negócios de Portugal BSP – Banco Santander de Portugal
BST – Banco Santander-Totta BTA – Banco Totta & Açores
CAGR – Compounded Annual Growth Rate CAPM – Capital Asset Pricing Model CAR – Cumulative Abnormal Return
CAAR – Cumulative Average Abnormal Return CGD – Caixa Geral de Depósitos
CMVM – Comissão de Mercado de Valores Mobiliários CPP – Crédito Predial Português
CUF – Companhia União Fabril D – Debt
x
E – Equity
EBIT – Earnings before Interest and Taxes
EBITDA – Earnings before Interest Taxes Depreciation and Amortization ECB – European Central Bank
EEC – European Economic Community EPS – Earnings per Share
EV – Enterprise Value
FCFF – Free Cash Flows to the Firm FCFE – Free Cash Flows to Equity GDP – Gross Domestic Product GN – Nominal Growth Rate M&A – Mergers and Acquisitions
NOWC – Net Operating Working Capital NPV – Net Present Value
OLS – Ordinary Least Square Method P/B – Price to Book Value Ratio PER or P/E – Price to Earnings Ratio P/S – Price to Sales Ratio
R&D – Research and Development Rd – Cost of Debt
Re – Cost of Equity Rf – Risk Free rate Rm – Return of Market ROA – Return on Assets ROE – Return on Equity
RONE – Incremental Return on new Equity in the residual period SAN or SAN SM – Group Santander
SGPS – Sociedade Gestora de Participações Sociais WACC – Weighted Average Cost of Capital
1
1. INTRODUCTION
Mergers and Acquisitions can be defined as the combination of companies where the main objective is to have a firm that is more valuable than the sum of its parts (Brealey and Myers, 2003). This business strategy is known as a corporate restructuring instrument that allows a company to take advantage of market opportunities, increasing their results and eliminating redundant costs (Hillier, Ross, Westerfield, Jaffe and Jordan, 2010; Clayman, Fridson and Troughton, 2012).
Some research shows that mergers and acquisitions normally happen in waves (Brealey and Myers, 2003; Koller, Goedhart and Wessecs, 2010). For instance, in Europe this type of restructuring presented a sharp increase with the introduction of Euro (Hillier et al., 2010). In Portugal, the entrance in the European Economic Community (EEC) triggered innumerous restructurings. The internationalization of the economy and the increasing globalization encouraged the creation of legislation that aimed to harmonize European directives with national regulation, allowing a sharp increase of foreign investments that initiated a massive reorganization in the Portuguese economy, especially in the financial sector. The increase of foreign investments contributed to the subsequently privatization of state-owned banks, and 4 of the 7 major financial groups in Portugal decided to consolidate their activity by entering in Mergers and Acquisitions deals.
Group Santander (previously known as “Banco Santander Central Hispano”, BSCH), one of the biggest players in the global financial market, was one of the important foreign banks that invested in Portugal. The presence of BSCH in Portugal started with the acquisition of 10% of “Banco de Comércio e Indústria”, in 1988 (that later led to Santander Portugal). In 1994, BSCH became shareholder of “Banco Totta & Açores” (BTA) through the acquisition of “Banco Banesto”. In 2000, through an agreement with António Champalimaud and the Portuguese state-owned bank Caixa Geral de Depósitos (CGD), BSCH acquired over 90% of BTA and 70% of “Crédito Predial Português” (CPP). On the same year, BSCH launched a public offer of acquisition for the remaining shares of both banks. At the end of 2000, the Spanish group held the majority of ownership in Santander Portugal, Totta & Açores and Crédito Predial Português
The main purpose of this project is to analyze the merger between Santander Portugal, Totta & Açores and Crédito Predial Português, which resulted in the development of the Santarder-Totta
2
brand, in 2004. Hence, the objective is to evaluate what were the merger motivations, calculate the expected gains (synergies) and the value created to shareholders of the new company. In order to accomplish the objectives previously stated, we use three methodologies: the Discounted Cash Flow (DCF) Method within an Equity Cash Flow Approach (to obtain the expected synergies), the Relative Valuation Method (to assess the accuracy of the previous valuation results), and a Stock Reaction analysis to the announcement of the merger (to conclude if there were abnormal returns in the event day).
The motivations to conduct this project are based on two perspectives. At an academic level, the objective is to apply the knowledge and skills acquired throughout the Master’s to new situations of practical interest, assuming the adoption of the appropriate methodologies and strategies to solve a specific problem. At a personal level, the objective is to explore the Corporate Finance area, increasing knowledge in areas of interest such as companies’ valuations and financial industry.
Regarding the structure of the project, we begin in Chapter 2 with the literature review of the main theoretical concepts underlying a M&A transaction, the main methodologies used to value companies (Discounted Cash flow Method and Relative Valuation) and the literature that supports the analysis of a Stock Market Reaction.
In Chapter 3, we analyze the Portuguese banking system and the macroeconomic environment, in order to contextualize the Portuguese scenario and major motivations taking into account the market situation.
Chapter 4 contextualizes the history of Group Santander, Totta & Açores and Crédito Predial Português, the entrance of Group Santander in Portugal, the reorganizations realized until the year of the merger and the analysis of the three financial institutions involved in the merger. In Chapter 5 we present the data and methodologies used to value companies, focusing on a financial institution perspective. It is exposed the DCF Method through an Equity Cash Flow approach for financial institutions, the market multiples P/E and P/B and how the analysis of stock reaction to the announcement should be realized.
In Chapter 6, the case study is presented. We start by analyzing the case study objectives, the lifecycle of the merger, the deal structure from the main events that happened until the final merger in 2004, and the premiums paid at these main events. Afterwards, synergies in the merger are estimated through the valuation of the three commercial banks as separate entities
3
and the comparison with the combined company. After assessing the premiums paid and gains created with the merger, we conclude the analysis with the computation of value creation for the shareholders. In this chapter a Relative Valuation is also performed with the market multiples of financial institutions with similar size and capital structure, as well as a valuation of the stock reaction at the announcement date, for the acquirer and target companies.
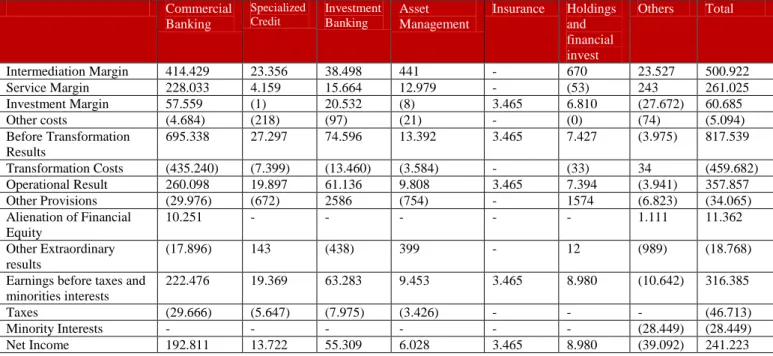
Chapter 7 characterizes the results of the merger and the financial indicators by business segments of Santander-Totta, in order to conclude which contributed the most to the existence of an economic gain.
Finally, the Chapter 8 presents the motivations, the economic and operational gains of the merger and how it can be a solution for some financial institutions that are currently facing some difficulties and are unable to grow in the current market conditions. Some final remarks regarding valuation are also made, namely the 51% valorization of the combined firm which can be considered as conservative when compared with the market value obtained through the median market multiples P/E and P/B, used to assess the likely market value of Santander-Totta. At the end of the chapter we describe the major limitations of the project and where future research should be based.
4
2. LITERATURE REVIEW
In this review, the literature that supports Mergers and Acquisitions Deals (M&A Deals) is exposed.
According to Clayman, Fridson and Troughton (2012: 303) “an acquisition is the purchase of
some portion of one company by another”. This can translate in the purchase of assets, purchase
of a segment from other firm (for example a subsidiary), purchase of some shares or even the purchase of the entire company. “A Merger represents the absorption of one company by
another”, meaning that one of the companies ceases the activity (normally the smaller
company, but there are some exceptions). 2.1. Motives and Reasons for M&A
Mergers and Acquisitions happen for innumerous reasons, where the major objective is creating value to shareholders (Andrade, Mitchell and Stafford, 2001; Alexandridis, Petmezas and Travlos, 2010; Hillier, Ross, Westerfield, Jaffe and Jordan, 2010). Some companies pursue gains with synergies and others earnings growth (Clayman et al., 2012). Diversification might also be a reason and some companies take this decision because their managers have motives to do so (Hillier et al., 2010; Clayman et al., 2012). Taking into consideration all mergers happened so far, it is possible to infer that not all of these motives and reasons transmit better results for the companies (Brealey and Myers, 2003; Hillier et al., 2010).
In the decision of conducting a merger, shareholders, managers and analysts should realize if the motives behind the merger are in line with the financial and operational effects that the merger will bring (Titman and Grinblatt, 2002; Clayman et al., 2012).
2.1.1. Synergies
The existence of synergies is the most frequent justification for the premium that acquirer’s companies’ pay for a target company (Alexandridis et al., 2010; Hillier et al., 2010; Ismail, 2011; Clayman et al., 2012).
Synergies = VAB – (VA + VB) (2.1)
VAB = Whole Company VA = Company A VB = Company B
The creation of synergies happens when the wealth of the whole combined company (after the merger) worth more than the sum of company A and B (Bradley, Desai and Kim, 1988; Hillier et al., 2010). This tell us that the combined firm works more efficiently than the two previously separate firms (Hillier et al., 2010).
5
From the classification realized by Hillier et al. (2010: 787), synergies come from the rise of cash flows, where “the possible sources of synergies fall into four basic categories: Revenues
Enhancement, Cost reduction, Lower Taxes and Lower Capital Requirements”:
∆CF = ∆ Revt − ∆ Costst − ∆ Taxest − ∆ Capital Requirementst (2.2) ∆ Revt = Incremental revenue
∆ Costst = Incremental costs ∆ Taxest = Incremental taxes
∆ Capital Requirements= Incremental new investment required in working capital and fixed assets
Revenue Enhancement is one factor that explains the existence of Synergies. Synergies exist because we get better results in revenues with a combined company than with two separate companies (Hillier et al., 2010, Clayman et al., 2012). This improvement can result of an expanded market share, higher prices due to reduced competition (market or monopoly gains) or even due to strategic benefits (Bradley et al., 1988; Chatterjee and Lubatkin, 1990; Pautler, 2003; Hillier et al., 2010).
Synergies through Cost Reduction are the most common way to achieve it, once mergers and acquisitions normally result in layoff of staff and elimination of excessive resources. According to Clayman et al. (2012: 305) cost reduction is typically reached “through economies of scale
in research and development, procurement, manufacturing, sales and marketing, distribution, and administration”. Other authors also justify the existence of cost reduction through
economies of scope, economies of vertical integration, use of complementary resources, improvement of technologies and elimination of management that act at the expense of shareholders (Bradley et al., 1988; Andrade et al., 2001; Titman and Grinblatt, 2002; Pautler, 2003; Hillier et al., 2010).
Some companies consider a merger because this operation can translate in a Tax Reduction to the firm (Pautler, 2003; Hillier et al., 2010). There are cases where a company decides to acquire another in order to lever tax benefits through unused net operating losses (tax losses), unused debt capacity and use of surplus funds (Hillier et al., 2010).
A profitable acquirer (with significant tax liabilities) can benefit from merging with a target that has accumulated large amounts of tax losses. If the target firm has an unprofitable division, it will have a low tax bill and by merging in the right circumstances, we can offset the income in the acquirer and achieve lower taxes (Titman and Grinblatt, 2002; Hillier et. al 2010; Clayman et al., 2012). However, according to the law, an acquisition is not allowed if the only objective is to avoid tax payments (Hillier et. al 2010; Clayman et al., 2012).
6
It is also possible to have tax gains by unused debt capacity (Bruner, 1988; Hillier et. al 2010). If a firm does not have enough debt that makes marginal costs of financial distress equal to the marginal tax shield, it means that we can put more debt and achieve tax shields without having financial distress (Titman and Grinblatt, 2002; Hillier et al., 2010). Two companies can do this after a merger, if the acquirer has a high level of debt and the target has a low level that allows the acquirer to raise debt in order to create a bigger tax shield (Hillier et al., 2010).
By using surplus funds we can also have tax benefits (Bruner, 1988; Hillier et. al 2010). If a firm has cash flows after paying all taxes and after realizing all projects with positive Net Present Value (NPV), ideally, it should pay dividends or buyback shares (Bruner, 1988; Brealey and Myers, 2003; Hillier et al., 2010; Clayman et al., 2012). However, extra dividends will imply the payment of higher taxes. In other hand, a buyback of shares allows the payment of lower taxes (Brealey and Myers, 2003; Hillier et al., 2010). Nevertheless, this situation is illegal in some countries if a company only uses the repurchase of shares as a strategy to escape from taxes on dividends. In order to avoid higher taxes on dividends, a firm can acquire other firms with its excess of funds. However, this is considerate a bad reason for a merger, since we can buy a portfolio of efficient investments at a lower cost than a company (Hillier et al., 2010). Finally, Lower Capital Requirements in a short and long perspective could happen. Before the merger, the acquirer and target companies had their respective head offices, after that all employees can be reallocated to one of the buildings, enabling the sale of the other, and by its turn, reducing fixed capital needs. If the companies under the merger belong to the same industry, they can combine some divisions, like their R&D or back office operations, allowing the sale of the facilities related to those departments. Finally, with the size increase of a firm, we usually assist to a decrease in the inventory-to-sales and the cash-to-sales ratio. Then, a merger can also contribute to economies of scale, which allows reducing the working capital (Hillier et al., 2010; Clayman et al., 2012).
2.1.2. Earnings Growth
An M&A Deal can create the appearance of synergies or growth that makes investors think that the company worth more than in the reality (Hillier et al., 2010; Clayman et al., 2012).
Most companies with high share value and P/E ratios look for target companies with a market value lower than its book value or with a low PER, in order to increase earnings.
Nevertheless, justifying a merger by the increase of earnings is a bad reason to get into this type of transaction.
7
When we assist to an increase of earnings as a result of a merger, instead of resulting from economic benefits of the combination of companies, it is stated as “bootstrapping earnings” (Clayman et al., 2012). This illusion of earnings growth happen when the buyer company has a P/E ratio higher than the target, and with the merger, the P/E of the buyer does not decrease (Titman and Grinblatt, 2002; Brealey and Myers, 2003; Rappaport, 2006; Mota and Custódio, 2007; Hillier et al., 2010; Clayman et al., 2012).
To better understand this thematic we can look at the following example, exposed by Hillier et al. (2010: 791-792):
Acquirer before merger
Target before merger
Acquirer after the merger
The market is ‘smart’ The market is ‘fooled’
EPS (€) 1 1 1,43 1,43
Price per Share (€) 25 10 25 35,71
PER 25 10 17,5 25
# Shares 100 100 140 140
Total Earnings (€) 100 100 200 200
Total market value (€) 2500 1000 3500 5000
Table 1 – Earnings Growth Example
Source: Hillier, Ross, Westerfield, Jaffe, Jordan, 2010. “Corporate Finance, First European Edition” (p.791-792), McGraw-Hill.
We should notice that the acquirer company has a higher PER (25) than the target (10). At this example, the merger does not generate economic gains (synergies).
In an efficient market, the sum of each company should be equal to the combined company value (2500 + 1000 = 3500). In order to buy the 100 target’s shares, the acquirer firm issue 40 shares (this value is known by dividing the target’s market value, 1000, by the share price of the acquirer, 25). After the merger, the acquirer stays with 140 shares outstanding. The price of each acquirer’s share remains the same (25) (once there were not economic gains) but the earnings per share changes to 1,43 (200/140) and the PER to 17,5 (25/1,43). This value is lower than before the merger, once the target firm presented a PER inferior to the acquirer. This situation represents an efficiently working market, once the share price remains unaffected and the PER decreases.
However, when the buyer company bootstraps earnings to 1,43, there could be circumstances where the market accepts the 43% increase in earnings per share as growth, which contributes to the same PER after the merger (25) (this should not happen once PER is an average of the acquiring high PER and the target low PER. If we are including a division with a lower growth, this value should drop). By applying a PER of 25, the combined firm value will increase to 5000 (25 ∗ 200) and the share price of the acquirer after the merger to 35,71 (5000/140). Once there are not expected synergies or other reasons to contribute to share price increases,
8
this situation should not happen. Nowadays, this does not happen on the market is efficient and reflect all new information, in order to adjust P/E ratios.
2.1.3. Diversification
Martin and Sayrak (2003: 38) agree with Hillier et al. (2010: 793), stating that “diversification,
by itself, cannot produce increases in value”.
Company-level diversification states that a company is handled as a portfolio of investments in other companies (Clayman et al., 2012). We know that diversification can eliminate risk, however, it cannot eliminate systematic risk (once this cannot be eliminated, just reduced) (Chaterjee and Lubatkin, 1990; Hillier et al., 2010). The unsystematic risk can be eliminated with a merger, but in a well-functioning capital market, instead using widely diversified companies, investors can diversify their portfolios more easily and at less expense through the purchase of equity in different companies (Millier 1977; Chaterjee and Lubatkin, 1990; Clayman et al., 2012). Consequently, this is another invalid reason for a merger (Brealey and Myers, 2003; Hillier et al., 2010; Clayman et al., 2012).
According to Hillier et al. (2010: 793), “diversification can produce gains to the acquiring firm
only if one of two things is true”. The first is when diversification reduces unsystematic risk
volatility at a lower cost than making adjustments in personal portfolios. The second situation is when diversification reduces risk and contributes to increases of debt capacity (leading to more tax shields) (Hillier et al., 2010).
2.1.4. Managerial Motives
There are some reasons that take managers to proceed for a merger even if it does not create value to shareholders (Malatesta, 1983; Jensen, 1986; Pautler, 2003, Hillier et al., 2010; Berk and DeMarzo, 2011; Clayman et al., 2012; Park and Jang, 2013).
Starting by acquiring firms’ managers, they may prefer to run a large and powerful company since their salary and prestige is correlated to the size of the firm (Hillier et al., 2010; Berk and DeMarzo, 2011; Clayman et al., 2012). They could enter into a merger to increase firm size and by its turn, collect higher revenues that would contribute to higher compensations (perks), namely, bonuses proportional to the size of the transaction or companies acquired (this is called “empire-building”) (Eilert, 1976; Jensen, 1986; McCabe and Yook, 1997; Hillier et al., 2010; Ismail, 2011; Clayman et al., 2012; Park and Jang, 2013). Even if a merger or acquisition present a negative NPV, managers are disposed to accept this kind of business if there is any benefit or compensation for them (Hillier et al., 2010).
9
Another important point has to do with the existence of a considerable amount of free cash flows (Hillier et al., 2010; Ismail, 2011). After all positive investments are made, managers still have enough money to apply. Since managers are compensated for growth, they have an incentive to apply the excess cash flows in projects with negative NPV, even if it decreases shareholders value (Hillier et al., 2010). On the other hand, if managers receive a significant number of options representing shares of the company, they prefer to give up from mergers with negative NPVs. According to Hillier et. al. (2010: 811) “the acquisitions by firms where
managers receive lots of options create more value than the acquisitions by firms where managers receive few or no options” because in this last situation, managers know that if there
are losses, shareholders are the ones who support them.
Another motive is called “Hubris Hypothesis”, where overconfident managers overvalue target companies but still pursue mergers with low chance to create value, since they believe that their ability to manage is good enough to create value to shareholders (Roll, 1986; Hillier et al., 2010; Berk and DeMarzo, 2011; Ismail, 2011; Graham, Harvey and Puri, 2013). However, this normally results in an overpayment for the target and in wealth transfer from acquirer to target shareholders (Schmitz, 2007: 11). According to studies realized by Berkovitch and Narayanan (1993), this motive result in value destruction for the combined and the acquiring firm (as a stand-alone firm) (referred in Schmitz, 2007: 11).
Managers of target firms also behave in their benefit. In the case of a positive premium, target shareholders will win with takeovers, but if managers know that there is the possibility of being fired after a merger, they will resist to the takeover. If they cannot resist, they will try to negotiate with the acquirer’s firm for a good deal at the cost of the shareholders (Hillier et al., 2010; Clayman et al., 2012).
2.2. Forms of M&A Deals
According to Hillier et al. (2010: 795-796), there are different forms of M&A Deals:
Merger: occurs when two or more companies combines the activity and ownership in a single company. After a merger, the acquiring firm maintains its name while target ceases to exist, since the buyer firm acquires all assets and liabilities.
Consolidation: consists in a merger, except a new legal entity is created (acquiring and target cease to exist).
Acquisition of Shares: results in the purchase of voting shares in return of cash, shares or other securities. This can start as a private offer made by acquiring’s management and progress
10
to a tender offer (public offer to buy shares). It requires the voting from at least 50% of shareholders (Clayman et al., 2012)
Acquisition of Assets: involves the purchase of target’s assets. This does not mean that the target firm ceases to exist, once the acquirer might buy a specific division instead the whole company. By its turn, it is not required the voting from 50% of shareholders, with the exception of asset purchases that totalize over half the company’s value (Clayman et al., 2012).
2.3. Types of M&A Deals
According to Brealey and Myers (2003: 930), there are different types of M&A Deals:
Horizontal Merger/Acquisition: Acquirer and target firms belong to the same industry (they are direct competitors).
Vertical Merger/Acquisition: Acquirer and target perform complementary activities and normally have a buyer-seller relationship (they belong to different phases of the value chain).
Conglomerate Merger/Acquisition: Acquirer and target operate in unrelated industries.
2.4. Valuation adopted in M&A
In this section the phases of a merger valuation are going to be examined, starting by the valuation of the target firm, the existing synergies and finally the acquisition value.
It is important to take into account, though this type of valuation is similar to a project valuation, since the size of a merger is much larger (meaning more impact in financial, strategy and operational structure of a firm) this will undertake more risk of misevaluation (Titman and Grinblatt, 2002).
2.4.1. Value the target as a stand-alone firm
To evaluate the target we should start by estimating future cash flows and appropriate rates for discounting these cash flows (Titman and Grinblatt, 2002; Brealey and Myers, 2003; Kamstra, 2003). In order to forecast target cash flows we should look for historical data and predict the future cash flows for the stipulated time horizon (normally 5 years) (Clayman et al., 2012). This estimation could be realized through the compounded average growth return (CAGR), nominal growth rate, Cash-Flows trends, Revenue Growth, Expected profitability and Return on Equity. If the target firm is publicly traded we can compare the current market share price to our initial valuation (Titman and Grinblatt, 2002; Hillier et al., 2010). When the values are not similar, it means that the assumptions to forecast future cash flows and discount rates are not the most appropriate or that private information which the buyer firm may collect through further
11
analyses of the target’s accounts is not included in share prices, or even, potential merger premiums are already included in share prices (Titman and Grinblatt, 2002; Hillier et al., 2010). However, the acquiring firm cannot rely exclusively on current stock price to compute the company’s value (Titman and Grinblatt, 2002). The buyer firm will offer a premium 1 over the current share price of the target company, which tell us that additional value is created that compensates the acquirer pay a value greater than the target market value (Titman and Grinblatt, 2002; Clayman et al., 2012). The methods used to valuate future cash flows and discount rates are going to be explained in point 2.6 – Valuation Methods.
2.4.2. Value the Synergies
This is the most important phase of the valuation. The acquirer firm must evaluate synergies associated with the combination of the target and acquirer companies in order to realize how much the target is worth for the buying firm and then, estimate future cash flows created with synergies and the corresponding discount rates (Titman and Grinblatt, 2002; Hillier et al., 2010; Ismail, 2011).
The analyst making this valuation should assume that there are synergies which are certain and easier to predict (synergies from tax savings) and others that are risky, (synergies created through sales increases) (Titman and Grinblatt, 2002; Hillier et al., 2010). Besides that, we should have in consideration synergies that affect both firms (for example marketing synergies) and others that only affect the target (for example tax savings synergies). This is important since the cost of capital to use will be different. In the first case we use the weighted average of the two merging organizations, while in the second, the target’s cost of capital. Analysts need to make some assumptions about the gains of the target for the acquirer, namely, increase of revenues resulting from the combination of companies, which makes this phase the most complicated of a merger valuation (Titman and Grinblatt, 2002).
2.4.3. Value the acquisition
This final step can be done by adding the present value of synergies to the discounted target’s cash flows (Titman and Grinblatt, 2002; Hillier et al., 2010; Ismail, 2011). Ideally, the target should be bought if it can be purchased at a total cost lower than the combined value of the merger. Generally, it is paid the value of the target firm plus a premium (Titman and Grinblatt, 2002; Brealey and Myers, 2003). This value paid for the acquisition should be lower than the
1 Premium is the portion of compensation received by target firm’s shareholders. It is a value that is over the pre-merger market value of their shares (Clayman et al. 2012).
12
synergies created, in order to add value to acquiring shareholders (Synergies > Vtarget +
Premium).
2.5. Deal Structuring: Methods of Payment
The acquiring company can use two basic forms in order to buy target company’s shares: Cash and Securities Trade (or a mix of both) (Clayman et al., 2012).
In a cash offering, the acquirer company trades cash for shares of the target company. In this type of transaction, the acquirer offers a premium over the price at which the shares are actually trading, ensuring certain shareholders agree to the sale (Rappaport and Sirower, 1999). The acquirer company can use the company’s assets or can issue new debt to pay to the target firm (McCabe and Yook, 1997; Clayman et al., 2012).
In the securities offering, the most common is using acquirer’s common stock (Clayman et al., 2012). The acquirer firm issues new stock and trades stock from its company for stock of the target company (Rappaport and Sirower, 1999). It might also be offer preferred shares or debt securities (Clayman et al., 2012).
2.5.1. Cash Offer
In a merger situation, one of the first things to think is whether there is an economic gain, meaning that (“(…) firms are worth more together than apart”) (Brealey and Myers, 2003: 939). Taking into consideration the following example, exposed by Hillier et al. (2010: 795-798), we are going to see how a company should compute synergies, premiums and NPV, using cash as a form of payment.
Firm A– acquirer Firm B – target Combined Firm
Market Value 500 100 700
Number of Shares 25 10 -
Price per Share (€) 20 10 -
The board of firm B will sell it if is offered 150 million euros in cash. Table 2 – Cash Offer Example (values in millions of euros)
Source: Hillier, Ross, Westerfield, Jaffe, Jordan, 2010. “Corporate Finance, First European Edition”, McGraw-Hill.
As already mentioned, to compute synergies we should consider the value of the whole firm less the sum of the stand-alone companies.
Synergies = PVAB – (PVA + PVB) (2.3)
Synergies = 700 – (500 + 100) = 100M
This restructuration creates 100 million in synergies. Besides that, we need to consider the cost of acquiring the target company. Once we are considering a cash situation, the cost is equal to the cash payment less the value of the target firm:
13 Cost = 150 – 100 = 50M
As the firm finances the acquisition with cash, the value after the acquisition is given by:
Value of Firm A after acquisition = PVAB – Cash paid (2.5) Value of Firm A after acquisition = 700 − 150 = 550M
Price per Share after acquisition =Value ofA after acquisition
Nr of Shares (2.6)
Price per Share after acquisition = 550 25⁄ = 22€
When the merger contributes to a higher share price for the acquirer company, it means that the merger should be realized (Brealey and Myers, 2003).
The NPV is the acquirer’s gain and is measured by the difference between the synergies and the cost:
NPV = Synergies – Cost (2.7)
NPV = 100 − 50 = 50M
The synergies of 100 million are split between the acquirer (50 million from NPV) and the target (50 million from premium). In the market, the merger announcement should increase the stock value of the target company for 150 million (more 50%, considering the premium paid) and the acquirer value for 550 (more 10%). If the Acquirer’s equity price falls after the announcement, the market will perceive that the merger benefits are doubtful or the acquirer company is paying too much for the target (Rappaport and Sirower, 1999; Brealey and Myers, 2003; Clayman et al., 2012).
Target’s stock price anticipates the Merger
As we are discussing mergers it is important to take into consideration that investors could be expecting the acquirer company (A) to buy the target company (B). This expectation could overstate the stand-alone market value of company B, which means that investors are already incorporating some merger gains in the company’s value right before the announcement (Brealey and Myers, 2003: 939-940). We can see an example in Annex 1.
2.5.1.1. Benefits and Issues of Cash Offer
Benefits Issues
Market price of the acquirer company reacts more favorably to announcements of cash acquisitions (Rappaport and Sirower, 1999; Titman and Grinblatt, 2002).
Cash Offer may signal the market to an undervaluation of shares (Rappaport and Sirower, 1999, Ismail 2011; Titman and Grinblatt, 2002).
14
Benefits Issues
Cash offer may signal that the acquirer can get optimal financing terms in financial institutions (Hillier et al., 2010; Titman and Grinblatt, 2002).
In a Cash Offer, the acquiring shareholders assume the total risk that synergies will incorporate the premium paid to the target (Rappaport and Sirower, 1999; Albuquerque, 2011; Clayman et al., 2012).
Cash offer may indicate management confidence to complete a merger and to create value to shareholders (Rappaport and Sirower, 1999; Clayman e al., 2012).
Borrow funds increases the financial leverage and risk for acquiring firms. Typically, only large companies have cash available (Clayman et al., 2012).
The market interpret high levels of debt as a signal of high quality and future cash flows to the company (Ross, 1977; Park and Jang, 2013)
The target company’s shareholders must pay capital gains in the exceeding between the price paid in the trade and the price paid when they first bought the shares (Rappaport and Sirower, 1999; Brealey and Myers, 2003; Clayman et al., 2012). Cash offer is more favorable to the acquirer in
terms of taxes. Offers the opportunity to revalue assets and increase depreciation expense for tax purposes (Rappaport and Sirower, 1999). Table 3 – Benefits and Issues of a Cash Offer Source: presented with each table entry
2.5.2. Stock Offer
In a stock transaction the acquiring company issues new stock to pay for the target (Rappaport and Sirower, 1999). In this kind of transaction it is the exchange ratio that determines the number of shares that the acquirer should trade for each share of the target company. Exchange ratios are early negotiated for a range of stock prices, to include possible share prices fluctuations (Clayman et al., 2012). However, there could be situations where the company defines the value of the payment in the first place.
Continuing with the last example presented by Hillier et al. (2010: 795-798), two situations are going to be analyzed:
a. Exchange Ratio is already determined: it is equal to 0,75:1
b. Exchange ratio is unknown: we want to pay exactly 150 million euros
Considering the first situation, an exchange ratio of 0,75:1 means that acquirer firm (A) exchanges 7,5 million shares for 10 million shares of target firm (B). To do this, Firm A must issue 7,5 million new shares.
New shares = Exchange Ratio ∗ Number of Target′s Shares (2.8)
New shares = 0,75 ∗ 10 million = 7,5 million
With this issuance, we set a total of 32,5 million Shares (25 million + 7,5 million).
The value paid for the acquirer firm depends on the exchange ratio, outstanding shares of the target company and the value of the stock given to the target shareholders, which will be the
15
value of the acquirer’s firm shares after the announcement (Brealey and Myers, 2003; Hillier et al., 2010; Clayman et al., 2012).
It is very important to emphasize that we should use the price per share of the acquirer firm after the announcement and not the value before the merger (20€), since we need to take into account the synergies that will be created.
To compute the value after the merger announcement, we should consider the value of the combined firm divided by the number of shares (including the issue of new shares):
Share price acquirer after announcement =Value of acquirer+Value of Target+Synergies(Inicial Shares+New issued shares) (2.9)
Share price acquirer after annoucement = 700 (25 + 7,5)⁄ = 21,54 Value Paid = Exchange Ratio ∗ Target company’s Shares ∗
Share price of Acquirer after announcement (2.10)
Value Paid = 0,75 ∗ 10M ∗ 21,54 = 161M Premium = 161M − 100M = 61M
We can conclude that the value paid is higher with the issuance of shares than with the cash payment. The share price of the acquirer firm after the transaction is lower in an equity-to-equity transaction (in the cash transaction we had 22 euros for each share and now we have 21,54 euros), which allow us to conclude that the equity-to-equity transaction is more expensive than the cash operation. According to Brealey and Myers (2003: 942), other way to achieve the premium paid, is through the final ownership of the target firm in the combined firm.
Final Ownership of target in combined = New shares issued
New shares issued+Old shares (2.11)
= 7,5 32,5⁄ = 23%
Gain target = Final ownership of target firm ∗ Value of combined firm – Value of target firm
= 23% ∗ 700M − 100M = 61M (2.12)
Gain acquirer = Final ownership of acquirer firm ∗
Value of combined – Value of acquirer (before merger) (2.13) = (25 32,5⁄ ) ∗ 700 − 500 = 39M
With the analyses of the stock exchange payment we realize that the cost of the merger is affected by merger gains, once synergies are included in the value of the stock given to target shareholders (equation 2.9). While in a cash payment, the cost is known from the start (Brealey and Myers, 2003).
Considering the second situation, from Hillier et al. (2010: 797) example, where equity-holders of company B only receive 150 million euros for the stock transaction. The objective is to find
16
the exchange ratio of an equity-to-equity transaction, considering a fixed payment for the trade of shares. If we only want to give 150 million euros for the shares that target shareholders will own in a combined firm, that worth 700 million euros, we are saying that the proportion of the target shareholders in the combined company is equal to 21,43%:
Value of target shareholders after merger = Proportion of shares in combined ∗
Value of combined (2.14)
150 = Proportion of shares in combined ∗ 700 <=> Proportion of shares in combined = 21,43%
Applying equation 2.11, we can reach to the new shares issued, 6.819 shares.
0,2143 = New shares issued New shares issued + 25
If we continue to assume that the target company had 10 million shares outstanding, we have an exchange ratio of 0,6819:1. With a total number of shares after the merger of 31.819 (25.000 plus 6.819) and a 700 million euros value of the combined firm, we reached a value per share of 22€, the same as we had realized the transaction with cash.
According to Berk and DeMarzo (2011), to have a positive NPV the company should have an Exchange Ratio lower than:
Exchange Ratio <PaPt(1 +TS) (2.15)
Pt – Share Price of Target firm at the time of the announcement Pa – Share Price of Acquirer firm at the time of the announcement T – Pre-Merger Value of Target Firm
S – Synergies
2.5.2.2. Benefits and Issues of Stock oOfer
Benefits Issues
When the market overvalued acquirer’s shares relative to the target, it is better to finance with stock (Clayman et al., 2012).
When a company believes the market is undervaluing its shares, it should not issue new shares to finance an acquisition (Rappaport and Sirower, 1999).
Target company’s shareholders can profit from the potential synergy gains that acquiring shareholders expects to make above and beyond the premium, once they share risk with the acquirer shareholders (Rappaport and Sirower, 1999; Albuquerque, 2011; Clayman et al., 2012)
When the acquiring firm uses stock, managers of the target could realize that the firm is overpriced and ask for higher values (Rappaport and Sirower, 1999; Hillier et.al, 2010)
The investors will also interpret the stock offering as a signal of overvaluation (Ismail, 2011; Clayman et al., 2012; Park and Jang, 2013)
17 Table 4 – Benefits and Issues of a Stock Offer
Source: presented with each table entry
2.6. Valuation Methods
There are many different methods used for companies and analysts to realize a firm valuation. In this review it is going to be explained two of the most used, the Discounted Cash Flow Method and Relative Valuation Method (Koller, Goedhart and Wessecs., 2010; Clayman et al., 2012; Damodaran, 2012)
2.6.1. Discounted Cash Flow Method
According to Koller et al. (2010: 103), the Discounted Cash Flow Method is the most used model to evaluate a project or an M&A Deal “because it relies solely on the flow of cash in and
out of the company rather, than on accounting-based earnings”.
The Discounted Cash flow Method (DCF) estimates the value of a company by discounting the company’s expected future free cash flows to the present (Jennergren, 2008; Koller et al., 2010; Clayman et al., 2012). This model became popular since it is the one that best valuates long term value creation and captures all elements that affect the value of a firm (Yao, Chen and Lin, 2005; Koller et al., 2010).
To evaluate a company we could choose to follow several variations inside this model. The most used is the Two-Stage Model, where we start by constructing a proforma financial statement (Clayman et al., 2012) In the First Stage, we select a time horizon (for example 5 years) where we can accurately estimate the free cash flows through the historical data previously collected and then discount them to the present (Albuquerque, 2011; Clayman et al., 2012). In the second stage, we estimate the free cash flows for a continuing value and then, we discount this residual value to the present (Jennergren, 2008; Clayman et al., 2012). The sum of the present free cash flows from both stages gives us the value that the company is worth in the present, the Enterprise Value of the Company (EV) (Clayman et al., 2012).
Inside DCF Method, there are some methodologies that we can follow: Free Cash Flow to the Firm (FCFF) and Free Cash Flow to Equity (FCFE) (Koller et. al, 2010; Clayman et al., 2012; Damodaran, 2012 ;).
Benefits Issues
Target’s shareholders receive acquirer’s stock without tax payment. Tax liability is deferred until target company’s shareholders sell their new shares (Rappaport and Sirower, 1999; Brealey and Myers, 2003).
The acquisition through the issue of new shares dilute the ownership of existing shareholders in the acquirer firm (Rappaport and Sirower, 1999; Clayman et al., 2012).
18
2.6.1.1. Free Cash Flow to the Firm (FCFF)
In general, the FCFF states that the Enterprise Value of the firm is the sum of the present free cash flows discounted at the Weighted Average Cost of Capital (WACC) (Estridge and Lougee, 2007; Jennergren, 2008; Hillier et al., 2010; Valbom, 2012).
The FCFF represents the available funds to pay to all capital investors in the company (stockholders, Bondholders and preferred stockholders), after all operating expenses and all replacement and/or expansion investments in fixed assets and working capital are made (Brealey and Myers, 2003; Estridge and Lougee, 2007; Mota, Barroso, Nunes and Ferreira, 2010; Clayman et al., 2012; Damodaran, 2012).
This methodology inside the DCF Method is the most used since it is consistent with a constant debt ratio, which is incorporated in the calculation of the discount rate used, and avoids that the debt service and interest paid are considered in the calculation of cash flows (Mota et al. 2010). We can arrive at the FCFF with the following formula (Kaplan and Ruback, 1995; Mota and Custódio, 2007; Michalski, 2008; Damodaran, 2012):
FCFF = EBIT (1 − t) + Depreciation & Amortization – Capex Investments –
− Changes in Net Operational Working Capital Needs (2.16)
Operating Income Less Adjusted Taxes – EBIT(1-t) is the profit that the company has after deducing the costs from the operational activities and after deducting taxes (Koller et al., 2010; Albuquerque, 2011).
EBIT = Revenues – Operating Costs – Depreciation & Amortization (2.17) Depreciation & Amortization are costs that a company has with the investment in assets
(tangible or intangible), over its useful life. This is added back once it is not a disbursed cost (cash expenses) but an accounting expense (Albuquerque, 2011; Damodaran, 2012).
Capex Investments is the investment realized in the purchase of assets with a perspective of long permanency in the company. The company should make these investments to maintain a certain level of activity in terms of assets/fixed capital. We should take back this value once they are cash outflows (Koller et al., 2010; Albuquerque, 2011; Damodaran, 2012).
Net Operating Working Capital Needs is the excess of operating current assets over operating current liabilities. A positive NOWC means that we need to finance our activity. We should consider non-cash working capital once we are interested in cash flow effects (Mesquita, 2009; Damodaran, 2012).
Operating Current Assets = Accounts Receivable + Inventories + Prepaid Expenses (2.18)
Operating Current Liabilities = Accounts Payable + Accrued Expenses + Tax Payable (2.19)
19
To discount the free cash flows we use the weighted average cost of capital (WACC). This is a measure of cost of capital where the company’s components of capital are proportionately weighted (Brealey and Myers, 2003; Mesquita, 2009; Koller et al., 2010; Clayman et al., 2012; Damodaran, 2012). Since in the computation of the FCFF we do not consider the cost of debt we should include both equity and debt costs in the discount rate, in order to realize the total costs that a company supports for additional capital (Mota and Custódio 2007; Koller et al.,2010; Clayman et al., 2012; Valbom, 2012). It is important to emphasize that an increase in WACC translates into a higher risk for the company.
WACC =E+DE ∗ re +E+DD ∗ rd ∗ (1 − t) (2.20)
To compute the WACC we should take into consideration:
Company’s Market Equity (E) and Market Debt (D): The market Equity value is known by multiplying the number of outstanding shares by the market share price of the company (market capitalization) (Kaplan and Ruback, 1995; Koller et al., 2010). By its turn, Market Debt is the value of Long-Term Liabilities of the company, considering that “short term
debt is temporary, seasonal, or incidental financing or if it is offset by holdings of cash and marketable securities”, otherwise we should include short term debt (Brealey and Myers,
2003: 528).
According to Brealey and Myers (2003), we should use market values, once book values could be substantially different from market values. Besides that, according to Koller et al. (2010: 116) “the book value of Debt is a reasonable proxy, unless the probability of default is high or
interest rates have changed dramatically, since the debt was originally issued”.
Cost of Debt (rd) can be known by the Yield to Maturity of the company’s bonds or through the risk free rate (rf) added with the credit spread that the company has attributed (Clayman et al., 2012; Valbom, 2012).
Taxes (t) depend on the “Imposto Sobre o Rendimento Coletivo” (IRC) and the “derrama” (considering the valuation of Portuguese companies).
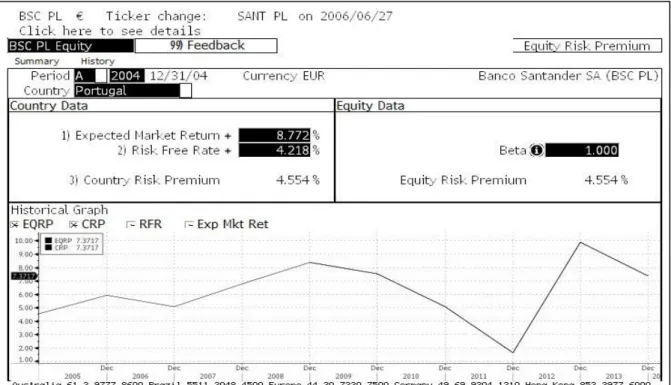
Cost of Equity Capital (re) is the profitability desired by shareholders. In order to estimate it we could take into account the Capital Asset Pricing Model (CAPM) (Jagannathan and
McGrattan, 1995; Koller et al., 2010; Da, Guo and Jagannathan, 2012; Clayman et al., 2012).
There are various models to estimate the cost of capital, such as, Capital Asset Pricing Model (CAPM), Arbitrage Pricing Model (APM), etc. Although, according to Damodaran (2012: 77) “We would argue that a judicious use of the capital asset pricing model, without an over
20 reliance on historical data, is still the most effective way of dealing with risk in valuation in most cases”. The CAPM Model is used to determine the return that investors require for a given
level of risk. The model was created by Sharpe (1964) and developed by Linter (1965) and Mossin (1966) (Albuquerque, 2011; Da et al., 2012).
The CAPM tell us that the expected rate of return on any security is equal to the risk-free rate (rf) added to the beta of the security (BL) times the market risk premium [E(Rm)-rf] (Jagannathan and McGrattan, 1995; Koller et al., 2010; Damodaran, 2012):
E(ri) = rf + Bl [E(rm) − rf)] (2.21)
To arrive at the cost of equity we should compute the following parameters:
The risk free rate (rf) is the rate of return of an investment without risk. We should look for long-term government default-free bonds (Koller et al., 2010). Usually, it is used the 10-year government bond yield.
Beta Leverage (BL) is a measure of the systematic risk of a security. Measures the sensibility of the share price to changes in the market (a stock with a 1,3 beta would rise by 30% if the market rose by 10% and fall by 30% if the market fell by 10%).
The market risk Premium [E(Rm)-rf] is the excess return that expected return on a market portfolio provides over a risk free rate. Until today, it was not defined a model to compute the market risk premium as the most appropriate. According to Koller et al. (2010: 242) we could “(…)measuring and extrapolating historical returns, using regression analysis to link
current market variables (…) and using DCF valuation, along with estimates of return on investment and growth”, but the values range between 4,5% and 5,5% and are similar for
companies within a country.
The Residual Value is the continuing value of the company, where we consider that the cash flows will grow at a steady rate perpetually (Kaplan and Ruback, 1995; Koller et al., 2010; Mota et al., 2010). We take into account the assumption that the company after the time horizon phase reaches a stable point and will have a constant growth (Jennergren, 2008).
Residual Value =Ebit n (1−t)∗(1+gn)−Invested Capital∗gnWACC−gn (2.22) gn is the nominal growth rate. To compute this we should consider the real growth rate of
the economy (greal) and the inflation rate (Kaplan and Ruback, 1995; Koller et al., 2010; Clayman et al., 2012; Damodaran, 2012).
(1+gn)=(1+greal)*(1+inflation) (2.23)
Finally, we arrive at the Enterprise value of a company:
21
According to Mota et al. (2010), the EV measures the entire business value. The Equity Value measures the value of a company’s shares. It is different from Market Capitalization once it includes all equity interests of a company (such as convertible securities, unexercised stock options, etc). The Equity Value is given by (Estridge and Lougee, 2007; Mota et al., 2010):
Equity Value = Enterprise Value – Market Value of Debt + Non −
Operating Assets – Minority Interests (2.25)
If we divide this value by the number of shares outstanding, we have the price target of the company:
Price Target = Equity Value
Nr.of shares outstanding (2.26)
2.6.1.2. Free Cash Flow to Equity (FCFE)
An alternative methodology to the FCFF is the Free Cash Flow to Equity (FCFE) (Mota, et al., 2010). This methodology is based on the cash flow that is available to shareholders, after paying all operating expenses, all replacement and/or expansion investments in fixed assets and working capital are made and after paying debt requirements (Estridge and Lougee, 2007; Koller et al.,2010; Clayman et al., 2012; Damodaran, 2012).
We can arrive at the FCFE by the following formula (Mota et al., 2010):
FCFE = Net Income + Depreciation & Amortization −
Capex Investments – Changes in Net Operating Working Capital Needs + Variation in Debt
(2.27) Net Income is the company’s total earnings (profit of the company) and represents the
accounting measure of the shareholders ‘earnings of the year.
Variation in Debt is the difference between new debt issued and debt repayments (Damodaran, 2012)
The other indicators follow the same assumptions considered in the FCFF Methodology
Differently from the FCFF methodology, the discount rate to use is the Cost of Equity (computed through equation 2.21) (Kaplan and Ruback, 1995):
PV of FCFE = = (1+re)FCFE11+(1+re)FCFE22+ ⋯ + (1+re)FCFEnn+Residual Value(1+re)n (2.28)
The Residual Value can be computed through:
22 Equity Value = PV of FCFE + Cash & Marketable Securities 2 (2.30)
Price Target = Equity Value
Nr.of shares outstanding (2.31)
2.6.2. Relative Valuation Method
This method compares indicators of a company with indicators of similar companies in the market (Kaplan and Ruback, 1995; DePamphilis, 2011; Koller et al., 2010; Clayman et al., 2012). Through this valuation it is possible to compare if the estimated value of a company, through the Discounted Cash Flow Method, is in line with the major competitors and/or with the industry.
In this type of analysis we first need to define a group of comparable companies similar to the company that is being evaluated (similar industry, similar in size and capital structure) in order to compute relative values based on current market prices (Clayman et al., 2012).
Normally this type of valuation is based in company’s Enterprise Multiples, which relates the market value of its debt and equity less cash and investments with other variables (Clayman et al., 2012).
Some examples are:
Enterprise value to Free Cash Flow (EV/FCF)
Enterprise value to EBITDA (EV/EBITDA)
Enterprise value to EBIT (EV/EBIT)
EBITDA multiples are the most used since they do not consider depreciation, that is a noncash expense reflecting sunk costs and not future investment (Koller et al., 2010; Valbom, 2012). Besides these, we can also use Equity Multiples that relates the stock’s market price with other variables, such as:
Price to earnings per share (Market price per share/Earnings per share)
Price to book value per share (Market price per share /Book Value per Share)
Price to Sales per share (Market price per share /Sales per Share)
The type of ratios that should be selected depends on the industry where the company belongs (Liu, Nissim and Thomas, 2002; Clayman et al., 2012). Although price to earnings per share (P/E) is very used, this is misleading by capital structure and non-operating gains and losses (Koller et al., 2010).