Miguel Jorge Raposo Nunes de Andrade
Miguel Jorge Raposo Nunes de Andrade
A Multi-Criteria approach for the design and evaluation
of Demand Responsive Transport (DRT) Services
Orientador:
Professor Dr. Jorge Pinho de Sousa
Dissertação para a obtenção de grau de Mestre em
Métodos Quantitativos Aplicados à Gestão
À minha mãe,
aos meus amigos
Quero expressar a minha especial gratidão à EGP, professores e funcionários, por me terem proporcionado um excelente ambiente de aprendizagem e amizade.
Summary
Demand Responsive Transport services are nowadays an established and recognized way to provide better social inclusion to non-urban, low population density areas. The concept has its origins in the 70's in the USA, but just recently the advances in technology made this type of service more economically attractive. Therefore is of no surprise that this kind of transportation is starting to be a serious option in several regions across Europe.
The European Commission has been promoting projects to study and implement DRT services. One of these projects, MASCARA (deMand responsive trAnsport service for increasing Social Cohesion in urbAn/Rural Areas), involved a team from the Engineering School of the University of Porto, with the participation of the author. The MASCARA project was designed to promote the cooperation between several regions in Europe to share knowledge about DRT services, evaluating DRT pilots and DRT feasibility studies.
This dissertation focus on the design of a framework to help this evaluation. The work resulted in combining two known multi-criteria methodologies, namely AHP and TOPSIS. Albeit these methods were designed to help choosing (ranking) between two or more possible scenarios, the proposed framework is able to evaluate and score one scenario situations.
Sumário
Os chamados Transportes Flexíveis (Demand Responsive Transport), são hoje em dia uma forma estabelecida e reconhecida de combater a exclusão social originada pela falta de transportes em áreas não urbanas, nomeadamente as de baixa densidade populacional. O conceito tem origem nos EUA nos anos 70, mas apenas recentemente, devido aos constantes avanços tecnológicos, é que este tipo de serviço se tornou economicamente atractivo. É portanto sem surpresa que começaram a aparecer projectos de transportes flexíveis um pouco por toda a Europa.
A Comissão Europeia tem também vindo a incentivar projectos para o estudo e implementação de transportes flexíveis. Um destes projectos, MASCARA (deMand responsive trAnsport service for increasing Social Cohesion in urbAn/Rural Areas), contou com a participação de uma equipa da Faculdade de Engenharia da Universidade do Porto, da qual autor fez parte. O projecto MASCARA foi pensado para promover a cooperação entre diferentes regiões da Europa, partilhando conhecimento sobre transportes flexíveis, avaliando projectos piloto e estudos de viabilidade de projectos de transportes flexíveis.
O tema desta dissertação é o desenho de uma metodologia para ajudar à avaliação de projectos de viabilidade e projectos piloto de serviços de transportes flexíveis. O trabalho efectuado resultou na combinação de duas conhecidas metodologias de avaliação multi-critério, nomeadamente AHP e TOPSIS. Apesar destas metodologias terem sido criadas para facilitar a escolha entre dois ou mais cenários possíveis, a metodologia desenhada é capaz de avaliar e classificar situações de apenas um cenário.
Table of Contents
1 Introduction...1
1.1 Context...1
1.2 Problem definition...2
1.3 The stakeholders...5
Mascara Consortium...5
Individual local (site) teams...5
1.4 General approach...6
2 Demand Responsive Transport Services (DRT) – a brief introduction...9
2.1 Introduction to DRT...9
2.2 Literature on DRT...13
3 Evaluation methodologies considered...16
3.1 Literature review on performance evaluation...16
3.2 Literature review on MCDA...17
3.2.1 AHP ...17
3.2.2 ELECTRE...19
3.2.3 PROMETHEE...20
3.2.4 NAIADE...21
3.2.5 TOPSIS...22
3.3 Conclusions and implementation idea...23
4 General evaluation framework...27
4.1 Proposed framework...27
4.2 Practical Implementation ...29
4.2.1 AHP...29
4.2.2 TOPSIS...31
4.2.3 TORNADO Plots...32
4.2.4 What-if analysis and monitoring use...33
4.3 Other possible framework extensions...34
4.4 Implementation summary...35
4.4.1 Methodology caveats...35
4.5 Evaluation framework: global view...37
5.1.1 General principles...38
5.1.2 The evaluation process...39
5.1.3 Global objectives and evaluation model...40
5.1.4 Set-up (phase 1)...41
5.1.5 Data collection and computation (Phase 2)...44
5.2 MASCARA Evaluation procedures and guidelines...48
5.2.1 Objectives and general data requirements...48
5.2.2 Expected results of the evaluation process...48
5.2.3 Relative importance of objectives and criteria...52
5.2.4 Scores ...53
5.2.5 The model representation...53
5.2.6 Criteria...54
5.2.7 Objectives...54
5.2.8 Indicators...55
5.2.9 Process phases and data...55
5.3 Data to be collected by each site...59
5.3.1 Site Description...59
5.3.2 Identification of Stakeholders...60
5.3.3 Identification of Expected Impacts and Indicators for Site Objectives...60
5.3.4 Indicator pool...62
5.3.5 Individual Evaluation Plans...62
5.3.6 Evaluation process results...63
6 Evaluation Tool example use...65
6.1 Guided screenshots...65
6.2 Conclusions on the evaluation tool and further uses...74
1 Introduction
This dissertation is partially about the author's participation in a European Union Project from April 2006 to December 2007. The main theme of the work is the application of multi-criteria decision analysis and decision support algorithms to Demand Responsive Transport (DRT) services. This type of flexible transport services was the global domain of the project, and the innovation of our contribution comes from developing a new approach for the design and evaluation of DRT.
This chapter introduces the context, the problem, and stakeholders. A graphic representation of the problem approach workflow is presented at the end of the chapter. This representation tries to summarize the work done, main phases and findings.
1.1 Context
INTERREG III is an European Union (EU) program designed to strengthen economic and social cohesion in the EU by promoting cross-border (strand A), trans-national (strand B) and inter-regional (strand C) co-operation.
Partially funded by this program, the MASCARA project (deMand responsive trAnsport service for increasing Social Cohesion in urbAn/Rural Areas) in which this work was undertaken, aimed at becoming a vehicle for the promotion and widespread implementation of site-specific collective demand responsive transport services (DRTS) as a key component of social cohesion, sustainable and competitive development in European Regions.
The MASCARA project was a 27-month project (originally planned from 1 April 2005 to 30 June 2007), but later extended to December 2007, under the EU INTERREG IIIC zone West programme and aims to contribute to social cohesion in urban/rural areas through the development of Demand Responsive Transport services (DRT). The project was established to investigate and promote new applications of DRT, which are usually extra to the regular, timetabled Public Transport (PT) services. These services are normally introduced to serve dispersed transportation needs, at off-peak times, between locations not linked by regular PT or where the passengers have more isolated acute needs for transport such as the disabled, the elderly, students, sports/social groups, tourists etc.
Often the service will promise to collect/drop off people from/to certain points within a certain radius of their location/destination, within a certain time range. A typical guarantee might be “We will collect you within half a kilometer from your home and you won’t have to wait for more than 10 minutes.”
DRT services can provide valuable, viable services to the community as was previously demonstrated in the following EU projects: SAMPO, SAMPLUS, VIRGIL, SIPTS, INVETE and FAMS. DRT usually work best as part of an inter-modal service chain, linking people with connections to other forms of transport (train stations, expressway bus services etc.).
The MASCARA Consortium included the Faculty of Engineering of the University of Porto (FEUP). FEUP had the leading responsibility for component 4 of the project, the design and implementation of an evaluation plan for the evaluation of the DRT services within the project.
This included the development of an evaluation methodology, plans and support materials. Such evaluation was applied to the Scottish (Angus), Finnish (Tuusla) and Italian (Florence) demonstrations of DRT, and also to the Hungarian (Gyor) and Irish (Cork) feasibility studies of DRT.
The author participated in this project, specially in the design of an evaluation framework and an evaluation tool (software) to support the evaluation of the several MASCARA cases. The project started in 2005, but the author only joined the team in April 2006. Some work had already been done in this component, but was in need of a revision. The commission was to study the problem, and propose changes and enhancements to the original concepts and approach.
1.2 Problem definition
As previously stated, the main goal of this evaluation framework is the evaluation of the individual project implementation of Demand Responsive Transport Services (DRT) in two different contexts: Feasibility projects, and Demonstration projects. Feasibility projects are essentially focused on the design of the service, considering alternatives within local constraints.
Demonstration projects are focused in validating the service design and finding areas to be improved and/or corrected.
Specifically, the MASCARA consortium was interested in the performance of the services under three main criteria:
• Social Inclusion (SI)
• Sustainable Mobility (SM)
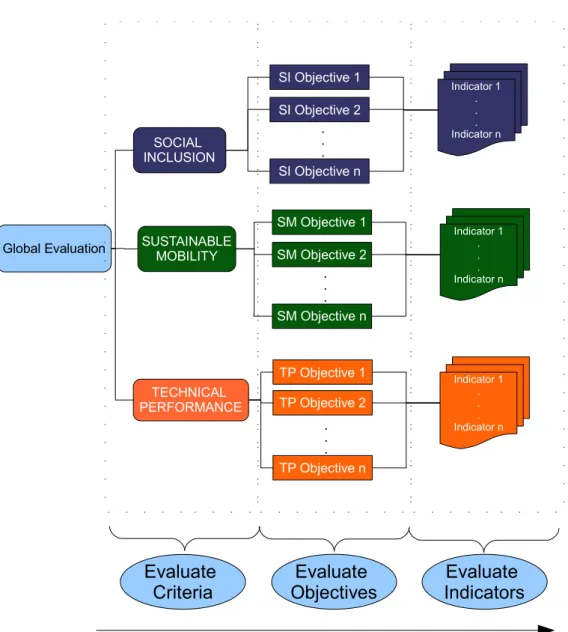
Previous work done in similar DRT projects and the partners experience, suggested a “natural” path to performance evaluation consisting in considering different levels of detail/evaluation, from an aggregated perspective to a higher level of detail. Starting with the three main criteria, objectives were defined within each criteria, then, for each objective, a set of performance indicators was defined to be measured or estimated.
The aggregated values of the set of indicators for each objective will be used to measure of that particular objective performance. Afterwards, the aggregated values for the objectives performance in each criteria will give a measure of the performance for that criterion, and finally, the aggregated values of the three main criteria will yield a global performance result.
Figure 1: Structure of the evaluation process: For each of the main criteria, objectives are defined. For each objective, a set of performance indicators is defined to be measured
Global Evaluation SOCIAL INCLUSION TECHNICAL PERFORMANCE SUSTAINABLE MOBILITY
SI Objective 1
SI Objective 2
SI Objective n
SM Objective 1
SM Objective 2
SM Objective n
TP Objective 1
TP Objective 2
TP Objective n
. . . . . . . . . Indicator 1 . . . Indicator n Indicator 1 . . . Indicator n Indicator 1 . . . Indicator n Evaluate Indicators Evaluate Objectives Evaluate Criteria
As presented, it is clear that the evaluation process proposed can be viewed as a hierarchical multi-criteria problem, of both quantitative and qualitative nature. Furthermore, the discussions about this approach clearly indicated that for each case the criteria were not equally important, and this relative importance between criteria was different from site to site. The same was found true about objectives within criteria: these are different from site to site, and also differ in importance between themselves.
1.3 The stakeholders
Mascara Consortium
The MASCARA partnership includes 7 Transport Operators / Authorities / Universities from 7 European Regions, representing different transport /mobility environments, ranging from large metropolitan areas to small towns in more rural areas. This provided an ideal context for investigating DRT mobility solutions and achieving useful, tangible, results regarding mobility service accessibility.
The partners involved included:
• Faculdade de Engenharia da Universidade do Porto (Portugal)
• Ghent University (Belgium)
• Central Uusimaa Partnership (Finland)
• Angus Transport Forum (Scotland)
• SITA in Florence (Italy)
• Gyor University (Hungary)
• and the Lead Partner: Cork City Council (Ireland)
Individual local (site) teams
The evaluation process has to be adapted to each particular situation, as the studied cases are different in nature (feasibility or demonstration) and in the service design, which depends heavily on local constraints.
Within each project site, local stakeholders have to be considered. They are divided in three main categories:
• Political stakeholders – The DRT services are, to a large extent, dependent on currently adopted policies. DRT schemes often conflict with traditional transport legislation and are in general of a subsidiary nature. It is therefore very important that political stakeholders concerns are addressed in the evaluation.
influence on several aspects of the region where is operated. These aspects are usually reflected on municipalities and regional organisations attributions.
• Operational stakeholders – These are who actually provide the service and know it more intimately, mainly, transport operators.
In the MASCARA consortium, the regional stakeholders were directly represented. It was their job to articulate with political and operational stakeholders, to incorporate their views in the service design.
1.4 General approach
We have two types of evaluation to do: expected performance of newly designed services (feasibility), and actual service implementations (demonstration). Also, the services are very dependant on local constraints, and differ from each other in many aspects. There is only one aspect in common, the “demand responsive” nature of the service, but even here services differ in configuration.
The services to be evaluated are from different regions of the EU with strong socio-cultural differences. The members of the consortium are from quite different cultures and backgrounds, like transports, universities, hired consultancy, municipalities and regional transport organizations.
As referred, the evaluation task is a hierarchical multi-attribute problem, structured in such a way that some guidelines emerged naturally about the design of the evaluation methodology.
This methodology should therefore:
1. be as generic as possible, to be easily adapted to local situations 2. provide mechanisms for evaluation at different levels of detail
3. be made to make it as easy as possible to be understood and applied by a large number of people from different cultures and backgrounds
4. not require elaborate or demanding technology to allow minor practical corrections/changes to be made by local users
5. consider local expert opinions, as opposed to a full automated evaluation
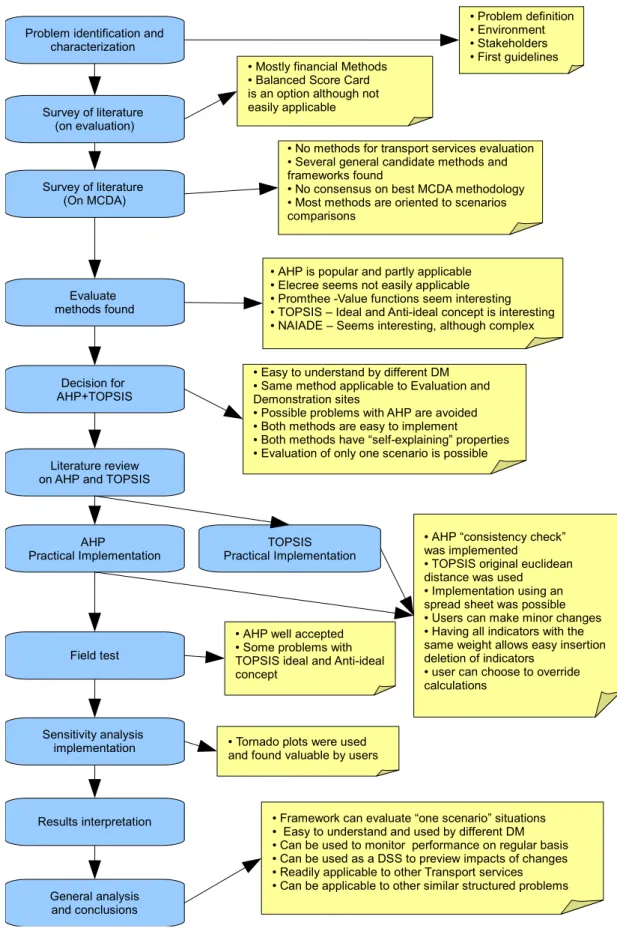
Figure 2: Problem approach workflow (chronological)
Problem identification and characterization
Survey of literature (on evaluation)
Survey of literature (On MCDA) Evaluate methods found Decision for AHP+TOPSIS Literature review on AHP and TOPSIS
AHP Practical Implementation TOPSIS Practical Implementation Field test Sensitivity analysis implementation Results interpretation General analysis and conclusions
● Problem definition ● Environment ● Stakeholders ● First guidelines
● AHP is popular and partly applicable ● Elecree seems not easily applicable ● Promthee -Value functions seem interesting ● TOPSIS – Ideal and Anti-ideal concept is interesting ● NAIADE – Seems interesting, although complex ● Mostly financial Methods
● Balanced Score Card is an option although not easily applicable
● No methods for transport services evaluation ● Several general candidate methods and frameworks found
● No consensus on best MCDA methodology ● Most methods are oriented to scenarios comparisons
● Easy to understand by different DM ● Same method applicable to Evaluation and Demonstration sites
● Possible problems with AHP are avoided ● Both methods are easy to implement
● Both methods have “self-explaining” properties ● Evaluation of only one scenario is possible
● AHP “consistency check” was implemented
● TOPSIS original euclidean distance was used ● Implementation using an spread sheet was possible ● Users can make minor changes ● Having all indicators with the same weight allows easy insertion deletion of indicators
● user can choose to override calculations
● AHP well accepted ● Some problems with TOPSIS ideal and Anti-ideal concept
● Tornado plots were used and found valuable by users
2 Demand Responsive Transport Services (DRT) – a
brief introduction
In order to design an evaluation methodology, it is helpful to fully understand all aspects concerning the object of the evaluation, in this case, Demand Responsive Transport Services (DRTs). This chapter briefly introduces DRTs [1][2] and presents a literature review on this subject.
No methodology to evaluate DRT services was found on this review.
2.1 Introduction to DRT
Conventional transport (bus services) have fixed routes and fixed timetables, and predefined bus stops. Generally, in the countryside we are faced with large geographical areas with low density population. This means buses have to go to every location that it is meant to serve even when no-one wants to travel. This is obviously sub-optimal in an economical sense, leading sooner or later to low frequency transport services, and decreasing even more the number of passengers due to schedule incompatibilities.
Demand Responsive Transport is a more flexible form of transportation that has been devised to try to match the service offer to the passenger needs.
The taxi is perhaps the simplest form of demand responsive transport. You can call it from wherever you are, and takes you to wherever you want to go. It is convenient but generally is not a widely preferred method of transport, as it is generally associated with a premium price.
From the Demand Responsive concept point of view, we can say that fixed route / fixed timetable (same time every day) is the least demand responsive type of transport, and that a private car is the most demand responsive. The DRT services try to provide bus services with some flexibility.
The bus is shared with other passengers with similar requests in a given zone. So, the journey may take longer than a taxi, but the advantages are that the service can be of high quality, almost door to door and be available on a regular basis. Even taxis can be hard to find outside central urban areas.
In addition to this, the computer booking process allows for many more stops to be created, often without any visible sign by the roadside. These do not hold up the bus because it does not have to visit them unless requested. The personal stops can be at or near peoples homes, farms, housing estates or flats and the destinations can be virtually anywhere within a given zone depending on how the scheme is structured. Some buses travel anywhere to anywhere within a zone, while others have some sort of core route from which they deviate.
As well as getting close to door to door travel, booking in itself guarantees better security for the passengers. And, in addition, drivers tend to like the services and enjoy the extra responsibility of seeing that their passengers, many of whom they come to know, are safely returned to home.
Normally DRT services use smaller buses (8 - 25 seats), which are better suited to lower levels of use and can get down narrow, twisting roads and turn round, more easily.
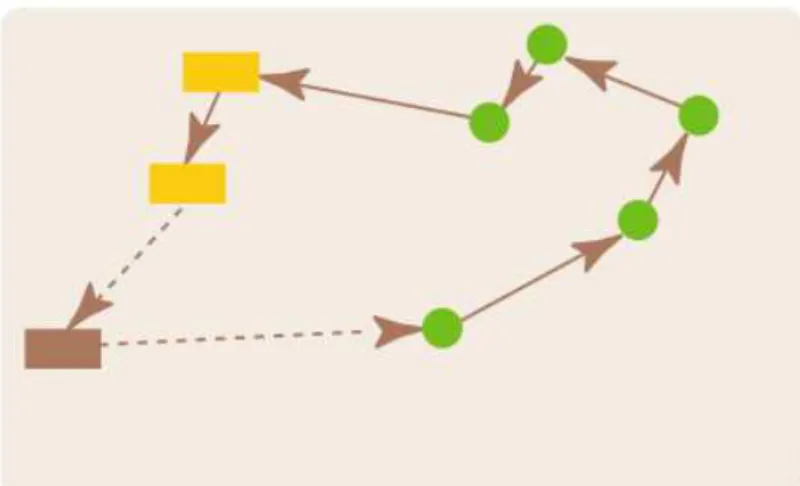
Several DRT route schemes are possible, figures 4 to 10 give an overview of possibilities, following a logic of increasing flexibility:
Figure 4: elements for DRT route schemes
Figure 5: Fixed corridor service (as regular bus but on-demand)
Figure 6: Semi-fixed corridor service
Figure 8: Virtual flexible area service
Figure 9: Single destination, multiple pick-ups. (Social care, community transport, Patient trans-port, Feeder to other main transport services)
Other schemes are possible, especially if we consider the articulation with more conventional transportation.
A DRT service has an enormous potential for improved service to passengers, and they are able to serve a wider area with fewer buses. The way this works can be illustrated as follows:
If someone wants to travel from his/her home, in one part of a given zone, but the bus has been booked to go to another, it may not have time to stretch its route and fit them in on that journey. In this case, the call centre offers the passenger the next available bus journey. On the other hand, if the bus is travelling nearby at the right time, the new passenger is simply added to the existing bus round. There is thus an element of negotiation and rescheduling in creating every route the bus will take. This is the key to increased efficiency.
Dispersed demand is not just a rural phenomenon. Other examples are: low density housing in or around urban centres, night travel in urban or rural areas or getting people to and from stations or long distance bus and coach services.
In transport terms, DRT fills a gap between the normal bus service and the taxi. It may still require financial support, but, in the right area, it can offer better service at the same, sometimes lower, cost.
2.2 Literature on DRT
Demand Responsive Transport (DRT) are nowadays established systems to provide transport on low density population areas, low transport demand areas and to population with special needs. Still, the true potential of DRT, as a contributor to sustainable mobility, has not yet been fully exploited – partly because the necessary supporting frameworks required to deliver more effective and competitive transport solutions are not yet fully understood [3].
In the 1970’s the diffusion of paratransit services in the USA, (transport services designed mainly to provide health related transportation to people with special needs), started the first designs of DRT. In 1975 Ward [4], proposed different methodologies to model simplified variants of a DRT system in order to compare them with conventional bus line networks.
Since then, several papers have been published on various aspects of DRT systems, mainly focusing design, scheduling and routing problems. More recently, technical advances promoted DRT systems to a new level, making them more efficient and cost effective, targeting a wider range of population, and addressing political and social concerns.
These programs resulted in a fair amount of DRT implementations (145 sites in Scotland only, [5] ) and in a considerable research effort.
Fleet size
The required fleet size for a DRT system to meet a given demand level, with a predetermined level of service, has been studied by Arrillaga and Medville [6] (1974), Flushberg and Wilson [7] (1976), Lerman and Wilson [8] (1974), Daganzo [9] (1978) and more recently Diana et al. [10] (2006) using various methodologies. These works are very focused on costs, and therefore related to the economical aspects of a DTR system albeit their main focus is in technical performance.
Technology
Traditionally, DRT systems need to be a subsidized service. It is imperative for agencies to analyze and investigate their current practices, to identify possible cost reductions or productivity improvements. New advances in technology have been driving studies from several perspectives, like management practices [11], system design [12] and scheduling and route computations, where a large amount of research work has been carried out. Two of the latest comprehensive reviews can be found in Savelsbergh and Sol [13] and in Desaulniers et al. [14]
Multi modal transportation
Additionally some work has been done on integrating DRT systems with other public transport systems, where benefits can be found for passengers, although not easily implemented, since they require passenger comprehension and access to an automatic journey planner, and close synchronization for different kinds of transport, in a multi-agent reality [15][16][17][18][19].
European Projects and research
In Europe, an EU sponsored project (SAMPLUS) dealt directly with technology uses in DRT systems, from which an evaluation methodology for technology impacts was defined [20]. Although they conclude that the potential of DRT systems to reduce transport costs is not fully established, some studies outline the potential positive impacts of Advanced Public Transportation Systems (APTS) on productivity and cost [21][22][23][24][25][26][27].
Furthermore new interests beyond costs / economical are recognized, like social inclusion, quality of life, traffic reduction, pollution reduction, etc. These new interests make DRT systems more appealing [28][29].
Best practice guides
DRT knowledge: Halden, D. [30] wrote a guide on How to Plan and Run Flexible and Demand Responsive Transport, a small guide mainly focused on Scotland reality, Brake et al. [3] wrote a “Good practice guide for DRTs using telematics”, OECD Publishing published a book “Improving Transport Accessibility for All, Guide to Good Practice” [31] with a chapter dedicated to the implementation of DTR’s, and (Halden. D. [32]) published a “Review of Demand Responsive Transport in Scotland” in which common problems and elements of success are reported. These works are important contributions to the design of a comprehensive framework to implement DRT systems.
DRT services evaluation
3 Evaluation methodologies considered
Performance evaluation is a quite general problem, so, a natural step in looking for an applicable methodology was done by performing a literature survey. Previous literature surveys in this field [33][34] were found in the referenced works and were helpful in this task.
3.1 Literature review on performance evaluation
Evaluation of anything implies essentially two steps: some kind of measure of some kind of parameters, followed by some kind of comparison of these measures to other known/expected values.
The evaluation problem, can be easily summarized: - What to measure (and how)
- What to compare the measure to (and how)
Generally a derived problem arises from solving these first two questions; - How to interpret results.
A comprehensive literature survey, lead to the following main findings:
1. Performance evaluation is traditionally achieved by measuring indicators of financial nature [34] or by measuring opinions by use of surveys.
2. The vast majority of performance evaluations is done against predefined objectives, or by comparison with well known results.
3. Recently, evaluation objectives are specified in a form of Key Performance Indicators (KPIs), both of financial, and non-financial natures, and their definition is also a field of management research. Balanced Score Card (BSC) methodology is a popular method when evaluating key performance indicators [33][34][35].
4. Objectives are usually of a quantitative form: e.g. Net return, Number of clients served, percentage of market, etc.
Other methods are mostly from “quality management” literature and generally involve statistical tools and comparison with historical values. Some popular examples are QFD (Quality Function Deployment) methods and Six Sigma.
range of different problems [33][35]. Although it would be acceptable to use the BSC methodology to address our evaluation task, we did not consider it as an option, since no ready available, or easily adaptable framework was found in literature that was applicable to transportation services, and it was not clear how to adapt the BSC methodology to the MASCARA concept. Moreover, the project schedule imposed time restrictions that would make this approach a high risk option.
3.2 Literature review on MCDA
The hierarchical nature of the problem immediately suggested the use of an AHP (Analytical Hierarchical Process) [36] or similar ranking algorithms like ELECTRE [37] or PROMETHEE [38] These are well known algorithms and they were well understood by the FEUP MASCARA team. These algorithms are popular in Multi-Criteria Decision Analysis (MCDA)1. These methods are generally used to help
choosing between different alternatives and not for the evaluation of a single instance. In order to assure a better understanding of available options, a literature survey was carried out, resulting on several candidate algorithms and some design ideas.
A previous literature survey on MCDA methodologies [39] was helpful in this process. In the next chapter, a summary analysis of each method considered is presented. This is not a comprehensive list of all MCDA methods, only those that we felt appropriate (to an extent) to the task in hands, are addressed.
In what follows, we summarise this literature review on MCDA methods, analysing the pros and cons of each candidate method considered to the design of the evaluation methodology. As referred, this is not a comprehensive review (see [39]) but rather focused on the project objectives.
3.2.1 AHP
General description
The Analytic Hierarchy Process (AHP), is a popular decision making process to help the Decision Maker (DM) set priorities and make the best decision when both tangible and non-tangible aspects of a decision need to be considered. By reducing complex decisions to a series of one-on-one comparisons, then synthesizing the results, AHP not only helps decision makers arrive at the best decision, but also provides a clear rationale of the choice. AHP can efficiently deal with tangible as well as non-tangible attributes, especially where the subjective judgements of different individuals constitute an important part of the decision process. All comparisons are made in a textual form, (e.g. A is slightly better than B) and then converted for calculation proposes in a number, by use of a correspondence scale
1
consisting if five major degrees (1 3 5 7 9) and four “disambiguation” degrees (2 4 6 8) [40].
Pros
• Most used, well known and generally preferred MCDA method [41][42][43] [44]
• Generally easy to use and well understood by DMs [42]
• Probably the most studied MCDA method [41]
• The method generates a descriptive memory of the decision process. That is, for a third party it would be easy to understand the thought process of the DM [40]
Cons
• The method can easily yield a unmanageable number of pair-wise comparisons of attributes and alternatives [40]
• The DM can introduce inconsistency in the analysis [45][46]
• It can surfer from Rank Reversal (RR), i.e. ranking of alternatives can change apparently without reason, e.g. by removing an alternative, the ranking of the remaining alternatives might change. This can be also observed by adding an irrelevant alternative [47]
• Use of arbitrary scales. Empirical research has found “... the perceived meaning of the verbal expressions varies from one subject to the next...” [48]. This means that the process used to compute numerical values is not universal
• A recent paper by Pérez et al (2006) [49] concludes that, priorities changes and also the RR phenomenon (on hierarchies with four or more levels), can also be observed by introducing an indifferent criterion.
Analysis
3.2.2 ELECTRE
General description
The ELECTRE method was introduced by Benayoun et al in 1966 [50]. The method is based on an outranking concept by using a pairwise comparison of alternatives under each of the appropriate criteria. There are several extensions (ELECTRE IS, II, III-IV, TRI) based on the same principle, but tuned for more specific problems. The DM can indicate indifference about two alternatives under a particular criterion or even that he/she is not able to formulate a judgement. Thus the outranking relations may be complete or incomplete. The method also includes a veto concept, where some (discordant) measure over (or under) a certain threshold can, on its own, exert a veto on an entire outranking relationship.
Pros
• Its a well known method
• It has been successfully applied to a wide range of problems
• It does not require a complete description of preferences
• The concept of out-ranking is easily understandable
Cons
• The method is not multi-attribute by nature, although could be adapted to our case
• Can suffer from rank reversal problem [51]
• Requires that the DM sets preference and indifference thresholds to criteria. This requires that the DM has a good understanding of the criteria and attribute values
• Method is most useful when deciding between many alternatives with few criteria [52] which is not our case
• The method can lead to inconclusive findings about alternatives
Analysis
The outranking nature of this method makes it not readily applicable to our evaluation problem. Our problem has a fair number of criteria (objectives and attributes), and few alternatives, the opposite situation to where this method is best suited.
The possibility of use to the evaluation of one scenario, (no alternative scenarios) is not clear.
3.2.3 PROMETHEE
General description
The PROMETHEE [38] methodology for ranking alternatives is based on the same principles as ELECTRE type methods. It provides a partial ranking of the alternatives (focusing on the best alternative) based on preference aggregation. Pairwise alternatives are compared based on (P) preference, (I) indifference or (R) incompatibility. There are also other versions (II, III, IV), PROMETHEE II provides a total preorder of the alternatives. The PROMETHEE method introduces thresholds in the preparatory phase of criteria definition. Some amount of subjectivity is involved, especially in setting preference thresholds, using a set of predefined utility functions.
Pros:
• Both qualitative and quantitative data can be addressed and data can be used in their own units
• It is a well known method and has been successfully applied to many practical problems
Cons:
• The way in which preference information is processed is rather complicated and difficult to explain to non-experts
• Can suffer from rank reversal problem
• Requires a direct assignment of weights to criteria, which can be a difficult process, and can also constitute a method shortcoming [53]
Analysis
For the many aspects of the analysis it is the same as for the ELECTRE method, since both methods have the same conceptual basis.
The concept of value functions on the criteria definition phase is interesting, but it is not a strong requirement in our evaluation task.
3.2.4 NAIADE
General description
NAIADE (Novel Approach to Imprecise Assessment and Decision Environments) is a discrete multi-criteria method developed by Munda [54], whose impact (or evaluation) matrix may include either crisp, stochastic or fuzzy measurements of the performance of an alternative with respect to an evaluation criterion.
A peculiarity of NAIADE is the use of conflict analysis procedures to be integrated with the multi-criteria results. NAIADE can give the following information:
• Ranking of the alternatives according to the set of evaluation criteria (i.e. technical compromise solution/s)
• Indications of the distance of the positions of the various interest groups (i.e. possibilities of convergence of interests or coalition formations)
• Ranking of the alternatives according to actors impacts or preferences (social compromise solution).
The whole NAIADE procedure can be divided into four main steps: • Pairwise comparison of alternatives according to each criterion • Aggregation of all criteria
• Ranking of alternatives • Social conflict analysis
Pros
• NAIADE is designed with contributions from several other known methods, and in this sense, is more a framework than a method by itself. It is specially appropriate for the evaluation (assessment) of ill-defined or imprecise scenarios, considering different groups of stakeholders (eventually with conflicting interests). These characteristics seem appropriate to the evaluation of DRT services, especially for feasibility scenarios.
• The method addresses social conflict analysis, which could be important to the design of DRT services and political endorsement. No other methodology was found with this characteristic.
• It uses similar mathematical approaches to other known MCDA methods, and it's fairly easy to understand to MCDA practitioners.
Cons
• It is a rather new methodology, with a low number of references in literature, mostly the work of the original author, Munda
• It is an elaborate and demanding method, consisting in several interaction steps and analysis with the DM
• Of all methods considered, it is the most technological demanding, although implementation seems feasible.
Analysis
The novelty of this approach is probably the reason for its lack of literature references. It would be hard to implement, due to its complexity, although feasible since it is based on well known methods. It is the only method which specifically addresses social conflict, and this is seen as a general desirable feature on DRT feasibility studies. In the MASCARA feasibility projects, this was not a strong issue mainly due to contingency reasons, but the social conflict aspect of transport service design was recognised by the consortium as an important issue to address.
3.2.5 TOPSIS
General description
The Technique for Order Preference by Similarity to Ideal Solution (TOPSIS), proposed in 1981 by Hwang [55], is based on the idea that the most preferred alternative should be at the shortest distance from the ideal solution and at the longest distance from the negative ideal solution. This method is quite unique in this approach, although it shares a starting base with ELECTRE methods.
Pros
• The TOPSIS approach, using the concept of ideal solution but also the concept of anti-ideal solution, fits almost perfect our need for evaluating “one scenario” situations. For this, only a conceptual change to the algorithm is necessary, i.e. instead of using the “best of the set” for the ideal value and “worst of the set” for the anti-ideal value, we can use “best we can expect” and “worst we can expect” respectively.
• It uses direct input of attribute values on their own units and scales. This is of great importance when dealing with several attributes of different nature or when there is a need to frequently change, add or remove attributes.
Cons
• Requires direct input for attribute weights. This is generally against field best practices of not asking the weights to the decision manager in a direct manner [53].
• It assumes all attribute values have a monotonic behaviour between the indicator value and it's goodness, e.g. the higher the better (or worst). Situations where this cannot be assumed can be easily foreseen, and special treatment would become necessary.
• The method by it self does not provide any form of hierarchical evaluation.
• TOPSIS can also suffer from the rank reversal problem [47].
Analysis
The TOPSIS was the only considered method that was somewhat readily applicable to our “one scenario” evaluation requirement. It has some good characteristics of great value to our case, in particular the intuitive nature of the method become highly important, when targeting a use by a broad range of stakeholders, to which the methodology must be explained. The method does not fit the hierarchical aspects of our evaluation necessity.
3.3 Conclusions and implementation idea
A common aspect of all the MCDA methods reviewed, is that are all orientated to choosing (ranking) from different scenarios. This immediately poses a problem to our evaluation task, that is, how to evaluate a one scenario situation?
A first idea was to construct a fictional “average” scenario and try to compare the proposed (expected) service against this one. In the same line of thought, it could be easier to construct a fictional “ideal” scenario, based on best possible results, and compare the (expected) proposed scenario with this one.
Even if the methodology provided a numerical evaluation of the proposed scenario against the fictional one (ideal or average), it would always be relative. For example, one could find that some scenario was far from ideal, but what does that distance mean? Is it a very bad, simply bad or an acceptable situation?
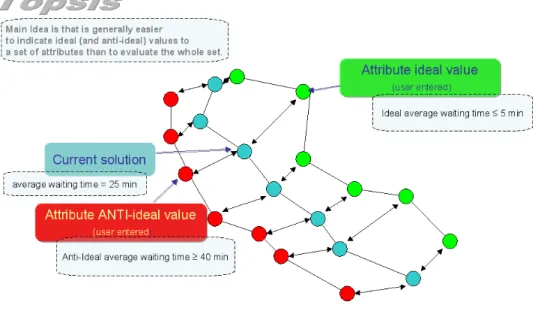
The TOPSIS approach
ask what is the very best and the very worst it can do.
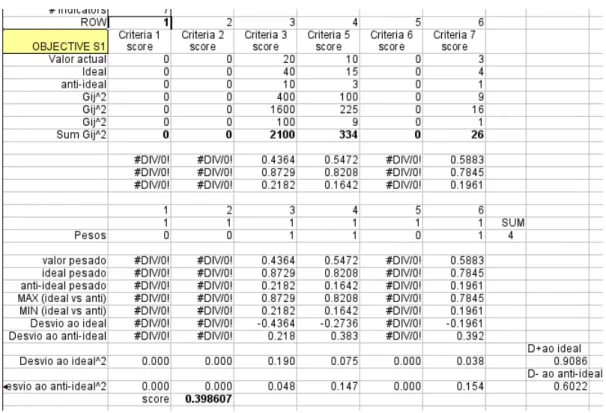
Using this process, we have a way to aggregate a set of indicator values into an objective score. Figure 11 illustrates the TOPSIS scoring of a set of indicators.
For each indicator, current, ideal and anti-ideal values can be expressed in their natural units, (e.g. min., km, Euro, etc.) which are normalised later. This largely facilitates the data input. For the group (set) of indicators, The TOPSIS algorithm computes a score based on the group distance to the “anti-ideal” scenario (farther the better) and on the group distance to the “ideal” scenario (closest the better).
If we use a textual rating scale (like AHP) with a numerical correspondence, (i.e. very bad – 1 ;bad – 2; acceptable – 3 , good – 4; very good – 5) where the score 1 would be assigned to the “anti-ideal” scenario and 5 to the “ideal” scenario, it would be straightforward to compute a score (1-5, absolute ranking position) for that particular set of indicators.
By using this simple TOPSIS approach, we have a way to compute an objective score. We now need a way to repeat this aggregation process for the criteria, and for the global score.
This is a somewhat trivial task, achieved by multiplying the previously found objective score by its importance weight within the criterion.
Example
Criterion “Technical Performance” with further specification of objectives:
Technical performance
Objectives Weight % Score [1..5]
System speed 15 3
System failure 20 4
System accuracy/ reliability 15 3
System acceptance 30 2
Telecommunications 20 5
Table 1: Objective weights and scores (scores found by TOPSIS) for a specific criterion example
In this example, the “Technical Performance” criterion score would be: 0.15×30.2×40.15×30.3×20.2×5=3.3
The same logic can be used to aggregate all the criteria scores into one global score. We have now an idea for a method to address our evaluation problem: we ask the DM (who could use the opinions of technical people) to find ideal and anti-ideal values for each indicator to be measured, specifying that “ideal” means the “best we can hope for” and “anti-ideal” “worst we could do” for the particular situation. This will allow us to evaluate one or more scenarios, based on the same ideal and anti-ideal fictional scenarios.
AHP approach
We can now concentrate on finding the weights for the objectives and criteria. Of course, these weights could be asked directly, but the AHP method already provides a simple way of finding criterion weights, and it can be used in a hierarchical multi-level way. Since we are proposing the AHP method to find criterion weights only, most of the methodology caveats are avoided.
This particular use of the AHP is not new, and there are several references in the literature to this application including in combination with the TOPSIS method [40] [42][58][59][60][56][61][62].
4 General evaluation framework
4.1 Proposed framework
The evaluation framework presented in this dissertation, consists essentially in two steps. In a first step, a conceptual work is done, by specifying clear objectives for each criterion. These objectives should reflect each site specific situation, and they are expected to be different from site to site, although knowledge of other location objectives could be valuable and used.
First step - finding criteria and objective weights
In this phase, The AHP method is used to measure criteria and objectives relative importance resulting in a weighted sum. We use a five point scale for pairwise comparisons between criteria (and objectives) namely,
A is “Equally important” than B
A is “Slightly moderately more important” than B A is “Strongly more important” than B
A is “Very strongly more important” than B A is “Extremely more important” than B
Table 2: AHP textual comparisons
For each textual comparison, the Saaty [36] correspondence scale is used, respectively (1 3 5 7 9). The correspondence is done automatically and is not presented to the user. We feel that keeping a textual description has an important informative value, which could be lost if the user was asked directly for the correspondence.
Our methodology deviates from Saaty's slightly as we chose not to present the user (DM) with the disambiguation scale (corresponding to values 2, 4 6 and 8). The main reason to do this was to follow the guidelines (see section 1.4) and keep the methodology as simple as possible. It would add unnecessary complications and the necessity for “fine tuning” in this area was not felt in the field. The disambiguation scale could always be inserted if needed at some point. Research in other fields also indicate that a five level scale is a “good” safe number of levels when considering several different stakeholders [63].
methodology known problems, but still some remain of concern. Since we are working with stakeholders from different cultures and backgrounds, the textual scale used can introduce some differences of interpretation [48], so we opted to show the calculated weights as a result of the AHP process. The DM is then given a chance to review, accept or change the weights directly.
Second step - evaluation of a set of indicators
In a second step of the evaluation process, sets of (measurable) indicators are defined for each objective. Then, for each indicator, ideal and anti-ideal values are entered. This allows the TOPSIS method to compute a score for each set of indicators (objective score), which are then aggregated into criteria scores and finally into a global evaluation score.
Due to the different nature of the projects we need to evaluate, a special attention to the definition of indicators is needed. For the feasibility cases, sometimes there was no clear idea of what value to expect from an indicator. A classification of indicators was designed to capture this information. An indicator could be:
• M – Measured
• EL – Estimated based on Local knowledge
• EO – Estimated based on Other sites experience
• G – Set as Goal.
The indicator could also assume a textual form, in case there was a need to “contextualise” a set. These textual indicators obviously cannot be considered on computations. The user is also given the opportunity of choosing which indicators will be used in TOPSIS algorithm, so that less confidence indicators could be left out if desirable.
Due to the possibility of a fair amount of uncertainty about indicator values, the framework uses the TOPSIS only as an aid. The computed score is shown to the DM and then he/she has a chance to accept it by entering the same score on a side-by-side column, or correct it by entering a new score. In case of correction, a short explanation is expected. In any case, if the expert evaluation differs substantially from the calculated value, it would most certainly indicate a judgement error, or that the particular set of indicators is ill-defined for that particular objective.
4.2 Practical Implementation
4.2.1 AHP
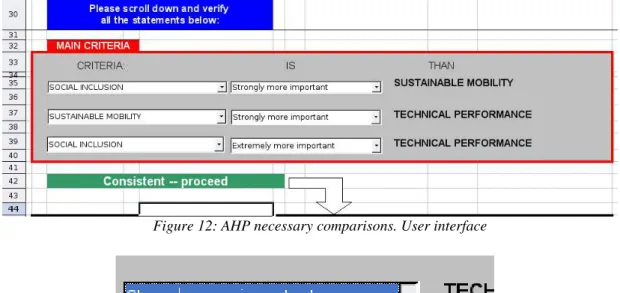
As previously mentioned, we chose to use textual comparisons directly. This was achieved by constructing an interface where, by the use of a “drop-down” widget, the user could input all the necessary comparisons. This is illustrated in Figures 12 and 13:
For each possible pair, the user selects which comparisons better describe the situation. In the first “drop down” the user can reverse the two criteria, e.g. for the first comparison, the user can chose “Sustainable Mobility” on the first drop down, and the second criterion would change to “Social inclusion”
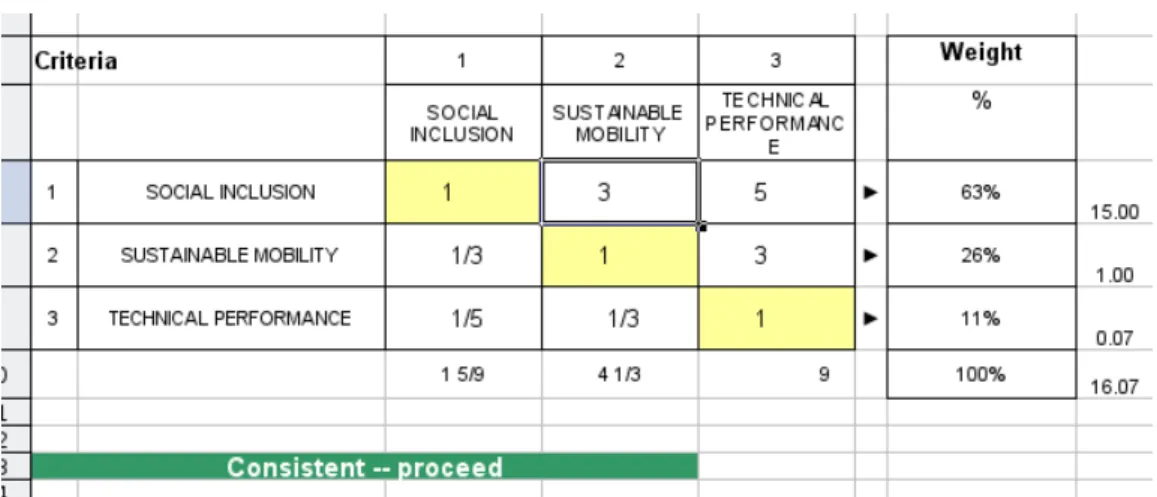
Based on these choices, an AHP matrix is evaluated instantly. This is done without user intervention, but can be checked. (See Figure 14).
Figure 13: Levels are chosen by a "drop-down" widget. Criteria can be reversed by choosing the alternative in the first drop down
Consistency ratio
Also, a consistency value is computed and immediately shown. This is to help avoiding inconsistencies in the user choices, e.g. A>B, B>C, C>A. Values shown can be “Consistent - proceed”, “Marginally consistent” and “Inconsistent – Review”. The AHP methodology allows some degree of inconsistency in user choices. The computation for this occurs in the same sheet previously shown. Figure 15 illustrates this.
Practical implementation
The AHP method calls for the computation of the matrix eigenvector. We used a known approximation to this, by first normalising each column (i.e. divide each entry by its column total) and then computing the average values of row i in the normalised matrix which is the estimate for the weight I.
For the consistency computation we used Saaty proposed method using a reference table for random index [64].
Figure 14: Computation of weights. Usually not seen by users.
4.2.2 TOPSIS
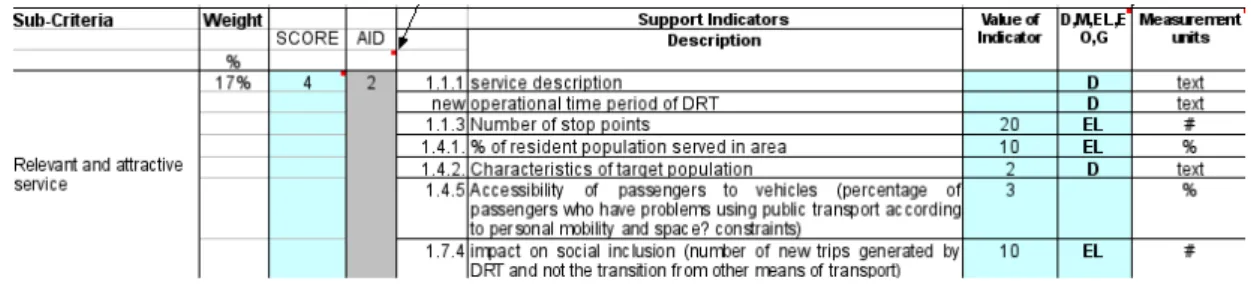
The data for the TOPSIS computation was entered in a sheet dedicated to objectives and indicators. Figure 16 and 17 illustrate the interface.
In these figures some of the indicators are of “text” kind (text not shown). These are used to better describe a particular situation. The computed value (2.0) can only take into consideration the numerical indicators. As stated, this is just an aid. The user must accept this value explicitly or enter a different one and, in this last case, provide some explanation.
The TOPSIS computation occurs automatically without user intervention, but, as in the AHP case, the computation process can bee inspected in another sheet.
The TOPSIS calculations are straightforward and easily accomplished using standard spreadsheet functions [52]. These calculations are represented in figure 18.
Figure 16: Indicator descriptions and values. Columns continue to next figure
In this figure the computed value is 0.398607 which is in a [0,1] scale. When multiplied by 5 and rounded to the first decimal place, we get 2.0. Also note that text indicators produce some errors (#DIV/0! warnings), these are detected using an error finding function (ISERR) and not taken into calculations.
4.2.3 TORNADO Plots
Tornado plots were at first introduced as a methodology add-on possibility, focusing on sensitivity analysis. It was soon recognised that this was trivial to obtain and of great informative value. We have then decided to include these plots as part of a technical analysis report on each site individual set-ups.
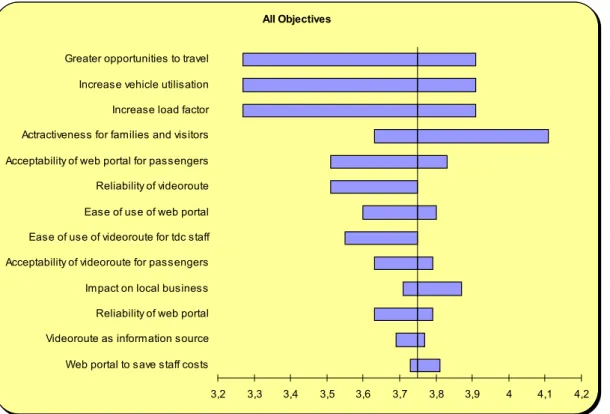
Figure 19 shows a real application example. In this case, the impact on the global score by variations to objective scores is analysed. The plot presents the objectives ordered by sensitivity degree (most sensitive at top, least at bottom). The plot is constructed by varying one objective within the allowed range of variation keeping all other values constant, and then measuring the impact on a dependant function. For the three topmost objectives, we can see that each one is capable of varying the global score from approx 3.2 to 3.9. The fourth objective (attractiveness for families and visitors) is capable on its own to raise global score above 4 to approx. 4.1.
Other type of plots possible, e.g. measuring the solution robustness to the weights assigned to each objective, impacts of indicators on criteria, etc.
Figure 19: Example Tornado Plot. Shows how the final score would change by varying objective val-ues. The chart orders from top to bottom the most sensitive objective to the least sensitive.
Tornado plots provide a very intuitive picture of sensitivity analysis, without the need of elaborated explanations, which make their use a valuable management decision tool. First we considered doing sensitivity analysis “in-house” and only publishing conclusions on a technical report, but the value of this kind of representations and the fact they could be easily implemented on an software spreadsheet, lead us to incorporate them on the evaluation tool in predefined forms. Note that although informative, Tornado plots by themselves do avoid dispense a closer look at the data. In fact, the technical/sensitivity analysis done for each site revealed interesting aspects that could not be found by a more “automated” procedure, e.g. the use of the same indicator(s) for more than one objective, would amplify the changes effect, and this should be considered as it is not reflected on the plots, which are drawn for one objective at a time.
Tornado plots are quite popular, and there are freely available on the Internet several spreadsheets and spreadsheet add-ins that implement the necessary functionality to produce these graphics. We can also find general instructions on how to implement this functionality ourselves [65] .
4.2.4 What-if analysis and monitoring use
The evaluation tool implemented in framework can be readily used to perform “what-if” analysis. The DM formulates an hypothesis, and find what would change
All Objectives
3,2 3,3 3,4 3,5 3,6 3,7 3,8 3,9 4 4,1 4,2 Greater opportunities to travel
in terms of indicators (or criteria/objective weights) and proceeds to remove/insert indicators, and/or correct indicator values. The global/criteria/objective scores for each change are calculated immediately.
Another natural use for the tool is to monitor a particular service implementation, by measuring the chosen indicators at regular time intervals. A simpler use could be just to measure the most sensible indicators. Collecting data at regular intervals would also provide statistical information that could be used in planning or reacting to changes in the service.
4.3 Other possible framework extensions
The framework development and implementation, led to several ideas to improve the evaluation tool. Some of these ideas were abandoned in light of the framework initial guidelines, mainly conceding to simplicity of use and understanding. Yet some ideas were found worth mentioning as extensions to the tool. One of them, Tornado plots on sensitivity analysis, was actually implemented.
Indicator weights and value functions
By design, the framework does not take into account different levels of importance at the indicator level. This has the immediate advantage of allowing introducing, changing or removing indicators without any further work. This was found a desirable feature during design and implementation. Yet, it is possible that some particular new situation requires differential weighting on indicators, or that this necessity is found in a fine-tuning future phase, when a particular service is stabilized. The TOPSIS method already considers weighting, so this could be accomplished by direct introduction the indicator weighs, or using some other method to find them.
The TOPSIS method assumes indicators to have a monotonic behaviour. This might not be desirable on some situations. For example, consider the “number of calls to book a trip” a high or an increasing value for this indicator would be considered positive, yet, for some value threshold, it would mean that the system would be overloaded, and an increase would mean that the service could be actually getting worse. Most of these situations could be avoided by carefully choosing the indicators, but it would be interesting to have the possibility of recurring to value functions, e.g. as used by the PROMETHEE methodology.
Veto capability
corresponding objective “Customer service” would be scored as “Bad” even if all other of the remaining indicators had top values.
NAIADE
The NAIADE method provides social conflict analysis capabilities. This would be an interesting addition to the framework. On DRT services implementation there are often conflicting stakeholders, such as other transport operators, non-served population, etc. The DRT have also, in the present, a heavy political component. NAIADE seems promising in addressing issues of this nature. Most of the work done by the proposed framework could be easily reused in the NAIADE approach, and thus providing additional useful information, especially for feasibility studies.
4.4 Implementation summary
After the evaluation of the methodologies available, a decision for a framework resulted in a choice of a mix solution using AHP and TOPSIS. Main advantages seen were:
AHP and TOPSIS are very well known methods and generally well accepted and understood by the DM.
AHP has several caveats, but they have been well identified, and mostly avoided in our implementation.
TOPSIS ideal and anti-ideal concept provided a way to evaluate single scenario cases, and a flexible and easy way to add / remove /change indicators, which is a common situation.
Both methods use simple algebra and therefore can be easily implemented in a spreadsheet.
4.4.1 Methodology caveats
Our proposed framework naturally inherits the problems from the underlying methods. Some were avoided by design, some remain and the concept also creates new problematic areas of its own. Next we list these areas of concern.
1. Users can easily choose to use direct input of weights. This should be avoided as the textual comparison are lost and these are most informative, specially to people not directly involved. Users tend to know their problem very well and therefore might see no immediate advantage in using the AHP method. Some explaining and persuasion might be necessary.
implementation, but a situation where this might arrive can be easily foreseen.
3. Numerical indicators are expected to be monotonic. If this should not be the case, the indicator value must be evaluated by other means and its value converted to be used, e.g. in a [1-5] scale.
4. Information is lost in each aggregation. The effect of this loss of information cannot be easily defined. Extra caution is necessary when comparing close values. Also by using a broad evaluation scale as “very bad” to “very good”, attention is needed as some values can be in a frontier situation.
5. The proposed framework was designed with a decision support objective and as a result, all computations can be overridden. This is generally accepted as a “good” characteristic, but, when analysing the results from the evaluation process, one should pay special attention to any overridden computations and look into the reasons for this action.
4.5 E
val
u
ati
on
f
ra
m
ew
or
k
: gl
ob
al
vi
ew
P
age
37
Objectives (site specific)
TOP level relative importance
(Sustained Mobility, Social Inclusion, Technical performance)
Evaluation Process
(bottom-up)
Final Score
(Very good, good, acceptable, bad, very bad)
1
2
3
Add-ons: Sensitivity analysis, cost analysis. Technical decision area
Local political decision area
National/Regional political decision area
4
Add-ons: Veto
INDICATORS
(technical characterization)
5 Evaluation Plan
A global evaluation plan was written for the MASCARA consortium. This work has important contributions from all members of the FEUP MASCARA team. The author participated in this work actively, but without any special attribution. This Evaluation Plan explains the methodology and how to use it, and it goes further in defining how to obtain indicators measures. This plan reused material from a previous EU DRT project (SUNRISE). This prior project was successful in defining a pool of indicators applicable to DRT services and a set of questionnaires (and methodology) to help obtaining indicators values. After the consortium agreement on the global evaluation plan, individual evaluation plans where drawn for each site, detailing site specific objectives indicators and questionnaires. This plan summarises the evaluation framework and addresses the practical nature of the necessary work. The last sections of this chapter present a generic guide to the evaluation process. Following this work, the sites then comment on their own evaluation results, producing an “Individual Evaluation Report”. Next section presents the fundamental structure and contents of this document. The evaluation methodology is presented addressing its practical implementation.
5.1 MASCARA evaluation approach
This section provides a description of the evaluation methodology designed for the MASCARA project, and its application to the project sites.
DRT services can be designed along a large set of possibilities (both in terms of operational policies as well as transportation means or booking and management procedures) and with a varied number of goals. This means that direct, straightforward comparisons between sites are in general difficult to carry out. Nevertheless this work showed that the developed approach (based on a structured way of organizing and managing information) has a considerable potential in comparatively analysing different cases specially in supporting the assessment and selection of alternatives for the services.
5.1.1 General principles
This evaluation framework was developed for assessing both DRT services already in operation and feasibility projects for DRT services. This methodology explicitly considers the complexity of the processes and the existence of multiple actors and perspectives. For the data collection, some of the work developed in another EU project on DRT – Project SUNRISE (CohéSion sociale dans les zones UrbaiNes/Rurales basée sur services collectifs de mobilité InnovateurS et durablEs)2
functionality, and a set of questionnaires to help gathering this data.
The evaluation is structured along the concepts of high level criteria, objectives, and indicators, reflecting a hierarchical perspective, involving the multiple process stakeholders, and supporting problem structuring and decision-making at different levels, from the more operational to the strategic, political level.
Common to all sites, there are 3 high level criteria – Social Inclusion, Sustainable Mobility, and Technical Performance – which are the pillars of the approach.
Each high level criterion is composed by a set of partial objectives.
Within each objective, a set of indicators were chosen to measure the performance of that particular objective. Sites could design their own indicators or choose from a “pool” of predefined “best practice” indicators, even if with adaptations. This latter option had the advantage of reusing previous work since the methodology and the questionnaires for collecting data were already defined. In particular, indicators from SUNRISE (Deliverable 4 - Common Evaluation Plan: Methodology and Annexes) have been revised and used.
This created a general analysis framework that is basically the same for all the situations, but can be tuned by the selection or addition of specific objectives and indicators.
The approach is supported by an integrated Decision Support System specially developed for this purpose and based on a rather elaborated spreadsheet. The tool (and the evaluation methodology) proved to be flexible enough to be used across DRT scenarios largely different from each other.
As a basic step of this approach, the different sites (both for the demonstration and feasibility studies) have been carefully characterized, their main requirements, expectations and constraints identified, and their general objectives clarified. This work has clearly highlighted an important number of specific features and perspectives in the different sites, but has also shown a large number of common aspects.
In what follows, we will use some summary tables as examples of the main “objectives” chosen by sites for each higher level “criterion”. In these tables there are “weights” and “scores” for the objectives.
The weights are assigned by the analysts according to the relative contributions of the objectives towards the fulfilment of each criterion.
Each score is an evaluation on the performance for each criterion or some particular objective. This score is in the [1..5] interval, 1 being a “bad” or poor achievement and 5 an “excellent” performance. The scores ultimately result from measuring the values of indicators (in demonstration sites) or from estimating their values (for feasibility studies).
5.1.2 The evaluation process