* Corresponding author E-mail: [email protected]
29
Efficiency of Neural Networks for Estimating the Patch Load Resistance
of Plate Girders with a Focus on Uncertainties in Material and
Geometrical Properties
Shahabian, F.1* ,Elachachi, S.M.2 and Breysse, D.3
1
Associate Professor, Civil Engineering Department, Faculty of Engineering, Ferdowsi University of Mashhad, Mashhad, Iran.
2
Professor, University of Bordeaux1, I2M-GCE, 33405 Talence, France. 3
Professor, University of Bordeaux1, I2M-GCE, 33405 Talence, France.
Received: 03 Mar. 2012; Revised: 13 Jan. 2013; Accepted: 07 Mar. 2013
ABSTRACT: In this paper, a sensitivity analysis of artificial neural networks (NNs) is presented and employed for estimating the patch load resistance of plate girders subjected to patch loading. To evaluate the accuracy of the proposed NN model, the results are compared with the previously proposed empirical models, so that we can estimate the resistance of plate girders subjected to patch loading. The empirical models are calibrated, for improving the formulae, with experimental data set which was collected from the corresponding literature. NNs models are later trained and validated through using the existing experimental data. In this process several NNs architectures are taken into account. A set of good NNs models are selected and then analyzed regarding their robustness when confronted with the test data set and regarding their ability to reproduce the effect of uncertainty on the data. A sensitivity analysis is conducted herein in order to investigate the effect of variability in material and geometrical properties of plate girders. Thereafter, several estimates measuring the efficiency and the quality of the NN model and the calibrated models are obtained and discussed.
Keywords: Neural Networks, Patch Loading, Plate Girder, Sensitivity Analysis,Variability.
INTRODUCTION
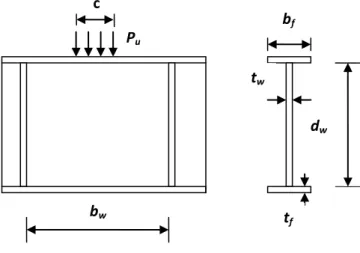
Webs of rolled and built-up beam and plate girders can be subjected to local in-plane compressive patch loads. Examples that could be mentioned are wheel loads, loads from purlins, and roller loads during construction. The type of loading under investigation, in this paper, is shown in Figure 1.
The behavior of plate girders under the patch loads shows complex stability and
30 Johansson, 2003; Cevik, 2007), and numerical methods such as non-linear finite element (Granath and Lagerqvist, 1999; Chacon et al., 2009), have been used to model the problem, they still contain errors when compared to the experimental results.
Over the past two decades, a different prediction method which is based on neural networks (NNs), has gained popularity and has been used by many researchers for a variety of engineering applications. However, to the knowledge of the researcher, only a limited number of researches have been conducted on the patch load resistance of plate girders. Fonseca et al. (2003) presented a parametric study in which he made use of a NN system to forecast the patch load resistance of plate girders. In another paper, they presented a neuro-fuzzy system which was developed to predict and classify the behavior of steel beam web panels subjected to concentrated loads (Fonseca et al., 2008). Gozelbey et al. (2006) considered the use of neural networks to predict the web crippling strength of cold-formed steel decks. They also percold-formed extensive parametric studies and presented them graphically to examine the effect of the geometric and mechanical properties on the web crippling strength.
Most of the studies concluded that NNs are capable of providing accurate results,
especially when the structural behavior and the associated changes in material and geometrical properties were simulated numerically and were error-free. However, it must be noted that in practice, uncertainties in the finite element (FE) model parameters and modeling errors are inevitable. It also seems impossible to avoid the errors of measurement in the measured data; such errors are normally used as testing data in a NN model. Since the efficiency of a NN prediction relies on the accuracy of both components, the existence of these uncertainties may result in false and inaccurate NNs predictions (Bakhary et al., 2007). Therefore, the impact of uncertainties on the reliability of NNs models for the patch loading resistance needs to be analyzed.
One of the primary objectives of this study is to evaluate the accuracy of NNs models in order to estimate the resistance of plate girder webs subjected to patch loading. To evaluate the accuracy of the proposed NN model, the results are compared with some empirical models that have been proposed in the past to estimate the resistance of plate girders subjected to patch loading. The empirical models are calibrated for improving the formulae with an experimental data set collected from the literature.
Fig. 1. Patch loading and girder dimensions. tw
dw
bw t
f
Pu
bf
31 The experimental results collected from the literature are used to train and evaluate the quality of the NN model and the empirical models. As the first step of this investigation, the calibration factors are computed to improve the accuracy of the empirical models for estimating the patch load resistance of plate girders on the full training data set. The NNs models undergo a special trial. The reason is that, herein, the focus is not on a given NN model which may have been identified as "the best one" at the end of a random iterative process. On the contrary, a population of "good NNs models" will be selected and its quality will be evaluated.
In order to gain a better insight into the influence of the important parameters variation on the patch load resistance of plate girders, this paper presents a sensitivity analysis that takes into consideration the effect of changing material and geometrical properties of the plate girders on the performance of the models.
For sensitivity analysis two approaches are taken in this paper. The first approach to evaluate the performance of the models is the probabilistic sensitivity analysis. For this purpose, material and geometrical properties of the plate girders are supposed to be uncertain and to have Gaussian or Log-normal distributions. Additionally, Monte Carlo simulation is used to generate the uncertain variables. The models are compared in this probabilistic framework. In the deterministic analysis, as the second approach, the sensitivity analysis of the models is performed through changing the web thickness at a time near the web thickness of the test girders. The efficiency of the NNs for sensitivity (reliability) analysis is then investigated.
PATCH LOADING
The Empirical Patch Loading Resistance Models
As a result of extensive theoretical and experimental investigations, (Roberts and Rockey, 1979; Kutmanova and Skaloud, 1992; Markovic and Hajdin, 1992; Roberts and Newark, 1997; Gozzi, 2007; Lagerqvist and Johansson, 1996; Graciano and Johansson, 2003; Cevik, 2007), it has been observed that the patch load resistance of plate girders (Pu) may depend on the web
thickness (tw), web depth (dw), web width
(bw), flange thickness (tf), flange width (bf),
load length (c), Young's modulus (E), web yield stress, (w) and flange yield stress (f ). However, recent studies conducted by Chacón et al. (2010), demonstrate that the flange yield stress (f ) does not play a mechanical role in the resistance to patch loading.
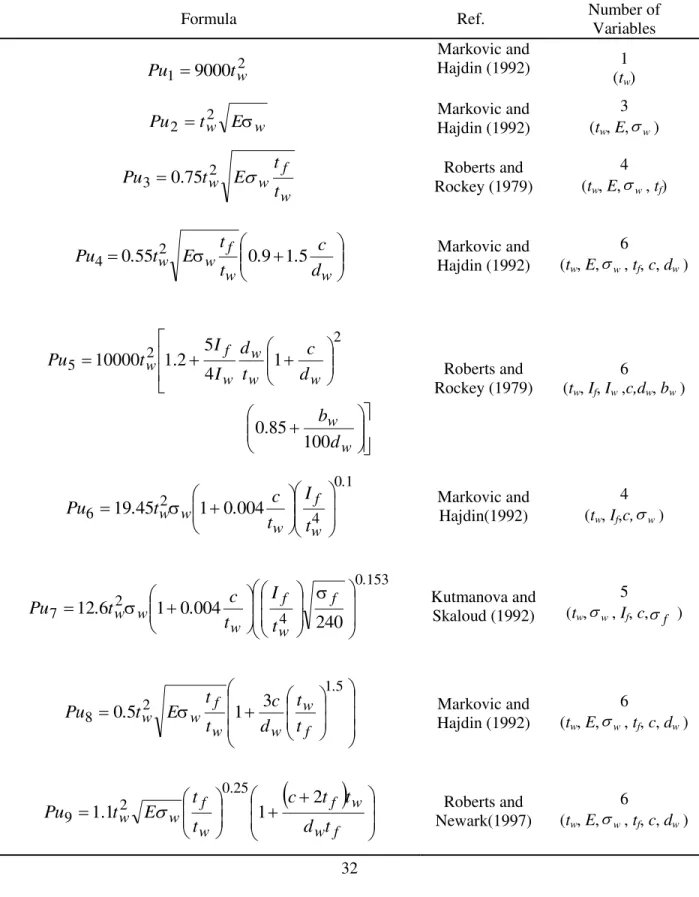
To even further predict the resistance of plate girders subjected to patch loading, a number of differentempirical models have been proposed. This provides the relationships for nine models, outlined in Table 1.
The complexity of relationships presented in Table 1 is variable, because the number of parameters varies from 1 (model 1) to 6 (models 4, 5, 8 and 9). It can be expected that the higher the number of parameters, the better the model's ability to fit the experimental data set. However, the "practical cost", due to the necessity of identifying input parameters, as well as the sensitivity to uncertainty, also depends on the number of parameters.
32 them in stochastic analysis. The neural network system was trained with a collection of experimental results that were obtained by
Roberts and Newark (1997). The geometry of cross-section variables of the tested girders is shown in Figure 1.
Table 1. Empirical models for patch load resistance of plate girders.
Formula Ref. Number of
Variables Markovic and
Hajdin (1992) 1
(tw) Markovic and
Hajdin (1992)
3 (tw, E, )
w f w w t t E t
Pu3 0.75 2 Roberts and
Rockey (1979)
4 (tw, E, , tf)
Markovic and Hajdin (1992)
6
(tw, E, , tf, c, dw )
w w w w w w f w d b d c t d I I t Pu 100 85 . 0 1 4 5 2 . 1 10000 2 2
5 Roberts and
Rockey (1979)
6
(tw, If, Iw ,c,dw, bw )
Markovic and Hajdin(1992)
4 (tw, If,c, )
Kutmanova and Skaloud (1992)
5
(tw, , If, c, )
Markovic and Hajdin (1992)
6
(tw, E, , tf, c, dw )
f w w f w f w w t d t t c t t E tPu 1.1 1 2
25 . 0 2 9 Roberts and Newark(1997) 6
(tw, E, , tf, c, dw ) 2
1 9000tw Pu
w
w E
t
Pu2 2
w w w w f w w d c . . t t E t .
Pu4 0552 09 15
w 1 0 4 2
6 1945 1 0004
. w f w w w t I t c . t .
Pu
w 153 0 4 2 7 240 004 0 1 6 12 . f w f w w w t I t c . t .
Pu
w
f
33 For the sake of the comparison of the NN model with the empirical models, from the total of 116 tests, 20 tests were kept as the test data set on which the predictive ability of the identified model was tested, and 96 tests were used for calibration of the empirical models. In addition, for the NNs models, from the 96 tests, 76 were used for training and 20 were used for validating the models, as it is usually done by NNs users.
Examination of the Empirical Models The cost/efficiency of the empirical models has been studied in details by several researchers (Shahabian et al., 2013). For the sake of being concise, in the current study, it was decided to check only three models (# 1, # 3, # 9), with 1, 4 and 6 parameters for comparison with the NN model, respectively. The other six models have the same type of response as these first three. It seems necessary to note that model # 9 has been identified to be the most accurate of all empirical models.
In calculating the theoretical patch load resistance of plate girders, determined in accordance with the selected empirical models, the mean of Young's modulus E has been taken as 205 GPa. For each modelj (j =1, 3, 9) and each experiment i (i = 1, 2, …,
20), the ratio is calculated.
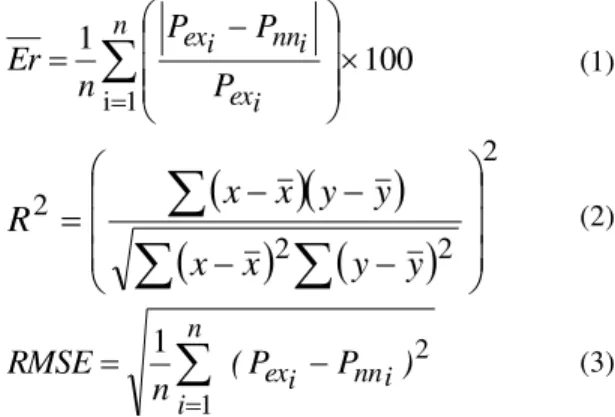
In order to further assess the accuracy of the empirical models, arithmetic mean m, standard deviation s, average relative error , Eq. (1), R-squared value R2, Eq. (2), and root mean square error RMSE, Eq. (3), are computed for each model. The results are presented in Table 2.
100 1 1 i
n i ex i nn i ex P P P n Er (1)
2 2 2 2
y y x x y y x x R (2) 2 1 1 ) P P ( nRMSE exi nni
n i
(3)where n = number of experiments, which in this case is 20.
Arithmetic mean is a measure of the bias of each model towards underestimating or overestimating. Values larger than one represent a tendency to overestimate the patch load resistance and values smaller than one correspond to a tendency to underestimate the patch load resistance.
Table 2. Statistical parameters of the NN model and the empirical models.
Model ratio
Original Models Calibrated Models NN Model
Arithmetic Mean(m) 0.85 0.98 1.09 1.01 1.04 1.04 1.03
Standard Deviation (s) 0.18 0.19 0.16 0.22 0.20 0.15 0.11
(%) Eq. (1) 17 15 14 19 16 13 9
R-squared value (R2) 0.81 0.90 0.92 0.81 0.90 0.92 0.96
RMSE Eq. (2) (kN) 20.03 14.28 16.14 16.43 16.28 13.60 8.28
i ex P i , j u P rj,i
Er ex u P P 1 ex u P P 3 ex u P P 9 ex cal u P P1
ex cal u
P P3
ex cal u
P P9
ex nn
P P
34 The results presented in Table 2 (original models, columns 2 to 4) indicate that the model with the m = 1.09, s = 0.16, = 12%, R2 = 0.92 and RMSE = 16.14 predicts the patch load resistance of plate girders with more accuracy than the other models. However, this comparison tells us nothing about the safety that results from the choice of one specific model.
MODEL CALIBRATION
Because most of the models that were developed in the original studies were based on a limited range of experimental conditions, the coefficients in the models may not be the optimal values for a more extended data set (Rattanapitikon, 2007; McCabe et al., 2005). Therefore, the errors in Table 2 may not be taken as factors to judge the applicability of the selected models. The coefficients in all models should be calibrated before comparing the applicability of the models.
The linear regression model can be written as follows:
u cal cal
u k P
P (4)
where is the calibrated patch load
resistance model, is the existing patch
load resistance model, and is the calibration factor.
Calibration can be carried out by using
arithmetic mean ) m k
( cal 1 for each
model. The data were used to calibrate the models through using a simple multiplying factor. From a total of 116 tests, 96 tests were used for model calibration and the remaining ones were used as the test data set.
The above option leads to very similar results. For the calibrated models, arithmetic
mean, standard deviation, average relative error, R-squared value and root mean square error are computed and shown in Table 2.
The results can be summarized as follows:
(a) After calibration, the accuracy of model # 9 has been improved.
(b) The overall accuracy of the calibrated models in a descending order is the models 9, 3 and 1. This order is the inverse of that of the number of parameters.
(c) Considering the overall accuracy of all models in Table 3, it can be concluded that most of the calibrated models can be used for practical purposes. However, less error is more desirable. Thus, the model that gives the best prediction (with
Er of 13%) is model 9.
NEURAL NETWORK MODELING
Architecture of Neural Networks
Neural networks are commonly classified by their network topology (i.e., feedback, feedforward), and learning or training algorithms (i.e., Supervised, Unsupervised). For example, a multilayer feedforward neural network with backpropagation indicates the architecture and the learning algorithm of the neural network.
In this study, multilayer perceptrons (MLP) with backpropagation (BP) are used. The reason for choosing these is mainly due to their adaptive structure and the efficient learning algorithms nowadays available (Lanzi, 2004).
Optimal NN Model Selection
The performance of a NN model mostly depends on the network architecture and parameter settings. One of the most difficult tasks in NNs studies is to find this optimal network architecture which is based on determining the numbers of the optimal layers and neurons in the hidden layers
9 u
P Er
cal u
P
u P
cal
35 through a trial and error approach. There is no well defined rule or procedure to obtain an optimal network architecture and
parameter setting where the trial and error method still remains valid. This process is very time consuming.
Table 3. Comparison of NNs models with different architectures.
NNs models
Number of neurons in the first hidden layer
Number of neurons in the second hidden
layer
Mean error of the best ten for validation
data set (%)
2
m
Mean error of the best ten for test
data set (%)
8-1-1 1 - 10.29 10.03
8-2-1 2 - 10.00 11.54
8-3-1 3 - 8.99 11.57
8-4-1 4 - 9.82 15.34
8-5-1 5 - 11.05 15.99
8-6-1 6 - 11.81 18.11
8-7-1 7 - 16.97 25.32
8-8-1 8 - 18.48 22.77
8-9-1 9 - 18.52 22.94
8-10-1 10 - 19.11 25.22
8-1-1-1 1 1 9.69 9.67
8-1-2-1 1 2 9.41 9.97
8-1-3-1 1 3 9.06 9.94
8-1-4-1 1 4 8.76 9.36
8-1-5-1 1 5 9.13 11.33
8-2-1-1 2 1 10.49 13.09
8-2-2-1 2 2 9.76 11.18
8-2-3-1 2 3 10.39 12.92
8-2-4-1 2 4 9.78 11.53
8-2-5-1 2 5 9.57 13.44
8-3-1-1 3 1 9.54 12.89
8-3-2-1 3 2 9.98 12.65
8-3-3-1 3 3 9.30 11.80
8-3-4-1 3 4 10.43 14.93
8-3-5-1 3 5 10.73 15.82
8-4-1-1 4 1 10.19 14.44
8-4-2-1 4 2 10.78 13.45
8-4-3-1 4 3 10.71 17.92
8-4-4-1 4 4 10.41 15.77
8-4-5-1 4 5 15.66 19.29
8-5-1-1 5 1 11.27 14.86
8-5-2-1 5 2 10.82 17.38
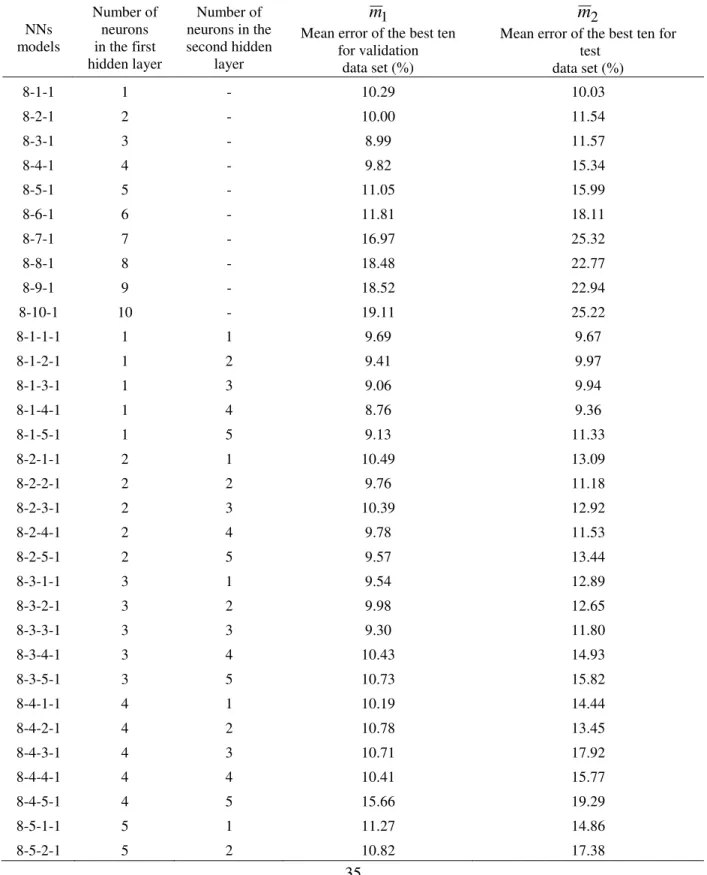
36 The number of neurons in the input layer is equal to the number of input variables, and the number of neurons in the output layer is 1 which returns the patch load resistance of plate girders. The number of hidden layers and the number of neurons in each hidden layer are the key parameters in determining the development of the NN model. Various NNs architectures with 1-2 hidden layers with 1-10 neurons in each hidden layer were tested to compare their efficiency. In this study, Matlab NN toolbox has been utilized for NNs applications. Levenberg-Marquardt backpropagation was used as the network training function that updates weights and bias values for optimization task and a Log-sigmoid function was used as an activation function.
Since the NNs models used in this study are strictly data-driven models, their overall quality in terms of accuracy in interpolation and validity in prediction are highly dependent on the number and the quality of data sets used for training and testing purposes. Generally speaking, to achieve a valid model, the data selected for training must be "representative" of the overall behavior of the input or output data space.
The assignment of initial weights and other related parameters may also influence the performance of the NNs to a great extent. As the initial weights are randomly assigned to each run each time, it considerably changes the performance of the trained NNs, even when all parameters and NNs architecture are kept constant. In fact, if the same process is repeated, it may converge towards different NNs configurations. The way how the "best" NN has been chosen is usually not presented in the published applications. The selection of the optimal network architecture and parameter setting is therefore a real challenge when quality and robustness of prediction is searched for. To overcome this difficulty, each NN architecture with various numbers of layers
and neurons in the hidden layers has been tested several times both for the first and the second hidden layers for a constant epoch equal to 500 in order to select the best NNs architecture with minimum error ER% for validating the data set. For instance, a NN architecture with 1 hidden layer with 5 neurons is tested 100 times and the best ten NNs are stored. This process is repeated for changing number of neurons in the first and the second layer.
Results of the NNs Training
In this study, from a total of 116 tests, 20 tests were kept as the test data set and the remaining ones were used for the NNs training (76) and validation (20). Each training data sample is composed of geometrical and material parameters and the experimental ultimate load Pex. The "best
ten" (out of 100) were selected as the ones that, after training on 76 tests, gave smaller error on the 20 tests for validation.
The results of the training for different NNs architectures are presented in Table 3. In Table 3, and are the mean error of the best ten out of 100 for the validation and the test data sets, respectively. As it can be seen in Table 3, the NN model 8-1-4-1 with 1 neuron in the first hidden layer and 4 neurons in the second hidden layer is the most efficient to predict the patch resistance of plate girders.
Comparison of the NN Model with the Empirical Models
Through using the test data, the NNs results were compared with the results computed with the calibrated empirical models in Table 2. The results presented in Table 2 indicate that the NN model Pnnwith the m = 1.03, s = 0.11, = 9%, R2 = 0.96 and RMSE = 8.28 predicts the patch load resistance of plate girders with more accuracy than the empirical models.
1
m m2
37 SENSITIVITY ANALYSIS
Sensitivity analysis has been widely applied in engineering design to explore the model response behavior, evaluate the accuracy of a model, test the validity of the assumptions made, and etc. In the deterministic design, sensitivity analysis is used to find the rate of the changes in a model output due to the changes in the model inputs. That is usually performed by changing input variables one at a time near a given central point which involves partial derivatives and is often called deterministic sensitivity analysis.
When uncertainty is considered, sensitivity analysis has different meanings. We assume that the uncertainty in a design performance can be described probabilistically through its mean (), variance (2), more generally through the probability density function (PDF), the cumulative distribution function (CDF), and etc. Correspondingly, the sensitivity analysis under uncertainty needs to be performed on the stochastic characteristics of a model response with respect to the stochastic characteristics of the model inputs (Liu and Chen, 2004).
Safety in construction standards, e.g., Eurocodes, was accounted for by recognizing three main sources of uncertainty and errors: those in the load definition, in the material properties and in modeling. In the previous sections, the focus
was on model uncertainties. Each model requires input data relative to geometrical and material properties. Thus, for a given model, any uncertainty on these data will leave further effects on the distribution of Pnn, Pu and then Pu-cal.
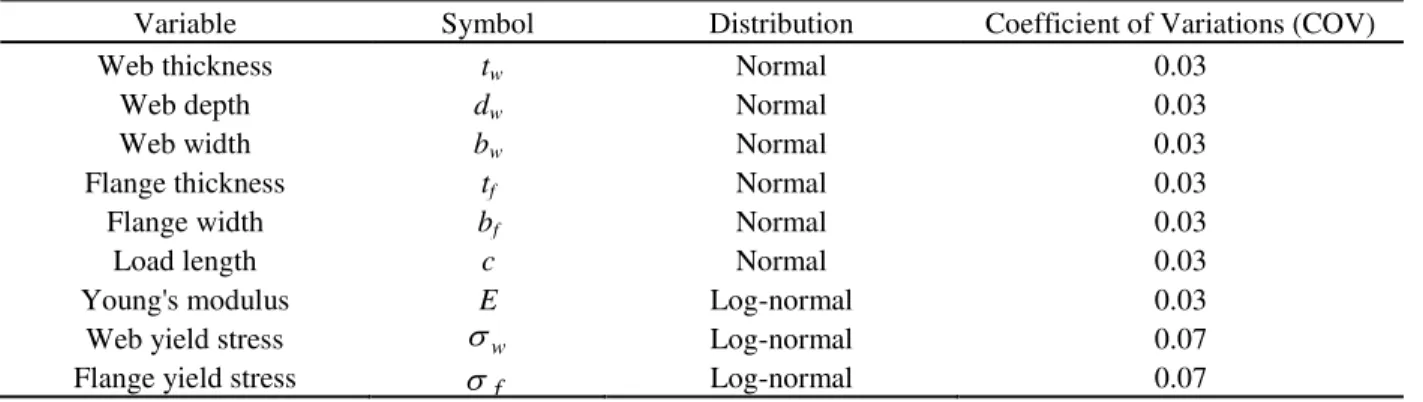
The uncertainty in material properties can be represented through the means of random variables. This includes the assumption of a particular probability distribution model. In general, it is the response to static and time dependent material loading that matters for structural design (Chaves et al., 2010; Kala, 2005; Gracino et al., 2011). Table 4 shows the parameters and distributions of random resistance variables considered in the current paper (JCSS, 2001-2).
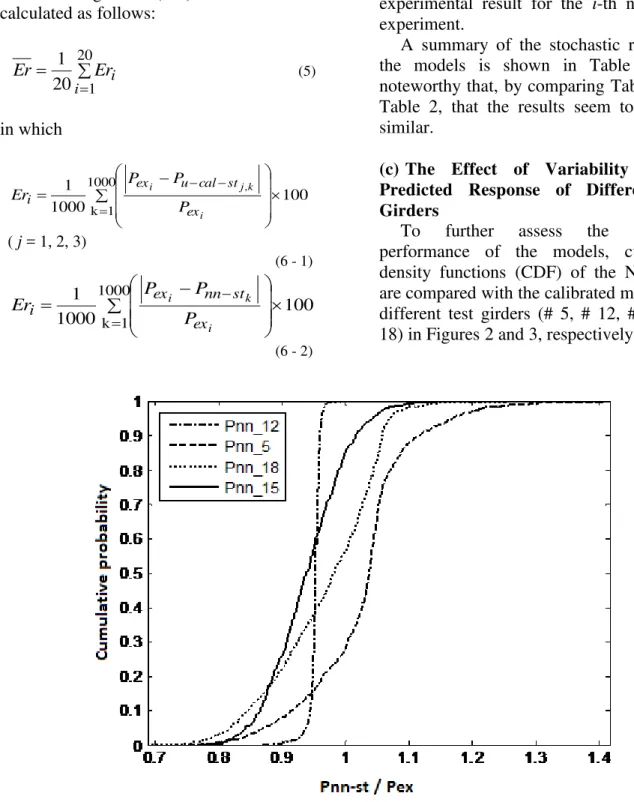
(a) The Effect of Variability on the Cumulative Distribution Functions for All Test Girders
To investigate the stochastic performance of the NN model and the calibrated models to predict the patch load resistance of plate girders, the Monte Carlo simulation method is used in which over 1000 samples are generated for each set of experimental results Pexi (i= 1, 2, 3, …, 20), NN model, and each calibrated modelPujcal (j = 1, 3, 9). Cumulative density functions (CDF) of the NN model and the calibrated models for all test girders (1000 simulations for each of 20 experiments) have been built.
Table 4. Statistics of random resistance variables.
Variable Symbol Distribution Coefficient of Variations (COV)
Web thickness tw Normal 0.03
Web depth dw Normal 0.03
Web width bw Normal 0.03
Flange thickness tf Normal 0.03
Flange width bf Normal 0.03
Load length c Normal 0.03
Young's modulus E Log-normal 0.03
Web yield stress Log-normal 0.07
Flange yield stress Log-normal 0.07
w
38 (b) Comparison of the Stochastic Results of the NN Model and the Calibrated Models
The average error (Er) for each model is calculated as follows:
20
1 20
1
i i
Er
Er (5)
in which
100 1000
1 1000
1 k
,
i k j i
ex st cal u ex i
P P P Er
( j = 1, 2, 3)
(6 - 1)
100 1000
1 1000
1 k
i k i
ex st nn ex
i
P P P
Er
(6 - 2)
where Pk is the estimated resistance by each model for the k-th sample of the generated random variable and Pexi is the experimental result for the i-th number of experiment.
A summary of the stochastic results for the models is shown in Table 5. It is noteworthy that, by comparing Table 5 with Table 2, that the results seem to be quite similar.
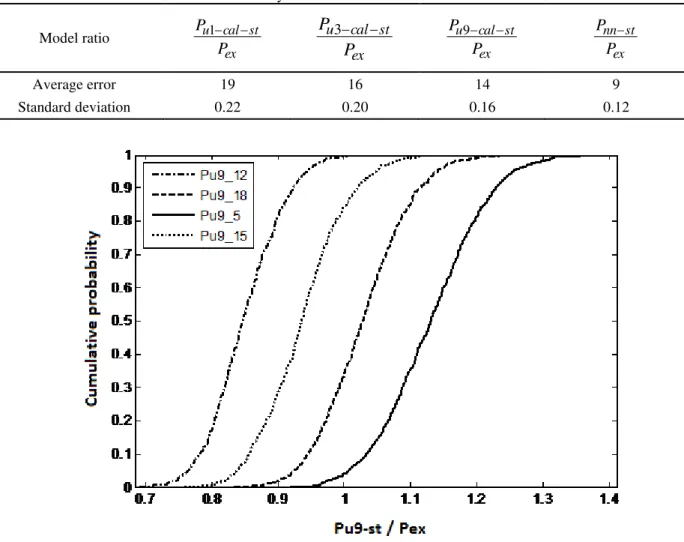
(c) The Effect of Variability on the Predicted Response of Different Test Girders
To further assess the stochastic performance of the models, cumulative density functions (CDF) of the NN model are compared with the calibrated model 9 for different test girders (# 5, # 12, #15 and # 18) in Figures 2 and 3, respectively.
39
Table 5. Summary of stochastic results for the models.
Model ratio
ex st cal u
P P1
ex st cal u
P P3
ex st cal u
P P9
ex st nn
P P
Average error 19 16 14 9
Standard deviation 0.22 0.20 0.16 0.12
Fig. 3. Comparison of cumulative density functions of the stochastic calibrated model 9 for different test girders.
Two major findings are worth noting here. First, the Pnn-st/Pex ratio is very close to
the one for the selected girders (this corresponds to the values in Figure 2), while this is not the case with model 9. Second, the shape of the four individual CDFs is very similar to model 9; this similarity shows the sensitivity of the model to the variation of material and geometrical properties. This is clearly different for the NN model, since the sensitivity to small variations of the inputs has completely different effects on the four girders. If model 9 is taken as a reference, one can deduce that, even after selection and careful validation, the NN model is not able to reproduce the sensitivity of the patch load to random fluctuations of the inputs.
(d) The Effect of the Variability on the Predicted Response of a Test Girder
40 web thickness around the web thickness of the test girder 15 (i.e. tw = 3 mm) with the
step of 0.02 mm with a range between 2 to 4 mm, and calculating the corresponding ultimate load. In this analysis, all input parameters except the web thickness of the selected girder are kept constant. The NNs resultsPnn are compared with the calibrated model 9 results Pu9cal, following the same procedure in Figure 4.
The local value of the sensitivity is the value of the first derivative dPst-nn/dtw at each
point, i.e., the slope of the curve in Figure 4. Figure 4 shows two very different curve shapes for model 9 and NN model. While the sensitivity that is calculated for model 9 follows a very regular variation
(corresponding, in fact, to the partial derivative that can be calculated from the Equation of model 9), the sensitivity calculated for the NN model follows a very different pattern. To quantify this fact, the slopes for three values of tw are calculated
and compared in Table 6. The results confirm that the NN model follows an unexpected pattern, as well (Figure 4). This phenomenon seems appealing as it explains the weaknesses of the NNs for sensitivity (reliability) analysis. However, if one uses the NNs models for the reliability analysis, probably it would be necessary to add a specific training stage where sensitivity values at some points of the research domain would have to be fitted by the model.
Fig. 4. Comparison of the NNs results with the calibrated model 9 results for girder #15.
Table 6. Comparison of slope for the NN model and the model 9 for girder #15.
Partial Derivative dPst-nn/dtw Slope (Figure 4) Slope (Figure 4)
tw Pu9_cal Pu9_cal Pnn
mm kN/mm kN/mm kN/mm
2 48.50 48.69 59.76
3 66.64 66.81 41.42
41 CONCLUSIONS
The behavior of plate girders that are subjected to the patch loading represents complex stability and elastoplastic problems. Some empirical formulae were established, but they still contain major errors when compared to the experimental results.
The accuracy of the proposed NN model and the empirical models in estimating the patch load resistance of plate girders has been evaluated. Subsequently, the verification results have been presented in terms of arithmetic mean, standard deviation, average relative error,Er, R -squared value, and root mean square error. Because most of the empirical models were developed on the basis of the limited experimental conditions, the models may not be taken so much as the optimal ones. Therefore, all the empirical data have been calibrated for comparing the applicability of the models. Consequently, the comparison has shown that, after a careful validation process, the NN model is the one that has the best predictive efficiency on a given data set (with Er of 9%).
However, it is common in engineering design to incorporate uncertainties, either those resulting from selecting the analytical-physical model or those inherent in geometry and material properties. In this paper, the uncertainties in geometry and material properties have been taken into account. To investigate the performance of the patch load resistance models, Monte Carlo simulation method has been used in which over 1000 samples were generated for each set of models and experiment results. The NNs results were then compared with the experimental results and the calibrated models. NNs models seemed to be able to reproduce the same general pattern for a data set when it was considered as a whole, for instance, regarding the global CDF.
Nevertheless, a more specific attention to the issue of sensitivity has shown that the NN model, however carefully selected, suffers from major drawbacks and is not able to reproduce accurately the sensitivity to small variations of the input parameters. If this behavior is not modified and improved, it can prevent any use of such models in reliability analysis where small variations of material parameters and geometry must be considered. This point needs to be further researched for more reliable results; for instance, in order to fit sensitivity values at some points of the learning domain, adding some constraints during the NN learning process is one of the possible ways.
ACKNOWLEDGEMENT
The first author wishes to express his gratitude to Ferdowsi University of Mashhad and I2M-GCE, University of Bordeaux1 for the support of sabbatical leave during the year 2011.
REFERENCES
Bakhary, N., Hao, H. and Deeks, A.J. (2007). "Damage detection using artificial neural network with consideration of uncertainties", Engineering Structures, 29(11), 2806-2815.
Cevik, A. (2007). "A new formulation for longitudinally stiffened webs subjected to patch loading", Journal of Constructional Steel Research, 63(10), 1328-1340.
Chacon, R., Mirambell, E. and Real, E. (2009). "Influence of designer-assumed initial conditions on the numerical modeling of steel plate girder subjected to patch loading", Thin-walled Structures, 47(4), 391-402.
Chacón, R., Mirambell, E. and Real, E. (2010). "Hybrid steel plate girders subjected to patch loading, Part 1: Numerical study", Journal of Constructional Steel Research, 66(5), 695-708. Chaves, I.A., Beck, A.T. and Malite, M. (2010).
"Reliability-based evaluation of design guidelines for cold-formed steel-concrete composite beams", Journal of the Brazilian Society of Mechanical
Sciences and Engineering, 32(5),
42 Fonseca, E.T, Vellasco, P.C.G. da S., Vellasco,
M.M.B.R. and de Andrade, S.A.L. (2008). "A neuro-fuzzy evaluation of steel beams patch load behaviour", Advances in Engineering Software, 39(7), 558-572.
Fonseca, E.T., Vellasco, P.C.G. da S., de Andrade, S.A.L. and Vellasco, M.M.B.R. (2003). “A patch load parametric analysis using neural networks”, Journal of Constructional Steel Research, 59(2), 251-267.
Gozzi, J. (2007). "Patch loading resistance of plated girders- ultimate and serviceability limit state", Doctoral Thesis, Lulea University of Technology, Lulea, Sweden.
Graciano, C. and Johansson, B. (2003). "Resistance of longitudinally stiffened I-girders subjected to to concentrated loads", Journal of Constructional Steel Research, 59(5), 561-586.
Gracino, C., Casanova, E. and Martinez, J. (2011). "Imperfection sensitivity of plate girder webs subjected to patch loading", Journal of Constructional Steel Research, 67(7), 1128-1133. Granath, P. and Lagerqvist O. (1999). "Behavior of
girder webs subjected to patch loading", Journal of Constructional Steel Research, 50(1), 49-69. Guzelbey, I.H., Cevik, A. and Erklig, A. (2006).
“Prediction of web crippling strength of cold-formed steel sheetings using neural networks”, Journal of Constructional Steel Research, 62(10), 962-973.
The Joint Committee on Structural Safety, JCSS. (2001-2). Probabilistic model code, Part 3-
Resistance models, structural steel, 3.02,
http://www.jcss.byg.dtu.dk/Publications/Probabili stic_Model_Code.
Kala, Z. (2005). "Sensitivity analysis of the stability problems of thin-walled structures", Journal of Constructional Steel Research, 61(3), 415-422. Kutmanova, I. and Skaloud, M. (1992). “Ultimate
limit state of slender steel webs subject to (i) constant an (ii) repeated partial edge loading”, Journal of Constructional Steel Research, 21(1-3), 147-162.
Lagerqvist, O. and Johansson, B. (1996). "Resistance of I-girders to concentrated loads", Journal of Constructional Steel Research, 39(2), 87-119. Lanzi, L., Bisagni, C. and Ricci, S. (2004). “Neural
network systems to reproduce crash behavior of structural components”, Computers and structures, 82(1), 93-108.
Liu, H. and Chen, W. (2004). "Probabilistic sensitivity analysis methods for design under uncertainty", Proceedings of the 10th AIAA/ISSMO Multidisciplinary Analysis and Optimization
Conference, Albany, New York, 30 August - 01 September.
Markovic, N. and Hajdin, N. (1992). “A contribution to the analysis of the behavior of plate girders
subjected to patch loading”, Journal of
Constructional Steel Research, 21(1-3), 163-173. McCabe, M.F., Franks, S.W. and Kalma, J.D. (2005).
“Calibration of a land surface model using multiple data sets", Journal of Hydrology, 302(1-4), 209-222.
Rattanapitikon, W. (2007). “Calibration and modification of energy dissipation models for irregular wave breaking", Ocean Engineering, 34(11-12), 1592-1601.
Roberts, T.M. and Newark, A.C.B. (1997). “Strength of webs subjected to compressive edge loading”, Journal of Structural Engineering, 123(2), 176-183.
Roberts, T.M. and Rockey, K.C. (1979). “A mechanism solution for predicting the collapse loads ofslender plate girders when subjected to in-plane loading”, Proceedings of the Institution of Civil Engineers, 2(67), 155-175.