DOI: 10.1126/science.1127609
, 58 (2006);
313
Science
et al.
T. M. Brooks
Global Biodiversity Conservation Priorities
This copy is for your personal, non-commercial use only.
clicking here.
colleagues, clients, or customers by
, you can order high-quality copies for your
If you wish to distribute this article to others
here.
following the guidelines
can be obtained by
Permission to republish or repurpose articles or portions of articles
):
November 26, 2012
www.sciencemag.org (this information is current as of
The following resources related to this article are available online at
http://www.sciencemag.org/content/313/5783/58.full.html
version of this article at:
including high-resolution figures, can be found in the online
Updated information and services,
http://www.sciencemag.org/content/suppl/2006/07/03/313.5783.58.DC1.html
can be found at:
Supporting Online Material
http://www.sciencemag.org/content/313/5783/58.full.html#related
found at:
can be
related to this article
A list of selected additional articles on the Science Web sites
http://www.sciencemag.org/content/313/5783/58.full.html#ref-list-1
, 11 of which can be accessed free:
cites 46 articles
This article
144 article(s) on the ISI Web of Science
cited by
This article has been
http://www.sciencemag.org/content/313/5783/58.full.html#related-urls
33 articles hosted by HighWire Press; see:
cited by
This article has been
http://www.sciencemag.org/cgi/collection/ecology
Ecology
subject collections:
This article appears in the following
registered trademark of AAAS.
is a
Science
2006 by the American Association for the Advancement of Science; all rights reserved. The title
Copyright
American Association for the Advancement of Science, 1200 New York Avenue NW, Washington, DC 20005.
(print ISSN 0036-8075; online ISSN 1095-9203) is published weekly, except the last week in December, by the
Science
on November 26, 2012
www.sciencemag.org
Global Biodiversity
Conservation Priorities
T. M. Brooks,1,2,3* R. A. Mittermeier,1G. A. B. da Fonseca,1,4J. Gerlach,5,6M. Hoffmann,1 J. F. Lamoreux,3C. G. Mittermeier,1J. D. Pilgrim,7A. S. L. Rodrigues5
The location of and threats to biodiversity are distributed unevenly, so prioritization is essential to minimize biodiversity loss. To address this need, biodiversity conservation organizations have proposed nine templates of global priorities over the past decade. Here, we review the concepts, methods, results, impacts, and challenges of these prioritizations of conservation practice within the theoretical irreplaceability/vulnerability framework of systematic conservation planning. Most of the templates prioritize highly irreplaceable regions; some are reactive (prioritizing high vulnerability), and others are proactive (prioritizing low vulnerability). We hope this synthesis improves understanding of these prioritization approaches and that it results in more efficient allocation of geographically flexible conservation funding.
H
uman actions are causing a biodiversity crisis, with species extinction rates up to 1000 times higher than background (1). Moreover, the processes drivingextinc-tion are eroding the environmental services on which humanity depends (2). People care most
about what is close to them, so most responses to this crisis will be local or national (3). Thus,
approximately 90% of the $6 billion of annual conservation funding originates in and is spent within economically rich countries (4).
How-ever, this leaves globally flexible funding of hundreds of millions of dollars annually from multilateral agencies (such as the Global En-vironment Facility), bilateral aid, and private sources including environmentally focused cor-porations, foundations, and individuals. These resources are frequently the only ones available where conservation is most needed, given that biodiversity is unevenly distributed and the most biodiverse places are often the most threatened and poorest economically (5). Accordingly,
geo-graphically flexible resources exert dispropor-tionate influence on conservation worldwide and have a key role in the recently agreed-upon intergovernmental 2010 target to reduce signif-icantly the rate of biodiversity loss (6).
The development of strategies to best allo-cate globally flexible conservation resources has attracted considerable attention since the pioneering work of Myers (7), resulting in
much progress as well as much controversy. The wide variety of approaches has led to crit-icism that there is duplication of effort and lack of clarity (8). Although attempts have been
made to summarize conservation planning strategies by scale (9), none has done so within
the framework of conservation planning (10).
We review the published concepts and methods behind global biodiversity conservation priori-tization, assess the remaining challenges, and highlight how this synthesis can inform alloca-tion of globally flexible resources.
Global Prioritization in Context
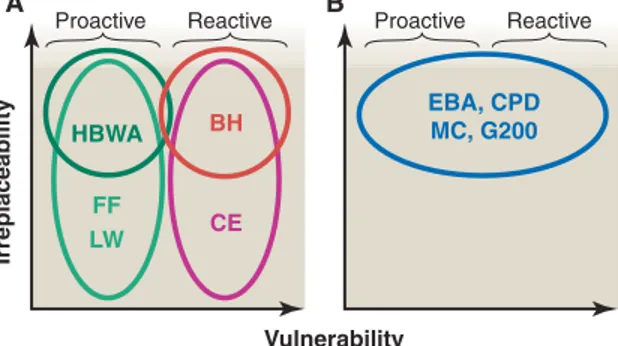
Nine major institutional templates of global bio-diversity conservation prioritization have been published over the past decade, each with involvement from nongovernmental organiza-tions (fig. S1). Conceptually, they all fit within the framework of ‘‘irreplaceability’’ relative to ‘‘vulnerability’’ (Fig. 1), which is central to con-servation planning theory (10). However, they
map onto different portions of the framework: Most of the templates prioritize high irreplace-ability, but some prioritize high
vulnerability and others prioritize low vulnerability. These differences are key to understanding how and why the nine prioritizations differ, yielding priority maps that cover from less than one-tenth to more than a third of Earth’s land surface (Fig. 2).
Six of the nine templates of global conservation priority incor-porate irreplaceability—measures of spatial conservation options (10). The most common measure
of irreplaceability is plant (11–14)
or bird (15) endemism, often
sup-ported by terrestrial vertebrate en-demism overall (11, 13,14). The
logic for this is that greater the number of endemic species in a
region, the more biodiversity is lost if that region is lost (although, in a strict sense, any location with even one endemic species is irreplaceable). In addition to the number of endemic species, other aspects of irreplaceabil-ity have been proposed, including taxonomic uniqueness, unusual phenomena, and global rarity of major habitat types (16), but these
re-main difficult to quantify. Although species rich-ness within a given area is popularly assumed to be important in prioritization, none of the approaches relies on species richness alone. This is because species richness is driven by common, widespread species; thus, strategies focused on species richness tend to miss exactly those biodiversity features most in need of conservation (17,18). Three approaches do not
incorporate irreplaceability (19–21).
The choice of irreplaceability measures is to some degree subjective, in that data limitations currently preclude the measurement of overall biodiversity. Furthermore, these data constraints mean that, with the exception of endemic bird areas (15), the measures of irreplaceability used
in global conservation prioritization have been derived from the opinions of specialists. Sub-sequent tests of plant endemism estimates (22)
have shown this expert opinion to be quite ac-curate. However, reliance on specialist opinion means that results cannot be replicated, raising questions concerning the transparency of the approaches (8). It also prevents a formal
mea-surement of irreplaceability, which requires the identities of individual biodiversity features, such as species names, rather than just estimates of their magnitude expressed as a number (8,23).
Five of the templates of global conservation priority incorporate vulnerability—measures of temporal conservation options (10). A recent
classification of vulnerability (24) recognizes
four types of measures: (i) environmental and spatial variables, (ii) land tenure, (iii) threatened species, and (iv) expert opinion. Of these, environmental and spatial variables have been
REVIEW
1Conservation International, 1919 M Street, NW, Washington,
DC 20036, USA. 2World Agroforestry Centre (ICRAF), Post
Office Box 35024, University of the Philippines, Los Ban˜os, Laguna 4031, Philippines. 3Department of Environmental
Sciences, University of Virginia, Charlottesville, VA 22904, USA.4Departamento de Zoologia, Universidade Federal de
Minas Gerais, Belo Horizonte, MG 31270, Brazil.5Department
of Zoology, University of Cambridge, Downing Street, Cambridge CB2 3EJ, UK. 6Nature Protection Trust of
Seychelles, Post Office Box 207, Victoria, Mahe´, Seychelles.
7BirdLife International in Indochina, 4/209 Doi Can Street, Ba
Dinh, Hanoi, Vietnam.
*To whom correspondence should be addressed. E-mail: [email protected]
Vulnerability B A
Irreplaceability
Proactive Reactive
CE
LW FF
HBWA
EBA, CPD MC, G200
BH
Proactive Reactive
Fig. 1.Global biodiversity conservation priority templates placed within the conceptual framework of irreplaceability and vulner-ability. Template names are spelled out in the Fig. 2 legend. (A) Purely reactive (prioritizing low vulnerability) and purely pro-active (prioritizing high vulnerability) approaches. (B) Approaches that do not incorporate vulnerability as a criterion (all prioritize high irreplaceability).
on November 26, 2012
www.sciencemag.org
used most frequently in global conservation prioritization, measured as proportionate habitat loss (11,14,20,21). Species-area relationships
provide justification that habitat loss translates into biodiversity loss (1). However, the use of
habitat loss as a measure of vulnerability has several problems: It is difficult to assess with the use of remote sensing for xeric and aquatic systems, it does not incorporate threats such as invasive species and hunting pressure, and it is retrospective rather than predictive (24). The
frontier forests approach (19) uses absolute
forest cover as a measure.
In addition to habitat loss, land tenure— measured as protected area coverage—has also been incorporated into two approaches (16,21).
Other possible surrogates not classified by Wilson et al. (24) include human population
growth and density, which are widely thought to be relevant (25–27) and were integral to two of
the systems (14, 20). None of the global
con-servation prioritization templates used threatened species or expert opinion as measures of vul-nerability. Political and institutional capacity and governance (27) affect biodiversity
indi-rectly, but have not been incorporated to date. This is true for climate change as well, which is of concern given that its impact is likely to be severe (28). Finally, although costs of
conser-vation generally increase as the threat increases, no proposals for global biodiversity conserva-tion priority have yet incorporated costs direct-ly, despite the availability of techniques to do this at regional scales (29). Two of the
tem-plates of global conservation prioritization do not incorporate vulnerability (12, 13), and the
remaining two incorporate it only peripherally (15,16).
The spatial units most commonly used in sys-tematic conservation planning are equal-area grids. However, data limitations have precluded their use in the development of actual templates of global biodiversity conservation priority to date. Instead, all proposals, with the exception of mega-diversity countries (13), are based on
biogeo-graphic units. Typically, these units are defined a priori by specialist perception of the distribution of biodiversity. For example, ‘‘ecoregions,’’ one of the most commonly used such classifications, are ‘‘relatively large units of land containing a characteristic set of natural communities that share a large majority of their species, dynamics, and environmental conditions’’ (16). Only in the
endemic bird areas approach are biogeographic units defined a posteriori by the distributions of the species concerned (15). Relative to
equal-area grids, biogeographic units bring advantages of ecological relevance, whereas megadiversity countries (13) bring political relevance.
Reliance on biogeographic spatial units raises several complications. Various competing biore-gional classifications are in use (30), and the
choice of system has considerable repercussions for resulting conservation priorities. Furthermore, when unequally sized units are used, priority may be biased toward large areas as a consequence of species-area relationships. Therefore, assessment of global conservation priorities should factor out
area, either by taking residuals about a best-fit line to a plot of species against area (18) or by
rescaling numbers of endemic species with the use of a power function (23). Nevertheless, the
use of a priori bioregional units for global conservation prioritization will be essential until data of sufficient resolution become available to enable the use of grids.
In Fig. 3, we map the overlay of the global biodiversity conservation priority systems into geographic space from the conceptual frame-work of Fig. 1. Figure 3A illustrates the large degree of overlap between templates that pri-oritize highly vulnerable regions of high ir-replaceability: tropical islands and mountains (including montane Mesoamerica, the Andes, the Brazilian Atlantic forest, Madagascar, mon-tane Africa, the Western Ghats of India, Ma-laysia, Indonesia, the Philippines, and Hawaii), Mediterranean-type systems (including Califor-nia, central Chile, coastal South Africa, south-west Australia, and the Mediterranean itself), and a few temperate forests (the Caucasus, the central Asian mountains, the Himalaya, and southwest China). Highly vulnerable regions of lower irreplaceability (generally, the rest of the northern temperate regions) are priori-tized by fewer approaches. Figure 3B shows a large amount of overlap between templates for regions of low vulnerability but high ir-replaceability, in particular the three major tropical rainforests of Amazonia, the Congo, and New Guinea. Regions of simultaneously lower vulnerability and irreplaceability, such as
Fig. 2.Maps of the nine global biodiversity conservation priority templates: CE, crisis ecoregions (21); BH, biodiversity hot spots [(11), updated by (39)]; EBA, endemic bird areas (15); CPD, centers of plant diversity (12); MC,
megadiversity countries (13); G200, global 200 ecoregions [(16), updated by (54)]; HBWA, high-biodiversity wilderness areas (14); FF, frontier forests (19); LW, last of the wild (20).
REVIEW
on November 26, 2012
www.sciencemag.org
the boreal forests of Canada and Russia, and the deserts of the western United States and central Asia, are prioritized less often.
Two general observations are apparent. First, most land (79%) is highlighted by at least one of the prioritization systems. Second, despite this, a noticeable pattern emerges from the overlay of different approaches. There is significant overlap among templates that prioritize irreplaceable re-gions (11–16), among those that prioritize highly
vulnerable regions (11,21), and among those that
prioritize regions of low vulnerability (14,19,20),
but not between approaches across each of these three gen-eral classes (table S1). This pro-vides useful cross-verification of priority regions (31).
These patterns of overlap reflect two approaches to how vulnerability is incorporated into conservation in the broadest sense: reactive (prioritizing areas of high threat and high irreplace-ability) and proactive (prioritiz-ing areas of low threat but high irreplaceability). The former are considered the most urgent pri-orities in conservation planning theory (10) because unless
im-mediate conservation action is taken within them, unique bio-diversity will soon be lost. The latter are often de facto prior-ities, because the opportunities for conservation in these are considerable (32). Biodiversity
conservation clearly needs both approaches, but the implemen-tation of each may correspond to different methods. On the one hand, large-scale conserva-tion initiatives may be possible in wilderness areas, such as the establishment of enormous pro-tected areas (one example is the 3,800,000-ha Tumucumaque National Park, created in the Brazilian state of Amapa´ in 2003). On the other hand, finely tuned conservation will be es-sential in regions of simulta-neously high irreplaceability and threat, where losing even
tiny patches of remnant habitat, such as the sites identified by the Alliance for Zero Extinction (33), would be tragic.
Impact of Global Prioritization
The appropriate measure of impact is the success of prioritization in achieving its main goal: in-fluencing globally flexible donors to invest in regions where these funds can contribute most to conservation. Precise data are unavailable for all of the approaches (34), but hot spots alone have
mobilized at least $750 million of funding for
conservation in these regions (35). More
specif-ically, conservation funding mechanisms have been established for several of the approaches, such as the $100 million, 10-year Global Conservation Fund focused on high-biodiversity wilderness areas and hot spots, and the $125 million, 5-year Critical Ecosystem Partnership Fund, aimed exclusively at hot spots. The Global Environment Facility, the largest financial mech-anism addressing biodiversity conservation, is currently exploring a resource allocation framework that builds on existing templates.
Both civil society and government organizations often use the recognition given to regions as global conservation priorities as justification when applying for geographically flexible funding. In addition, the global prioritization systems must have had sizeable effects in the cancellation, relocation, or mitigation of envi-ronmentally harmful activities, even in the absence of specific legislation. Unfortunately, resources still fall an order of magnitude short of required conservation funding (4). Nevertheless,
the dollar amounts are impressive, and represent
marked increases in conservation investment in these regions.
Challenges Facing Global Prioritization Limitations of data have thus far generally restricted global conservation prioritization to specialist estimates of irreplaceability, to habitat loss as a measure of vulnerability, and to coarse geographic units defined a priori. Over the past 5 years, spatial data sets have been compiled with the potential to reduce these constraints, particularly for mammals, birds, and amphibians (5). When these
maps are combined with assess-ment of conservation status, they enable the development of threat metrics directly based on threatened species (36). So far,
the main advances to global prioritization enabled by these new data are validation tests of existing templates (31).
Encour-agingly, global gap analysis of priorities for the representation of terrestrial vertebrate species in protected areas (36) and
initial regional assessment of plants (37) yield results similar
to existing approaches (fig. S2). Invertebrates represent the bulk of eukaryotic diversity on Earth with more than a million known species and many more yet to be described (5). The
con-servation status of onlyÈ3500 arthropods has been assessed (5), so global conservation
prior-ity is far from being able to incor-porate megadiverse invertebrate taxa (8, 23). Although some
re-gional data shows little overlap between priority areas for arthro-pods and those for plant and terrestrial vertebrate taxa (38),
preliminary global data for groups such as tiger beetles and termites suggest much higher levels of congruence (39).
Simi-larly, pioneering techniques to model overall irreplaceability by combining point data for mega-diverse taxa with environmental data sets produce results com-mensurate with existing conser-vation priorities (40). These findings, although
encouraging, in no way preclude the need to use primary invertebrate data in global conservation prioritization as they become available.
Aquatic systems feature poorly in existing con-servation templates. Only one concon-servation prior-itization explicitly incorporates aquatic systems (16). The most comprehensive study yet, albeit
restricted to tropical coral reef ecosystems, iden-tified 10 priority regions based on endemism and threat (41). Eight of these regions lie adjacent to
priority regions highlighted in Fig. 3, raising the
Fig. 3. Mapping the overlay of approaches prioritizing reactive and proactive conservation. (A) Reactive approaches, corresponding to the right-hand side of Fig. 1A, which prioritize regions of high threat, and those that do not incorporate vulnerability as a criterion (Fig. 1B); the latter are only mapped where they overlap with the former. (B) Proactive approaches, corresponding to the left-hand side of Fig. 1A, which prioritize regions of low threat, and those that do not incorporate vulnerability as a criterion (Fig. 1B); again, the latter are only mapped where they overlap with the former. Shading denotes the number of global biodiversity conservation prioritization templates that prioritize the shaded region, in both (A) and (B).
on November 26, 2012
www.sciencemag.org
possibility of correspondence between marine and terrestrial priorities, despite the expectation that surrogacy of conservation priorities will be low between different environments (42). Efforts to
identify freshwater priorities lag further behind, although initial studies reveal a highly uneven distribution of freshwater fish endemism (39).
Most measurement of irreplaceability is species based, raising the concern that phylogenetic di-versity may slip through the net of global con-servation priorities (8,23,43). However, analyses
for mammals (44) find that priority regions
repre-sent higher taxa and phylogenetic diversity better than would be predicted by the degree to which they represent species. Islands such as Madagas-car and the Caribbean hold especially high con-centrations of endemic genera and families (39).
A heterodox perspective argues that the terminal tips of phylogenetic trees should be higher pri-orities than deep lineages (45). In any case, the
balance of work implies that even if phylogenetic diversity is not explicitly targeted for conservation, global prioritization based on species provides a solid surrogate for evolutionary history.
That global conservation priority regions capture phylogenetic history does not necessar-ily mean that they represent evolutionary pro-cess (8). For example, transition zones or
‘‘biogeographic crossroads,’’ frequently over-looked by conservation prioritization, could be of particular importance in driving speciation (46). On the other hand, there is evidence that
areas of greatest importance in generating bio-diversity are those of long-term climatic sta-bility, especially where they occur in tropical mountains (47), which are incorporated in most
approaches to global conservation prioritiza-tion. The development of metrics for the main-tenance of evolutionary process is in its infancy and represents an emerging research front.
A final dimension that will prove important to assess in the context of global conservation priori-tization concerns ecosystem services (43).
Al-though the processes threatening biodiversity and ecosystem services are likely similar, the relation-ship between biodiversity per se and ecosystem services remains unresolved (48). Thus, while it is
important to establish distinct goals for these con-servation objectives (49), identification of
syner-gies between them is strategically vital. This research avenue has barely been explored, and questions of how global biodiversity conservation priorities overlap with priority regions for carbon sequestration, climate stabilization, maintenance of water quality, minimization of outbreaks of pests and diseases, and fisheries, for example, remain un-answered. However, the correspondence between conservation priorities and human populations (25,26) and poverty (4,5) is an indication that the
conservation of areas of high biodiversity priority will deliver high local ecosystem service benefits.
From Global to Local Priorities
The establishment of global conservation prior-ities has been extremely influential in directing
resources toward broad regions. However, a number of authors have pointed out that global conservation prioritization has had little success in informing actual conservation implementa-tion (8,23). Separate processes are necessary to
identify actual conservation targets and priorities at much finer scales, because even within a region as uniformly important as, for example, Mada-gascar, biodiversity and threats are not evenly distributed. Bottom-up processes of identification of priorities are therefore essential to ensure the implementation of area-based conservation (50).
Indeed, numerous efforts are underway to identify targets for conservation implementation. Many focus on the site scale, drawing on two decades of work across nearly 170 countries in the designation of important bird areas (51).
There is an obvious need to expand such work to incorporate other taxa (52) and to prioritize the
most threatened and irreplaceable sites (33).
Such initiatives have recently gained strong political support under the Convention on Biological Diversity, through the development of the Global Strategy for Plant Conservation and the Programme of Work on Protected Areas. Both mechanisms call for the identification, recognition, and safeguarding of sites of bio-diversity conservation importance. Meanwhile, considerable attention is also targeted at the scale of landscapes and seascapes to ensure not just the representation of biodiversity but also of the connectivity, spatial structure, and processes that allow its persistence (53).
Global conservation planning is key for strategic allocation of flexible resources. Despite divergence in methods between the different schemes, an overall picture is emerging in which a few regions, particularly in the tropics and in Mediterranean-type environments, are consist-ently emphasized as priorities for biodiversity conservation. It is crucial that the global donor community channel sufficient resources to these regions, at the very minimum. This focus will continue to improve if the rigor and breadth of biodiversity and threat data continue to be consolidated, which is especially important given the increased accountability demanded from global donors. However, it is through the con-servation of actual sites that biodiversity will ultimately be preserved or lost, and thus drawing the lessons of global conservation prioritization down to a much finer scale is now the primary concern for conservation planning.
References and Notes
1. S. L. Pimm, G. J. Russell, J. L. Gittleman, T. M. Brooks, Science269, 347 (1995).
2. Millennium Ecosystem Assessment,Ecosystems and Human Well-Being(Island Press, Washington, DC, 2005). 3. M. L. Hunter Jr., A. Hutchinson,Conserv. Biol.8, 1163
(1994).
4. A. James, K. J. Gaston, A. Balmford,Nature401, 323 (1999).
5. J. E. M. Baillieet al.,Global Species Assessment(IUCN, Gland, Switzerland, 2004).
6. A. Balmfordet al.,Science307, 212 (2005). 7. N. Myers,Environmentalist8, 187 (1988).
8. G. M. Maceet al.,Nature405, 393 (2000). 9. K. H. Redfordet al.,Conserv. Biol.17, 116 (2003). 10. C. R. Margules, R. L. Pressey,Nature405, 243 (2000). 11. N. Myerset al.,Nature403, 853 (2000).
12. WWF, IUCN,Centres of Plant Diversity(WWF and IUCN, Gland, Switzerland, 1994–1997).
13. R. A. Mittermeier, P. Robles Gil, C. G. Mittermeier, Megadiversity(CEMEX, Mexico City, Mexico, 1997). 14. R. A. Mittermeieret al.,Proc. Natl. Acad. Sci. U.S.A.100,
10309 (2003).
15. A. J. Stattersfield, M. J. Crosby, A. J. Long, D. C. Wege, Endemic Bird Areas of the World(BirdLife International, Cambridge, UK, 1998).
16. D. M. Olson, E. Dinerstein,Conserv. Biol.12, 502 (1998).
17. C. D. L. Ormeet al.,Nature436, 1016 (2005). 18. J. F. Lamoreuxet al.,Nature440, 212 (2006). 19. D. Bryant, D. Nielsen, L. Tangley,Last Frontier Forests
(World Resources Institute, Washington, DC, 1997). 20. E. W. Sandersonet al.,Bioscience52, 891 (2002). 21. J. M. Hoekstraet al.,Ecol. Lett.8, 23 (2005). 22. G. A. Krupnick, W. J. Kress,Biodivers. Conserv.12, 2237
(2003).
23. N. Brummitt, E. N. Lughadha,Conserv. Biol.17, 1442 (2003).
24. K. Wilsonet al.,Environ. Manage.35, 527 (2005). 25. R. P. Cincotta, J. Wisnewski, R. Engelman,Nature404,
990 (2000).
26. A. Balmfordet al.,Science291, 2616 (2001). 27. C. O’Connor, M. Marvier, P. Kareiva,Ecol. Lett.6, 706
(2003).
28. C. Parmesan, G. Yohe,Nature421, 37 (2003). 29. K. A. Wilsonet al.,Nature440, 337 (2006). 30. P. Jepson, R. J. Whittaker,Conserv. Biol.16, 42 (2002). 31. G. A. B. da Fonsecaet al.,Nature405, 393 (2000). 32. M. Cardillo, G. M. Mace, J. L. Gittleman, A. Purvis,Proc.
Natl. Acad. Sci. U.S.A.103, 4157 (2006). 33. T. H. Rickettset al.,Proc. Natl. Acad. Sci. U.S.A.51,
18497 (2005).
34. B. S. Halpernet al.,Conserv. Biol.20, 56 (2006). 35. N. Myers,Bioscience53, 916 (2003).
36. A. S. L. Rodrigueset al.,Bioscience54, 1092 (2004). 37. W. Ku¨peret al.,Ann. Missouri Bot. Gard.91, 525
(2004).
38. A. P. Dobson, J. P. Rodriguez, W. M. Roberts, D. S. Wilcove, Science275, 550 (1997).
39. R. A. Mittermeieret al.,Hotspots Revisited(CEMEX, Mexico City, Mexico, 2004).
40. S. Ferrieret al.,Bioscience54, 1101 (2004). 41. C. M. Robertset al.,Science295, 1280 (2002). 42. W. V. Reid,Trends Ecol. Evol.13, 275 (1998). 43. P. Kareiva, M. Marvier,Am. Sci.91, 344 (2003). 44. W. Sechrestet al.,Proc. Natl. Acad. Sci. U.S.A.99, 2067
(2002).
45. T. L. Erwin,Science253, 750 (1991).
46. T. B. Smith, R. K. Wayne, D. J. Girman, M. W. Bruford, Science276, 1855 (1997).
47. J. Fjeldsa˚, J. C. Lovett,Biodivers. Conserv.6, 325 (1997).
48. M. Loreauet al.,Science294, 804 (2001). 49. S. Sarkar,Bioscience49, 405 (1999).
50. R. J. Whittakeret al.,Divers. Distrib.11, 3 (2005). 51. BirdLife International,State of the World’s Birds 2004
(BirdLife International, Cambridge, UK, 2004). 52. G. Ekenet al.,Bioscience54, 1110 (2004). 53. R. M. Cowling, R. L. Pressey, M. Rouget, A. T. Lombard,
Biol. Conserv.112, 191 (2003).
54. D. M. Olson, E. Dinerstein,Ann. Missouri Bot. Gard.89, 199 (2002).
55. We thank G. Fabregas, D. Knox, T. Lacher, P. Langhammer, N. Myers, and W. Turner for help with the manuscript, and the Gordon and Betty Moore Foundation for funding.
Supporting Online Material
www.sciencemag.org/cgi/content/full/313/5783/58/DC1 Figs. S1 and S2
Table S1
References and Notes
10.1126/science.1127609