DOI : 10.18843/rwjasc/v6i4/10 DOI URL : http://dx.doi.org/10.18843/rwjasc/v6i4/10
A STUDY ON THE FACTORS THAT AFFECT FOR THE LESS
CHANNELLING TO USAGE HUTCH MOBILE SERVICE
PROVIDER IN MATARA DISTRICT, SRI LANKA 2014
Weeraratne N.C.,
Department of Economics & Statistics,
SUSL, BelihulOya, Sri Lanka
ABSTRACT
This research investigates the hypothesis on the enabling factors that affect for the less channeling to usage hutch mobile service provider in Matara District, Sri Lanka. The objective was helpful in providing a clear picture as to what were the reasons behind for the minimum market share holder of mobile communication service providers in Matara District, Sri Lanka. The study was a cross-sectional survey among a representative sample of 200 male and female from the Matara District with varying socio-economic status and varying levels of occupation status from selected Divisional Secretariats in Matara District. A number of major influential factors that affected for the less channeling to the hutch mobile connection in Matara District, Sri Lanka were examined through this research study. The study highlighted less market share for Hutch mobile connection in Matara District, Sri Lanka. In the present study, Hutch mobile connection demand rate among peoples in the Matara District, Sri Lanka, was found to be 9.5%. The channeling to usage Hutch mobile service provider university students was found to be high. The principal factors affecting the Hutch usage of these people in terms of magnitude were new schemes or up gradation of the hutch mobile connection, network problems on the hutch mobile connection and level of knowledge about the facilities of the hutch mobile connection.
INTRODUCTION:
Communication is not a new word for human being. It has a long history. The English term Communication has been evolved from Latin language. Communicare and Communis are two Latin words related to the word communication. Communicare, meant “to share, to impart”; however it also meant literally, “to make common”, drawing from the Latin noun communis. The Latin noun, communis, is translated as “in common, public and general, shared by many”. The word „communication‟ is used in common talk, usually, to mean speaking or writing or sending a message to another person.” Derek Tannis, August 2010”.
Communication is the most important media for human works to exchange their idea, inform something and in day-to-day living. There are various types of communication, mainly divided into three types such as Nonverbal communication, Oral communication and Business communication. Mobile communication is talking, texting or sending data or image files over a wireless network and it doesn‟t subsists an any physical relationship between two or more communication substances. Evolution of the mobile communication is based on the breakthroughs in engineering science made by several pioneering giants during the 19th century and also at the early part of the 20th century. The existing GSM and CDMA technologies present mobile communication.
The Mobile Network Operator (MNO) is a mobile conductor or a phone carrier that possessesits own mobile license and mobile infrastructure of the mobile communication. It is also called wireless service provider, cellular company or wireless carrier. Mobile Network Operator have a direct relationship with the end-user and they handles all the activities necessary when providing wireless communications systems.
There are five mobile service providers in Sri Lanka‟s mobile industry and it is a more competitive market in Asia with five operators competing for a total addressable population of 21 million. The five mobile service providers are Bharti Airtel Lanka (Pvt) Ltd, Dialog Telecom Ltd, Hutchison Telecommunications Lanka (Pvt) Ltd, Mobitel (Pvt) Ltd and Etisalat (Pvt) Ltd.
RESEARCH PROBLEM:
Sri Lanka is certainly a developing country in terms of its economy. Economically, agriculture is a dominant sector, and continues to be the main source of income for many. Today, Sri Lanka‟s major economic sectors include tourism, clothing and textiles, while the country‟s economy has also seen significant contributions from other sectors such as industrial exports and telecommunication.
Now-a-days, the customers are more dynamic. Their taste, needs and preference have been changed as per current situation. Hence the development of tele-communication industry mainly depends on the customer satisfaction. Now-a-days, economy contributions of service sector in Sri Lanka are comparatively high (Sectoral Composition of GDP %, Agriculture 10.8%, Industry 31.1% and Services 58.1%).”Sri Lanka Socio-Economic Data, 2014”. But the tele-communication contribution of the Sri Lankan GDP is very low compared to the other sections of the service sector (tele-communication composition of GDP 0.43%).”Annual Report, CBSL 2014”.
The mobile market was dominated by Dialog with a subscriber market share of 40%, followed by Mobitel with 21%, Etisalat at 20%, Airtel and Hutch with 19% according to the 12th Global Symposium for Regulators, Sri Lanka 2012.
The largest area of having mobile phone users is the western province (282,075 users) and all service providers capture approximately same amount of market share. But it is different f or the southern province. The second largest area of having mobile phone users is the southern province (162,373 users) and Airtel was the minimum market share holder. Hutch is second minimum market share holder. Due to, still Airtel is a junior mobile service provider in Sri Lanka, the research considers only four mobile service providers without the Airtel.”Sri Lanka Socio-Economic Data, 2014”.
OBJECTIVES OF THE STUDY:
GENERAL OBJECTIVE OF THE STUDY:
The study refers to the factors that has affected for the less channeling to usage of hutch mobile service provider in Sri Lanka.
SPECIFIC OBJECTIVES OF THE STUDY:
To study the consumer‟s satisfaction of telephone service provider over customer‟s occupational level on mobile phone connection.
To study the consumer‟s satisfaction towards different telephone service providers on mobile phone connection.
To study the consumer‟s satisfaction of telephone service provider over customer‟s residence sector on mobile phone connection.
To find the most preferred service provider in southern province Sri Lanka.
To identify the factors that affects the consumer in switching another service provider (Hutch into another).
MATERIALS AND METHOD:
The study was a cross-sectional survey among a representative sample of 200 male and female from the Matara District with varying socio-economic status and varying levels of occupation status from selected Divisional Secretariats in Matara District. Disproportionate Stratified Random Sampling Technique was adapted for collecting the sample. Bivariate (cross-tabulation and chi-square tests) and logistic regression analysis were used to analyze the data.
DATA SOURCES:
Data collection was done through both secondary and primary sources. Primary data sources included semi-structured interviews, group discussions and questionnaire (these questions are both quantitative and qualitative). Secondary data sources, mainly covered government publications, technical document and annual reports of the cellular service companies. An essential preparation for the interviews was provided by the different sources. Secondary data helped to cross-check official information, learn about major event, technical details, historical decisions and main organizational players and roles. They also supported the exploring of particular responses during interviews.
QUESTIONNAIRE:
A questionnaire was a research instrument consisting of a series of questions and other prompts for the purpose of gathering information from respondents. Although they were often designed for statistical analysis of the responses, that was not always the case. The factors that affected for the less channeling to usage of hutch mobile service provider have been tried to obtain following information by using a questionnaire. There are various factors influencing the buying behavior of consumer such as social, cultural, personal and psychological.”Asifo Shah, 2010”.
Social factors: Social factors were referred to forces that other people exert and which affect consumer buying behavior. These social factors can be culture and subculture (religions, nationalities, geographic regions, racial groups etc.), roles and family, social class and reference groups. Two types of closed-ended questions were used for this research. One type of closed-ended question was a “dichotomous” question which allowed respondents to choose one of two answer choices (e.g. Yes or No), while another type was the “multi-dichotomous” question, which allowed respondents to choose one of many answer choices.
and personality. Ranked/Ordinal questions, Closed-ended questions and Matrix & Rating questions were used for this research.
Personal factors: Those aspects that were unique to a person and influence purchase behavior have been included in here. Demographic factors, lifestyle and situational factors have been included. Both open-ended and closed-ended questions were used for this research.
SELECT THE SAMPLING FRAME AND SAMPLING UNITS:
The population was needed to define at first by a completed set of all possible observations. Then selected population was needed to investigate before beginning the survey. Clear picture of the population was needed. The population of this study was Matara District in Sri Lanka. The elements of population were called as sampling units. In this research, the sampling unit was an individual person in the Matara District in Sri Lanka (people who could use a mobile connection). A list of all the sampling units belonging to the population was to be studied with their identification particulars or a map showing the boundaries of the sampling units were known as sampling frame.
SAMPLE SELECTIVITY:
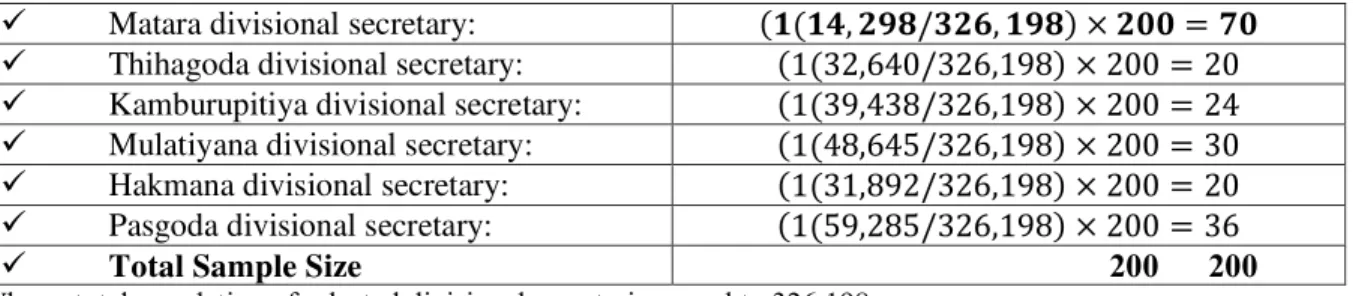
The population of the Matara district was, 814,048. “Census of Population and Housing, 2012”. The province consists of the three major districts divided into a total of 44 divisional secretariats. 16 of these divisional secretariats are classified as Matara district. A sample size of 200 from the target population was used for the study. The total sample of the study group was derived using the following method.
Table 1: Sample Selection Method
Matara divisional secretary: , / , × =
Thihagoda divisional secretary: , / , × =
Kamburupitiya divisional secretary: , / , × =
Mulatiyana divisional secretary: , / , × =
Hakmana divisional secretary: , / , × =
Pasgoda divisional secretary: , / , × =
Total Sample Size 200 200
Where; total population of selected divisional secretaries equal to 326,198.
ANALYZING TOOLS:
Logistic regression analysis was used for the analysis of the data (MINITAB, version 14). Logistic regression analysis was used to measure the relative impact of the selected independent variables on Hutch mobile service utilization.
RESULTS AND FINDINGS:
HYPOTHESIS:
H1: There is an association between hutch usage and selected variable Table 2: Hypothesis of Model
Hypothesis P-Value Decision Conclusion
H1a: 0.000 Reject H0 There is a significance association between hutch usage and education level
H1b: 0.430 Do not reject H0 There is not a significance association between hutch usage and hutch package
H1c: 0.000 Reject H0 There is a significance association between hutch usage and level of knowledge hutch facility
H1d: 0.144 Do not reject H0 There is not a significance association between hutch usage and foreign call facility
H1e: 0.215 Do not reject H0 There is not a significance association between hutch usage and within network price
H1f: 0.000 Reject H0 There is a significance association between hutch usage and new schemes and up graduation
H1g: 0.000 Reject H0 There is a significance association between hutch usage and network problems
H1h: 0.000 Reject H0 There is a significance association between hutch usage and other network prices
H1i: 0.000 Reject H0 There is a significance association between hutch usage and occupation
H1j: 0.000 Reject H0 There is a significance association between hutch usage and internet facility
H1k: 0.000 Reject H0 There is a significance association between hutch usage and socio economic level
H1l: 0.000 Reject H0 There is a significance association between hutch usage and working status
H1m: 0.000 Reject H0 There is a significance association between hutch usage and monthly expenditure
H1n: 0.096 Do not reject H0 There is not a significance association between hutch usage and network coverage
H1o: 0.088 Do not reject H0 There is not a significance association between hutch usage and brand name or publicity
H1p: 0.093 Do not reject H0 There is not a significance association between hutch usage and customer care facility
H1q: 0.097 Do not reject H0 There is not a significance association between hutch usage and monthly rental
H1r: 0.000 Reject H0 There is a significance association between hutch usage and hidden charges
H1s: 0.000 Reject H0 There is a significance association between hutch usage and suitable plan for age groups
H1t: 0.000 Reject H0 There is a significance association between hutch usage and VAS
H1u: 0.000 Reject H0 There is a significance association between hutch usage and no: of CCSC
H1v: 0.328 Do not reject H0 There is not a significance association between hutch usage and seasonal pricing
H1w: 0.161 Do not reject H0 There is not a significance association between hutch usage and better features offered by competitor
H1x: 0.000 Reject H0 There is a significance association between hutch usage and recharge availability
H1y: 0.000 Reject H0 There is a significance association between hutch usage and cost per minute
After selecting independent variable, first of all, a multicollinearity situation between uses each selected independent variable was needed to be checked. In this data set all independent variables called as a categorical variable. According to this reason, contingency coefficient for each pair of selected independent variables must be calculated. In some pairs, the contingency coefficient value was greater than 80% as this pair was highly related with each other. This variable must be dropped in the model. According to this data set educational level, socio-economic level, working status and monthly expenditure variables were dropped in the model.
According to this data set only four variables dropped. The reason is contingency coefficients is higher than the 80%. But other independent variables are not high contingency coefficients. According to this situated binary logistic regression including variables are hutch knowledge, new schemes or up graduation, network problems, other network prices, occupation, internet facility, hidden charges, suitable plan for age group, value added service, no: of customer care service centers, availability of recharge facility of hutch and cost per minute.
FINAL FITTED MODEL:
�� �̂ = − . + . ∗ + . ∗ + . ∗ �
+ . ∗ ℎ��ℎ + . ∗ ℎ��ℎ + . ∗ ℎ��ℎ + . ∗
+ . ∗ + . ∗ ℎ��ℎ
Table 3: Final Fitted Model
Parameters B S.E. Wald df Sig. Exp(B) Ref.
New Schemes 16.370 0.003 very high
Very poor 5.989 1.515 15.631 0.1526 0 398.97
Poor 5.861 1.898 9.541 0.1368 0.002 351.17
Moderate 3.942 1.829 4.648 0.0227 0.031 51.54
High 5.470 2.053 7.102 0.0968 0.008 237.44
Network Problems 10.745 0.030 very low
Low 0.056 1.842 0.001 0.0005 0.976 1.06
Moderate 4.257 2.453 3.012 0.0309 0.083 70.60
High 3.869 1.578 6.012 0.0212 0.014 47.90 Very High 3.703 1.363 7.380 0.0180 0.007 40.57
Hutch Knowledge 9.566 0.048 very high
Very poor 4.088 1.522 7.215 0.0262 0.007 355.16
Poor 5.657 2.615 4.680 0.1145 0.031 286.23
Moderate 1.608 1.285 1.566 0.0022 0.211 145.00
High 5.873 2.253 6.795 0.1382 0.009 59.60
Constant -7.703 2.113 13.289 0.0005 0 0
Source: Sample Survey Data Set (Immunization.sav)
The odds of not refer the hutch mobile connection of a person who think new schemes or up graduation of the hutch was very poor 399 times the odds of not refer the hutch mobile connection to a person who think new schemes or up graduation of the hutch was very high. That means the odds of not refer the hutch mobile connection to a person who think new schemes or up graduation of the hutch was very poor 15% higher than the odds of not refer the hutch mobile connection to a person who think new schemes or up graduation of the hutch was very high.
The odds of not refer the hutch mobile connection of a person who think network problems of hutch was high 48 times the odds of not refer the hutch mobile connection to a person who think network problems of the hutch was very low. That means the odds of not refer the hutch mobile connection to a person who think network problems of hutch was moderate 2% higher than the odds of not refer the hutch mobile connection to a person who think network problems of the hutch was very low.
The odds of not refer the hutch mobile connection of a person who has a poor knowledge of hutch facility was 355 times the odds of not refer the hutch mobile connection to a person who has a very high knowledge of the hutch facility. That means the odds of not refer the hutch mobile connection to a person who has a poor knowledge of the hutch facility was 3% higher than the odds of not refer the hutch mobile connection to a person who has a very high knowledge of the hutch facility.
The odds of not refer the hutch mobile connection of a person who has a high knowledge of hutch facility was 59 times the odds of not refer the hutch mobile connection to a person who has a very high knowledge of the hutch facility. That means the odds of not refer the hutch mobile connection to a person who has a high knowledge of the hutch facility was 14% higher than the odds of not refer the hutch mobile connection to a person who has a very high knowledge of the hutch facility.
REASONS FOR SWITCHING TO THE OTHER MOBILE CONNECTION:
This section has been included references to the factors that affected for the switching hutch mobile connection into another mobile connection.
Figure 1: Switching Hutch into another mobile Connection
Source: Sample Survey Data Set (Hutch.sav)
According to the figure 1 represents approximately 90% of the hutch users switching hutch into other mobile connections. It has clearly cited that among the hutch users, approximately 10% of the users were still using hutch mobile connection.
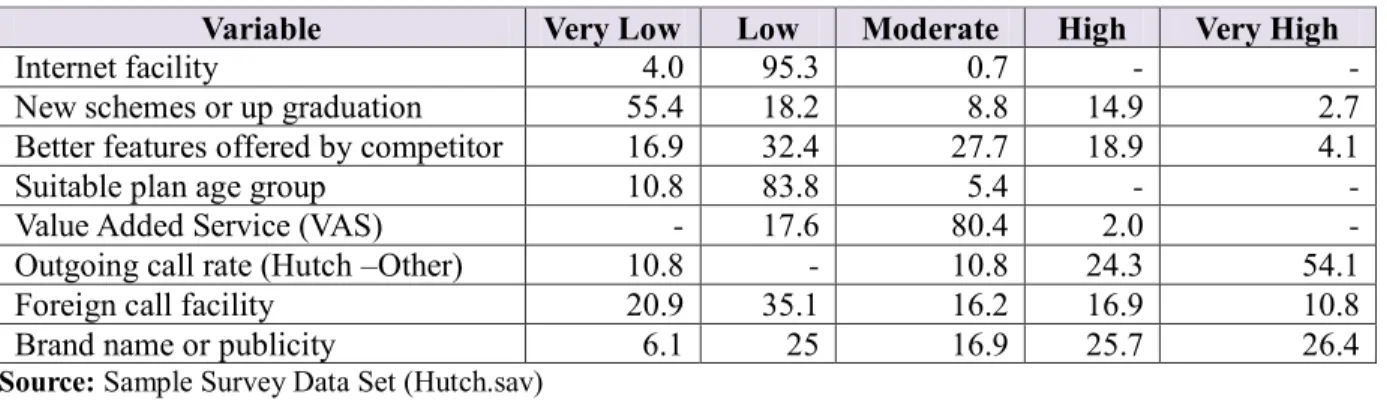
Table 4: Reasons for switching hutch into another mobile connection
Variable Very Low Low Moderate High Very High
Internet facility 4.0 95.3 0.7 - -
New schemes or up graduation 55.4 18.2 8.8 14.9 2.7
Better features offered by competitor 16.9 32.4 27.7 18.9 4.1
Suitable plan age group 10.8 83.8 5.4 - -
Value Added Service (VAS) - 17.6 80.4 2.0 -
Outgoing call rate (Hutch –Other) 10.8 - 10.8 24.3 54.1
Foreign call facility 20.9 35.1 16.2 16.9 10.8
Brand name or publicity 6.1 25 16.9 25.7 26.4
Source: Sample Survey Data Set (Hutch.sav)
Use Hutch 11%
Switching Hutch
89%
Among the people who switched hutch mobile connection into another mobile connection, approximately 70% respondents who said the hutch mobile connection had a very good brand name and publicity. Even though, it was such a fact, many more hutch users were switching to another mobile connection.
According to the table 4 represents 7 risk factors for switching hutch mobile connection into another mobile connection. There were internet facilities, new schemes or up graduation, better features offered by competitors, suitable plan for age group, value added service, outgoing call rate (hutch to another connection) and foreign call facility.
Internet facility: Among the people who switched hutch mobile connection into another mobile connection, over 99% said that internet facility of hutch mobile connection was very poor quality. New schemes or up graduation: Among the people who switched hutch mobile connection into another mobile connection, approximately 75 % said that level of introduction of new schemes or up graduating in the hutch mobile connection was very poor. Better features offered by competitors: Among the people who switched hutch mobile connection into another mobile connection, approximately 50% said that hutch mobile connection had not offered better features compared to the other mobile connection competitors. Suitable plan for age group: Among the people who switched hutch mobile connection into another mobile connection, approximately 95% said that hutch mobile connection had not offered a suitable plan for relevant age groups. Value Added Service (VAS): Among the people who switched hutch mobile connection into another mobile connection, approximately 80% said that value added service of hutch mobile connection was moderate level. Outgoing call rate (hutch–Other): Among the people who switched hutch mobile connection into another mobile connection, approximately 80% said that outgoing call rates of hutch mobile connection to other mobile connection was at a high level. Foreign call facility: Among the people who switched hutch mobile connection into another mobile connection, over 55% said that foreign call facility in hutch mobile connection was very poor level.
USAGE OF DIFFERENT MOBILE CONNECTION IN MATARA DISTRICT:
This section has been included references to the Usage of different mobile connection in Matara district.
Figure 2: Most preferred Service Provider in Matara District
Source: Sample Survey Data Set (Hutch.sav)
The figure 2 represents a dialog mobile connection which infers that was the most preferred service provider in Matara district. It recaptured 37.5% market share among the total market share in the mobile communication industry in Matara district. The mobile communication market was dominated
9.5
37.5
23
17.5
12.5
0 5 10 15 20 25 30 35 40
Hutch Dialog Mobitel Etisalat Airtel Service Provider
Most preferred Service Provider in Matara District
by Dialog with a subscriber market share of 37.5%, followed by Mobitel with 23%, Etisalat at 17.5%, Airtel at 12.5% and Hutch with the minimum market share in the Matara district 9.5%.
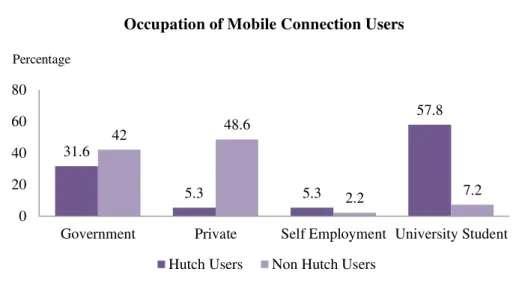
Figure 3: Occupation of Mobile Connection Users
Source: Sample Survey Data Set (Hutch.sav)
According to the figure 3 represents 57.8% of the hutch mobile connection users were university students and 31.6% of the hutch mobile connection users are government sector employees.
DISCUSSION:
The objective of this study was to find out whether the demand rates of hutch mobile connection were similar or different from other mobile connections and what were the reasons for that. The objective was helpful in providing a clear picture as to what service provider was a bigger issue in Matara district in Sri Lanka and what were the reasons behind for the minimum market share holder of mobile communication service providers in Matara district, Sri Lanka. A number of major influential factors that affected for the less channeling to the hutch mobile connection in Matara district, Sri Lanka were examined through this research study. The study highlighted less market share for hutch mobile connection in Matara district, Sri Lanka. In the present study, hutch mobile connection demand rate among peoples in the Matara district, Sri Lanka, was found to be 9.5%. The principal factors affecting the hutch usage of these people in terms of magnitude were new schemes or up graduation of the hutch mobile connection, network problems of the hutch mobile connection and level of knowledge about the facilities of the hutch mobile connection.
CONCLUSIONS:
Following results/ findings were based on factors that affected for the switching hutch mobile connection into another mobile connection in Matara district, Sri Lanka.
According to the present study among people who used hutch mobile connection 90% of them were found to have been switching hutch into another mobile connection.
Over 70% respondents said the hutch mobile connection has a very good brand name and publicity was found according to the research study. However, more hutch users switching to another mobile connection. According to the results of study, have been 7 risk factors for switching hutch mobile connection into another mobile connection were found. There were poor internet facilities, low level of new schemes or up graduation, low level of better features offered by competitor, low level of suitable plan for age group, poor value added service, high level of outgoing call rate (hutch – another connection) and poor quality of the foreign call facility.
Following results/findings were based on factors that affected for the less channeling to the hutch mobile connection in Matara district, Sri Lanka.
31.6
5.3 5.3
57.8
42 48.6
2.2 7.2
0 20 40 60 80
Government Private Self Employment University Student
Occupation of Mobile Connection Users
Hutch Users Non Hutch Users
The mobile communication market was dominated by Dialog with a subscriber market share of 37.5%, followed by Mobitel with 23%, Etisalat at 17.5%, Airtel at 12.5% and Hutch with the minimum market share in the Matara district 9.5%.
According to the results of study, have been 9 factors for the less channeling to the hutch mobile connection were found. There were an approximately 60% of the hutch mobile connections were university students, network coverage in hutch connection was at a satisfactory level, internet facility of the hutch was not at a satisfactory level, call rates for hutch to another was comparatively high, knowledgeable people about hutch were very low, new schemes or up gradation of the hutch mobile connection were at a very poor level, network problems of the hutch mobile connection were very high, foreign call facility of hutch mobile connection was unsatisfactory and hidden charges of the hutch mobile connection were comparatively high.
REFERENCES:
[1] Agresti, A. (2007). An Introduction to Categorical Data Analysis (Second Edition ed.). John Wiley and Sons, Inc.
[2] Asifo, S. (2010). Factors Affecting Consumer Behavior.
[3] CBSL. (2005). Annual Report. Colombo: Central Bank of Sri Lanka. [4] CBSL. (2006). Annual Report. Colombo: Central Bank of Sri Lanka. [5] CBSL. (2010). Annual Report. Colombo: Central Bank of Sri Lanka. [6] CBSL. (2014). Annual Report. Colombo: Central Bank of Sri Lanka.
[7] CBSL. (2014). Sri Lanka Socio-Economic Data. Colombo: Central Bank of Sri Lanka.
[8] Derek, T. (2010). International Students’ Lived Experiences Seeking ICT Assistance. Educational Technology and Design, University of Saskatchewan.
[9] Dialog. (2012). Annual Report. Colombo: Dialog (Axiata). [10]Etisalat. (2012). Annual Report. Colombo: Etisalat.
[11]Fox, J. (2000). Multiple and Generalized Nonparametric Regression. Sage Publications.
[12] GSR. (2012). Why regulate in a Networked Society? 12th Global Sympossium for Regulators. Colombo. [13] Housing, S. L. (2012). Census of Population and Housing Final Report –Southern Province. Retrieved from
http://www.statistics.gov.lk/PopHouSat/CPH2011/index.php?fileName=Southern&gp=Activities&tpl=3 [14]Jayasooriya, S., & Knight John, M. (2004). Sri Lanka: From Telecommunications Privatization to
anti-competition?
[15]John, F. (1998). Mathematical Statistics (Fifth ed.). New Delhi: Prentice Hall of India Pvt. Ltd. [16]Kalavani, B. (2006). Consumer's Attitude towards Cell Phone Services .
[17]Kambisis, C. (2003). Telecom Advertising in Print Media.
[18]Koutsoyiannis, A. (2008). Theory of Econometrics (Second ed.). Palgravemacmillan, Inc.
[19]Lee, Richard, Murphy, & Jamie. (2005). From Loyalty to Switching: Exploring Determinants in the Transition. ANZMAC 2005. Perth, Australia.
[20]Lopez, J. P., Yolanda, P. R., & Javier, F. S. (2006). The impact of Customer relationship characteristics on customer switching behavior: Differences between switchers and stayers, Managing Service Quality. 16 (6), 556-574.
[21]Mitja, P. (2006). Mobile Service and Phone as Consumption System The Impact on Customer Switching. Spain: Universitat PompeuFabra.
[22]Mohammed, S. I., Munir, H., & Rumman, H. (2008). An Assesment of the Impact of Green Messages on the Audience of Dhaka City.
[23]Naman, S. (2008). Critically analyze the customer preference and satisfaction measurement in Indian Telecom Industry, IIPM Ahmadabad. IIPM .
[24]Oyeniyi, Omotayo, & Abiodun, A. J. (2008). Customer service in the retention of mobile phone users in Nigeria. African Journal of Business Management, 2 (2), 26-31.
[25]Peter, E. (2012). Sri Lanka - Telecoms, Mobile, Broadband and Forecasts. BuddeComm Journal,
1 (18), 1-93.