Atmospheric pollution effects on childhood
health: an environmental study in the
Paraíba Valley
Efeitos da poluição atmosférica na saúde
infantil: um estudo ecológico no Vale do
Paraíba
Luiz Fernando C. Nascimento 1
Maria Carolina C. Módolo 2
João A. Carvalho Jr. 3
1,2Departamento de Medicina. Universidade de Taubaté. Avenida Tiradentes, 500. Taubaté, SP, Brasil. CEP: 12.030-180. E-mail: lfcn@unitau.br
3Departamento de Energia. Universidade Estadual Paulista "Júlio de Mesquita Filho". Campus de Guaratinguetá. Guaratinguetá, SP, Brasil.
Abstract
Objectives: to estimate correlation between atmos-pheric pollutants and the number of children admis-sions by respiratory disease in the year 2001.
Methods: this is an ecological study of time series. The data on the atmospheric pollutants were obtained at CETESB and the data on hospital admissions were obtained at the Medical Archive Service of the Taubaté University Hospital, in Taubaté. In order to study the correlation of pollutants concentration values between themselves and with the admissions, the Pearson correlation technique was utilised. The rela-tive risks for admission by respiratory disease were estimated comparing the quartiles of the pollutant agents with values of the first quartile. The adopted statistical significance was alpha = 5%.
Results: one hundred and fifty eight children were admitted with respiratory disease in the year 2001 (30% of annual admissions). The pollutants were related between themselves. There was a positive cor-relation between the number of admissions and the concentrations of sulphur dioxide and particulate ma-terial. There was an increase of 25 % in the admission risk when comparing the fourth and the first quartiles.
Conclusions: there was positive correlation between admission by respiratory disease and the concentra-tion of atmospheric pollutants.
Key words Air pollution, Respiratory tract disease, Environmental health, Child health
Resumo
Objetivos: estimar as correlações entre os níveis de poluentes atmosféricos e o número de internações por doença respiratória em crianças, em hospital uni-versitário.
Métodos: trata-se de um estudo ecológico de série temporal. Os dados sobre poluentes atmosféricos foram obtidos junto à CETESB e os dados sobre in-ternação hospitalar, junto ao SAME do Hospital Uni-versitário de Taubaté, Brasil. O estudo se refere a da-dos e internação do ano de 2001. Para estudar as correlações dos valores dos poluentes entre si e entre as internações, utilizou-se da técnica de correlação de Pearson. Foram estimados os riscos relativos para internação por doença respiratória comparando os quartis dos agentes poluentes com os valores do primeiro quartil. A significância estatística adotada foi alfa = 5%.
Resultados: foram internadas 158 crianças com doença respiratória no ano de 2001 (30% do total de internações no ano). Os poluentes estiveram correla-cionados entre si e houve correlação positiva, entre o número de internação e dióxido de enxofre e material particulado; houve aumento de 25% no risco de in-ternação comparando o quarto quartil e o primeiro quartil.
Conclusões: houve correlação positiva entre número de internações por doenças respiratórias e poluentes atmosféricos.
Introduction
The contamination of the atmosphere by human ac-tivities has been occurring for almost 500 years. Considering that the atmospheric pollutants reach the individual mostly by breathing, it is expected that their main effects be in the respiratory tract.
Exposure to environment pollutants is recog-nised as an important factor for children hospital ad-missions,1school absence,2intra-uterine mortality,3
and even congenital malformation.4Sulphur dioxide
(SO2), ozone (O3) and particulate material with
aero-dynamic diameter lower than 10 mm (PM10) are among the most hazardous pollutants.
Sulphur dioxide is known as a respiratory tract irritant which causes decrease of lung function5and
even pulmonary necrosis in animals.6It was recently
shown that increase of SO2levels yielded increase
of pneumonia and flu cases in the elderly.7The main
sources for this pollutant are coal and petroleum derivatives. Sulphur dioxide is easily absorbed in the upper respiratory tracts and it deposits in the lower portion of these tracts and in the pulmonary parenchyma.
Ground level ozone results from photochemical reactions between nitrogen oxides, provided by oxi-dation of the nitrogen present in the air and/or in the fuel, and solar radiation.8Ozone can cause decrease
of the lung function, lung inflammation and it can reach lung alveoli.5 The pollutant is also a very
strong oxidiser and, as such, it can participate in inner and outer cellular reactions, involving enzymes which are important for metabolism.
Particulate material originates mainly from the burning of fossil fuels It can have a half life ranging from days to years, and it is associated with increases of respiratory symptoms and diseases in children, and worsening of asthma cases.9,10More recently,
this pollutant has been shown to be associated with low birth weight11and infant mortality12The
particu-late material can also reach the alveolli thinnest res-piratory tracts.
One of the effects of the atmospheric pollution on childhood health is the increase of hospital admissions by respiratory diseases.13There is correlation
bet-ween the lowest temperatures and hospital admis-sions.
The objective of this work is to estimate the cor-relation between the level of atmospheric pollutants and the number of children admissions by
respirato-Methods
This is an ecological study of time series, where all children hospital admissions were counted for chil-dren up to seven years of age. The period was Ja-nuary 1 to December 31, 2001. The total number of admissions for this age group was also identified. The data were obtained at the hospital Medical Archive Service (SAME).
The unit was the University Hospital of Taubaté, Brazil. The city of Taubaté is located at 120 km East of São Paulo and its population is on the order of 250,000 inhabitants. Taubaté locates between Man-tiqueira and Sea Mountain; the wet climate included November to March months and the temperatures can be so higher as 35º C. In winter the minimal temperatures are near to 10º C. Its geographic situa-tion is 24º South latitude and 44º West longitude.
The respiratory diseases considered in this work are those corresponding - in the International Classi-fication of Diseases,1410threvision, to the group
di-agnostics J12 to J22, J45 and J46. The number of hospital admission by respiratory diseases was the dependent variable.
Daily data of humidity, in percents, and tempera-ture, in Celsius degrees, and of the pollutants SO2, O3and PM10concentrations were obtained at the São Paulo State Environmental Agency (CETESB) section of Taubaté were the independent variables.
For all the three pollutants, data collection started during the first hour of the day and encompassed 24 hours. Concentrations were determined in mg/m3.
Concentrations of PM10, SO2and O3were measured using the monitor beta, coulometry, and chemilumi-nescence techniques, respectively.
There were built three days mobile averages to pollutants to estimate its effect on hospital admis-sion. There were built tables with one day lag and two days lag to number of hospital admission and estimated the correlation between these values and the independent variables.
The correlation between the variables was esti-mated by the Pearson correlation coefficient.
Results
There were 526 children hospital admissions in 2001. One hundred and fifty eight hospital admis-sion (30%) were due to respiratory diseases. The lat-ter corresponds to a daily average of 0.58 admission (dp = 0.79), varying between 0 and 4 admissions per day.
Table 1 presents the number of admissions, the humidity, the temperatures, and the SO2, O3 and PM10 concentrations, with their respective standard deviations and interval amplitudes.
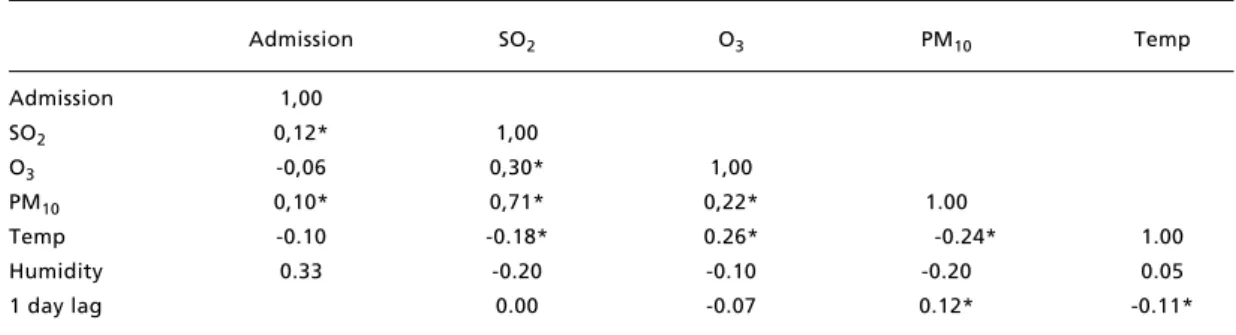
Table 2 presents the correlation matrix between the variables, with the respective p. It can be ob-served that there was correlation of the pollutants concentrations between themselves. Also, there was correlation between SO2and PM10concentrations
and the number of hospital admissions. It can observed the correlation between the pollutants and one day lag. It was found a positive correlation be-tween temperature and PM10with hospital admission
one day lag (p<0.05). There were not correlation between other pollutants, humidity, and mobile ave-rage and hospital admission.
Table 1
Mean values, standard deviations and interval amplitudes for daily hospital admissions and SO2, O3 e PM10
concentrations.
Mean value Standard deviation Amplitude
Admissions (per day) 0.58 0.79 0 - 4
SO2(363)*, µg/m3 5.9 3.6 1.0 - 34.0
O3(363), µg/m3 66.3 24.3 10.0 - 139.0
PM10 (358), µg/m3 37.7 20.4 10.0 - 150.0
Temperature (363), 0C 19.6 2.9 4.4 - 34.4
Humidity (362),% 84.0 8.4 47.1 - 98.5
* The figures between parentheses correspond to the total number of days in which the respective pollutant concentration was measured.
Table 2
Matrix of correlation between the variables and the respective p.
Admission SO2 O3 PM10 Temp
Admission 1,00
SO2 0,12* 1,00
O3 -0,06 0,30* 1,00
PM10 0,10* 0,71* 0,22* 1.00
Temp -0.10 -0.18* 0.26* -0.24* 1.00
Humidity 0.33 -0.20 -0.10 -0.20 0.05
1 day lag 0.00 -0.07 0.12* -0.11*
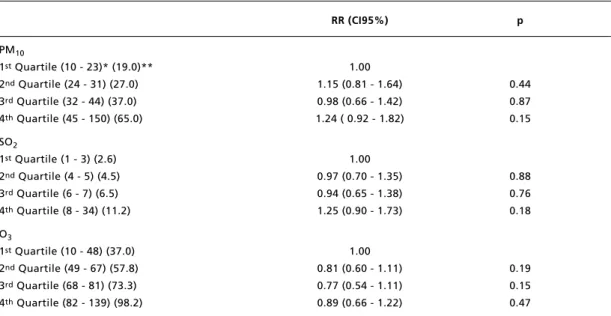
Table 3 shows the relative risks between the se-cond, third and fourth quartiles for hospital admis-sions according to each pollutant considered in this study, comparing with data of the first quartile. It can be observed that an increase of 46 µg/m3of
particu-late material increases in 24 % the risk of hospital admission for the paediatric population of this study. An increase of 8.5 µg/m3of sulphur dioxide increases
in 25 % the risk of admission for the same popula-tion. It should be pointed out that these data do not
present statistical significance, possibly because of the small sample size.
Figures 1-4 show the daily distribution of tem-perature and the pollutants concentration. Increase of SO2and PM10concentrations occurred between
days 150 and 210, which correspond to the coldest months in the region. There is no observed trend for the ozone concentration distribution because the ori-gin of this pollutant is not associated to low tempera-tures.
Table 3
Relative risk (RR), for a confidence interval of 95% (CI95 %) for admissions, according to the pollutants quartiles, and respective p.
RR (CI95%) p
PM10
1stQuartile (10 - 23)* (19.0)** 1.00
2ndQuartile (24 - 31) (27.0) 1.15 (0.81 - 1.64) 0.44 3rdQuartile (32 - 44) (37.0) 0.98 (0.66 - 1.42) 0.87
4thQuartile (45 - 150) (65.0) 1.24 ( 0.92 - 1.82) 0.15
SO2
1stQuartile (1 - 3) (2.6) 1.00
2ndQuartile (4 - 5) (4.5) 0.97 (0.70 - 1.35) 0.88
3rdQuartile (6 - 7) (6.5) 0.94 (0.65 - 1.38) 0.76 4thQuartile (8 - 34) (11.2) 1.25 (0.90 - 1.73) 0.18
O3
1stQuartile (10 - 48) (37.0) 1.00
2ndQuartile (49 - 67) (57.8) 0.81 (0.60 - 1.11) 0.19 3rdQuartile (68 - 81) (73.3) 0.77 (0.54 - 1.11) 0.15 4thQuartile (82 - 139) (98.2) 0.89 (0.66 - 1.22) 0.47
Figure 1
Daily distribution of ozone (µg/m3) during 2001.
DOY = day of the year 160
140
120
100
80
60
40
20
0
-20
0 30 60 90 120 150 180 210 240 270 300 330 360
O3
(micrograma/m
)
3
DOY
Figure 2
Daily distribution of PM10(µg/m3) during 2001.
DOY = day of the year
180
140
100
60
20
-20
0 30 60 90 120 150 180 210 240 270 300 330 360
PM
10
(micrograma/m
)
3
Figure 3
Daily distribution of SO2 (µg/m3) during 2001.
DOY = day of the year
40
35
30
25
20
15
10
5
0
-5
0 30 60 90 120 150 180 210 240 270 300 330 360
SO
2
(micrograma/m
)
3
DOY
Figure 4
Daily distribution temperature (0C) during 2001.
DOY = day of the year
30
20
22
18
14
6 0
TEMPERATURE
(degree
Celsius)
DOY 10
Discussion
The dissemination, through scientific articles, of problems caused by atmospheric pollution in human health, especially in children, has contributed to a great extent for the control and decrease of emission of the associated pollutants. Pollution can affect healthy people and those who have history of pre-vious diseases, and it may act as a responsible agent in the disease process. Studies of time series have shown the correlation between the level of pollutants and the number of hospital admissions by respirato-ry diseases.1,3
An important aspect that needs to be considered is the inexistence of studies on the effects of atmos-pheric pollution on health conducted in centres out-side the geographical sphere of the metropolitan São Paulo.
This study showed the distribution of the pollu-tants according to seasonal aspects and also the posi-tive correlation, with statistical significance, of PM10
and SO2atmospheric concentrations with the
num-ber of children hospital admissions. The values pre-sented here agree with those prepre-sented in other stu-dies.1,13
A difficulty of ecological studies for which the geographical region is defined is that it is unknown if the individual acquired the disease in the same re-gion of the study and if the disease was really caused by the pollutant agents under consideration. There is a high degree of reliability in the data presented here because they were obtained in a University Hospital. There are other questions with no direct answer: not every person that acquires a respiratory disease looks for medical services and not every one that looks for medical services is admitted in the hospi-tal. Therefore, the parcel admitted in the hospital represents a fraction of those who were really sick.15
The positive correlation found in this work for the number of admissions and the levels of concen-trations of SO2and PM10were also reported in other
studies. Also, the lowest temperatures have an im-portant role with respect to medical admissions. The levels of these pollutants in this work were lower than those observed by Braga et al.,13who
conduct-ed his work with data of the São Paulo metropolitan region. Another fact was the correlation between hospital admission with a lag in PM10level; this pol-lutant has a direct effect and an effect one day after the exposure. So, several hospital admission oc-curred by PM10level of anterior day.
Regarding the ozone, there was no correlation of the pollutant level with the number of hospital ad-missions. The average values observed are similar to those presented by Braga et al.13 This pollutant
showed concentration peaks in hot periods as well as in cold periods. This fact is explained by the higher level of solar radiation during the summer days and by the higher stability of oxidant precursors in the atmosphere during the winter days due to worse con-ditions for dispersion. Ozone has been shown to be associated to asthma,9coughing crises,16and decay
of lung function.17
It can be observed that an increase in the concen-tration of SO2of 8.5 µg/m3increases the risk for
hospital admission by respiratory disease in about 25%. The same happens for an increase in the concen-tration of PM10of 46 µg/m3. However, these relative
risk values for hospital admission did not present sta-tistical significance, probably due to the sample size. It is important to point out that the pollutants are not generated only in the region of Taubaté, but also in other centres. The pollutants generated in the metropolitan São Paulo can, depending on wind con-ditions, reach distances up to 300 km. As Taubaté is located in a valley in which and the usual winds blow from west to east, may "import" these pollu-tants.10
Regarding the analysis technique utilised in this work, if there were a larger time series with two or three year records, there would be the possibility of using the Poisson regression, in view of the fact that the present data are considered rare events, models with moving averages, and auto regressive models, because these models are more adequate for larger time series.
Acknowledgment
The authors are grateful to CETESB, who furnished data about pollutant records. Luiz Fernando C. Nascimento acknowledges to Fundação para o De-senvolvimento da UNESP (FUNDUNESP) (grant number 1032/04).
References
1. Lin CA, Martins MA, Farhat SCL, Pope CA III, Conceição GMS, Anastacio VM, Hatanaka M, Andrade WC, Hamaue WR, Böhm GM, Saldiva PHN. Air pollution and respiratory illness of children in São Paulo, Brazil. Paediatr Perinat Epidemiol 1999; 13: 475-88. 2. Park H, Lee B, Há EH, Lee JT, Kim H, Hong YC
Associa-tions of air pollution with school absenteeism due to ill-ness. Arch Pediatr Adolesc Med 2002; 156: 1235-9. 3. Pereira LAA, Loomis D, Conceição GMS. Braga ALF,
Ar-cas RM, Kishi H, Singer JM, Böhm GM, Saldiva PHN. Association between air pollution and intrauterine mor-tality in São Paulo, Brazil. Environ Health Perspect 1998; 106: 325-9.
4. Ritz B, Yu F, Fruin S, Chapa G, Shaw GM, Harris JA. Am-bient air pollution and risk of birth defects in southern California. Am J Epidemiol 2002; 155: 17-25. 5. Committee of the Environmental and Occupational Health
Assembly of the American Thoracic Society. Health ef-fects of outdoor air pollution: state of the art. Am J Respir Crit Care Med 1996; 153 :3-50.
6. Giddens WE, Fairchild GA. Effects of sulfur dioxide on the nasal mucosa of mice. Arch Environ Health 1972; 25: 166-73.
7. Martins LC, Latorre MRDO, Cardoso MRA. Gonçalves LFT, Saldiva PHN, Braga ALF. Poluição atmosférica e atendimentos por pneumonia e gripe em São Paulo, Brasil. Rev Saúde Pública 2002; 36: 88-94.
8. Carvalho JA, Lacava PT. Óxidos de nitrogênio (NOx). In: Carvalho JA, Lacava PT. Emissões em processos de combustão. São Paulo: UNESP; 2003.
9. Abbey DE, Petersen F, Mills PK, Beeson WL. Long-term ambient concentrations of total suspended particulate ozone, and sulfur dioxide and respiratory symptoms in a non-smoking population. Arch Environ Health 1993; 48: 33-46.
10. Fioravante C. Estufa que exporta poluição. Pesq Fapesp 2002; 71: 28-35.
11. Bobak M. Outdoor air pollution, low birth weight, and pre-maturity. Environ. Health Perspect 2000; 108: 173-6. 12. Loomis D, Castillejos M, Gold DR, McDonnell W,
Borja-Aburto VH. Air pollution and infant mortality in Mexico City. Epidemiology 1999; 10: 118-23.
13. Braga ALF, Conceição GMS Pereira LAA, Kishi HS, Pereira JCR, Andrade MF, Gonçalves LFT, Saldiva PHN, Latorre MRDO. Air pollution and pediatric respi-ratory hospital admissions in São Paulo, Brazil. J Envi-ron Med 1999; 2 95-102.
14. WHO (World Health Organization). International statisti-cal classification of diseases and related health problems. 10th rev. Geneve: The Organization; 1997.
15. Lebrão ML. Evolução da morbidade hospitalar - Vale do Paraíba 1975/1988 [tese de livre-docência]. São Paulo: Faculdade de Saúde Pública da Universidade de São Paulo; 1994.
16. Schwartz J, Dockery DW, Neas LM, Wypij D, Ware JH, Spengler JD, Koutrakis P, Speizer FE, Ferris BG. Acute effects of summer air pollution of respiratory symptom reporting in children. Am J Respir Crit Care Med 1994; 150: 1234-42.