PEER-REVIEWED ARTICLE
bioresources.com
Physical Properties of Tannin/Furanic Resin Foamed
With Different Blowing Agents
Xinjun Li,a,* Antonio Pizzi,a,* Clément Lacoste,a Vanessa Fierro,b and Alain Celzard b Tannin/furanic rigid foam made from raw materials of natural origin could
be used to replace polyurethane and phenolic foams in many future applications. In this study, diethyl ether, pentane, and a mixture of the two were used to prepare tannin/furanic foams having different microstructures. It was found that the bulk density of the foam could be significantly extended, up to 180 kg/m3. The cell size of the pentane foam was larger than that of diethyl ether foam with comparable density; however, both presented a sudden increase in cell size when the density decreased. The thermal conductivity and mechanical properties were determined for the two foam types at the same density but different cell size. The minimum thermal conductivity for diethyl ether and pentane foams were presented, along with a suggested method for lowering the thermal conductivity of such foam. Additionally, the results of mechanical tests indicate that cell size does not play a role in compressive strength.
Keywords: Tannin/furanic rigid foam; Different blowing agents; Cell size; Thermal conductivity; Mechanical property
Contact information: a: LERMAB-ENSTIB, University of Lorraine, Epinal 88000, France; b: IJL-ENSTIB, University of Lorraine, Epinal 88000, France; *Corresponding authors:
antonio.pizzi@enstib.uhp-nancy and ixinjunli@gmail.com
INTRODUCTION
Foams based on metals, ceramics, polyurethane, phenolic resin, polyolefin, etc., are commercial materials of increasing interest (Kim et al. 2005; Chen et al. 2006; Abdalla et al. 2003; Ligoure et al. 2005; Checchin et al. 1999; Greco and Lionetto 2009; Greco et al. 2005; Indennidate et al. 2009). However, new tannin/furanic rigid foams present the following advantages: low cost, about 95% of the constituent raw materials are from renewable sources, high thermal insulation, good mechanical properties, and excellent fire resistance (Meikleham and Pizzi 1994; Tondi et al. 2009a; Tondi and Pizzi 2009; Celzard et al. 2010). Moreover, their high carbon yield makes them an excellent precursor for cellular vitreous carbon (Tondi et al. 2009b).
PEER-REVIEWED ARTICLE
bioresources.com
pentane, and mixtures of the two were all used as blowing agents. The density, cell size, thermal conductivity, and mechanical properties were also measured. Thermal conductivity is a very important parameter for foams used in thermal insulation; hence the relationship of thermal conductivity and microstructure was also investigated.
EXPERIMENTAL
Chemicals
The company Silvachimica supplied the commercial mimosa tannin (Acacia mearnsii, de Wild), which was predominantly composed of prorobinetinidins and contained more than 80% oligomers of A, B, and C flavonoid units (Pasch et al. 2001), as represented in Fig. 1.
Fig. 1. Mimosa tannin flavonoid units
Formulation and Preparation
The formulation of the foams is given in Table 1. First, water, furfuryl alcohol, formaldehyde, blowing agent, and tannin were mixed together using strong agitation. Then para-toluene-4-sulphonic acid (catalyst) was added with violent stirring for 20 s, and the foaming began after a short induction time. Black foam was thus obtained within a few minutes.
Table 1. Formulation of Tannin/Furanic Foams with Different Blowing Agents
Component Amount (g)
Water 6
Furfuryl alcohol 10.5
Formaldehyde (37% water solution) 7.4
Blowing agent 1 - 10
Tannin 30
Para-toluene-4-sulphonic acid (65% solution) 11
PEER-REVIEWED ARTICLE
bioresources.com
Measurement
Bulk density and mechanical test
The samples were cut in to 30 × 30 × 15 mm3 specimens. The bulk density is defined as the weight of the bulk divided by its volume.
The compression was tested with an Instron 4467 universal testing machine equipped with a 30 kN head at a constant load rate of 2.0 mm·min-1.
Scanning Electron Microscope (SEM)
The samples were put into freezer at a temperature of -40 °C and then cut into 5 × 5 × 4 mm3 samples for observation with a Hitachi S 4800 scanning electron microscope (SEM) with a magnification of ×20.
Thermal conductivity
The samples were cut to dimensions of 100 × 50 × 30 mm3 and put in a vacuum oven for 1 day to drive away any possible blowing agents in the foam. The thermal conductivity was measured by the thermal conductivimeter FP2C (NeoTim) at room temperature with a sensor of 13.6 power of 0.04 W, and testing time of 180 s.
RESULTS AND DISCUSSION
Density and SEM
The single most important structural characteristic of any foam is its relative density r, which is defined as,
r = */s (1)
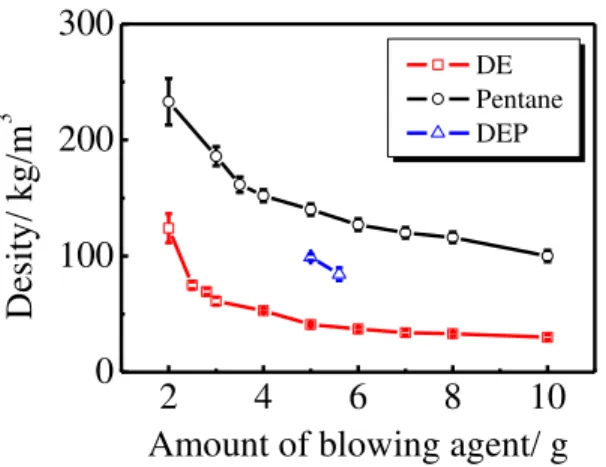
where * is the bulk density and s is the skeleton density (sometimes also called true density). The skeleton density s has been found to be 1,580 kg/m3 (Celzard et al. 2010). As expected, an increase in blowing agent content always lowers the density of the foam, as shown is Fig. 2. The error bars in Fig. 2 indicate that it is more reliable and repeatable to produce foams with a density of 30 to 80 kg/m3 with diethyl ether and to produce the foams with density of 120 to 180 kg/m3 with pentane. Foams with a density in the 80 to 120 kg/m3 range can then be produced by mixtures of DE and pentane.
2 4 6 8 10
0 100 200 300
DE Pentane DEP
Desity/
kg/m
3
Amount of blowing agent/ g
PEER-REVIEWED ARTICLE
bioresources.com
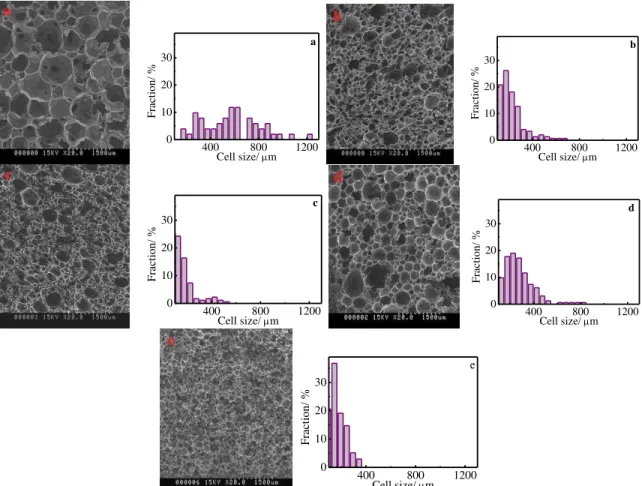
More details about the microcellular structure of the foams are shown in Fig. 3. The SEM photos clearly show that each cell is made up of edges, cell walls (also called faces or membranes), and windows in the cell walls. In general, there are always one or two faces that present a small window, though most faces are intact. Furthermore, the cell walls are thinner than the cell edges so that it would be difficult to tell a membrane from a window if the samples were not metalized before SEM scanning (photos not shown). It is interesting to point out that the mixture of the two blowing agents did not result in different cell size distribution.
400 800 1200
0 10 20 30
Fract
ion/
%
Cell size/ m
a
400 800 1200
0 10 20 30
Fract
ion/
%
Cell size/ m b
400 800 1200
0 10 20 30
Fract
ion/
%
Cell size/ m
c
400 800 1200 0
10 20 30
Fract
ion/
%
Cell size/ m
d
400 800 1200 0
10 20 30
Fract
ion/
%
Cell size/ m e
Fig. 3. SEM and cell size distribution of (a) DE foam with density 32 kg/m3; (b) DE foam with
density 62 kg/m3; (c) DE foam with density 87 kg/m3; (e) pentane foam with density 120 kg/m3; (f) DEP foam with density 100 kg/m3
If the growing direction of the foam is defined as its z-axis, the plane perpendicular to such a z-axis is defined as the xy-plane. The SEM images in Fig. 3 are obtained from xy-plane; however we must point out that previous work has shown that the cells are elongated in the direction of the z-axis. The mean cell diameter is defined by De Hoff and Rhines (1968) as,
c N
L 1.5 (2)
PEER-REVIEWED ARTICLE
bioresources.com
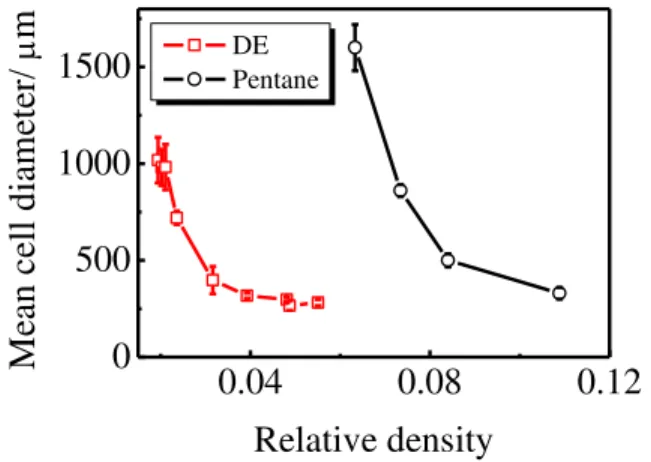
is discussed, which is shown in Fig. 4. The cell size increases as the relative density decreases, especially when the relative density is lower than 0.03 for DE foamsand 0.08 for pentane foams.
Furthermore, in Fig. 4, the mean cell size of pentane foams is larger than DE foams at the same relative density, especially at lower densities. This is of consequence when the foam is used for metal absorption and/or as a catalyst carrier, where a large cell size is sometimes preferred. DE is soluble in the mixture of raw materials but pentane can not, so pentane is more like to congregate during the foaming process, which results in a larger cell size than DE foam.
0.04 0.08 0.12
0 500 1000
1500 DE Pentane
Mean ce ll di am et er/ m Relative density
Fig. 4. Changes in mean cell diameter of tannin/furanic rigid foam as a function of relative density
Thermal Conductivity
Thermal conductivity is very important to foam materials (Venkatesan et al. 2001; Klett et al. 2004; Modesti et al. 2004; De Micco and Aldao 2006). The effective thermal conductivity of the foam materials,*
, is considered to be made by four factors (Gibson and Ashby 1997),
* * * * * r c g
s
(3)
where *
s
is the heat conduction through the solid, *
g
is the conduction through the gas,
*
c
is the convection within the wall, and *
r
is the radiation through cell walls and across the cell voids. The contribution of radiation and the convection in the foam are very complex. According to Schuetz and Glicksman (1984),
l s * =2
3 r * r s
l s (4)
and g s g
1 *
*
PEER-REVIEWED ARTICLE
bioresources.com
where s and g are the effective thermal conductivity of the solid- and the gas-filled foams, respectively. Thermal conductivity was tested when the foams were left for more than 3 months, so that the filling gas in the foams was air, which has a thermal conductivity of 0.025 W/m k at room temperature.
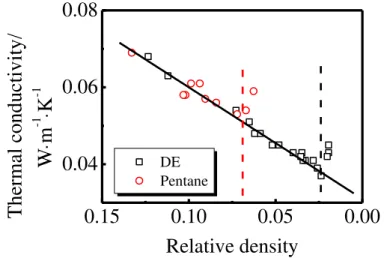
The effective thermal conductivities of tannin/furanic foams are shown in Fig. 5. As the relative density decreases, both DE foams and pentane foams showed two thermal conductivity regions: a region of gradual linear decrease (region I) and a region of sharp increase (region II). The minimum thermal conductivity for DE foam and pentane foam is 0.037 W/m k (when r = 0.0237) and 0.053 W/m k (when r = 0.0842), respectively. As we can see from Eq. 4 and Fig. 5, the decrease of the thermal conductivity in region I is caused by the decrease of relative density. For DE foam, the conduction through the air contributes as high as 0.024 W/m k. When the cell size is small and the relative density of the foam is high, the contribution of radiation and natural convection can be ignored, and the foam’s thermal conductivity presents a linear trend. The following equation fits the linear region of the thermal conductivity of the DE foam:
S
* 0.031 0.299 * / (6)
According to Eqs. 2 to 4, the intercept of Eq. 5 should be 0.025, which is the thermal conductivity of air. This is supposed to be caused by the fact that radiation contributes more at low relative density and less at higher relative density.
0.15
0.10
0.05
0.00
0.04
0.06
0.08
DE Pentane
The
rma
l
conduc
tivi
ty/
W
m
-1
K
-1
Relative density
Fig. 5. Effect of relative density of tannin/furanic rigid foam on thermal conductivity. The straight line fits the linear region of DE foam.
PEER-REVIEWED ARTICLE
bioresources.com
increase of thermal conductivity is caused by the sharp increase of radiation. Glicksman (1994) used Rossland’s equation and found that radiative heat transfer could be expressed as,
l r =16s T 3
/ 3K* (7)
and
s f
f s t k t k l l K 2 exp 1 2 exp 1 46 . 3 / * 10 . 4 *
(8)
where is Stefan’s constant, T is temperature, is the volume fraction of solid in the cell edges, Ks is the extinction coefficient of the solid, is the cell size, and tf is the face thickness. Equations 6 and 7 and Fig. 4 show that the decrease of */ and the sharp increase of cell size will result in a dramatic increase of radiative contribution. Therefore, the way to lower the thermal conductivity should be to always keep the mean cell size of the foam under 700 μm.
Compressive Strength
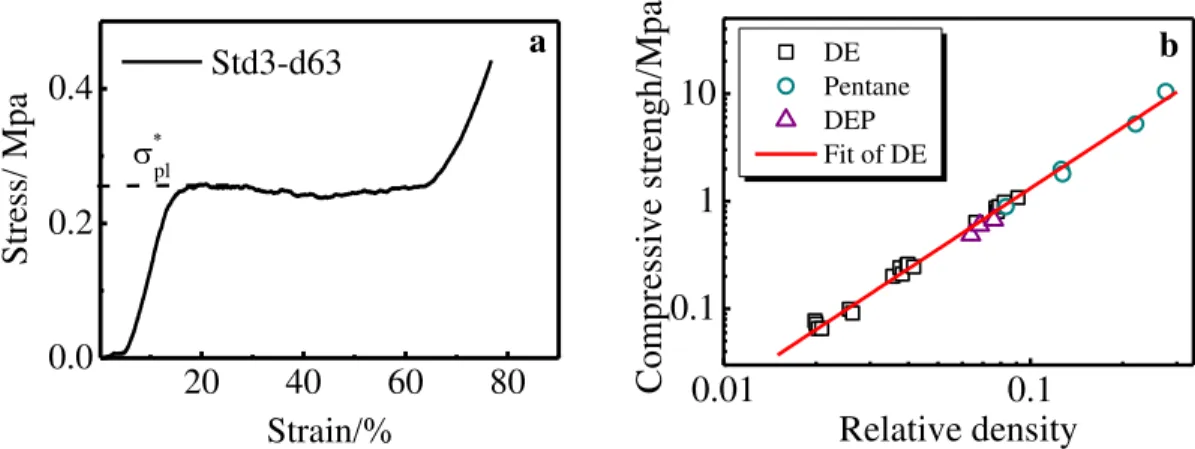
A typical full stress-strain curve of tannin/furanic foam under compression is shown in Fig. 6a. The compression curve always shows an elastic failure with three regions: elastic deformation, plateau, and densification. However, the tensile stress-strain curve showed a fragile break (Tondi et al. 2009a). The stress-concentration effect always leads to a crack, which will cause damage to the material, no matter if in compression or tension. However, the crack increases far more quickly in tension than in compression, so tannin/furanic foams are elastic in compression and brittle in tension.
The relative density and compressive strength obey a power law (Gibson and Ashby 1997). a s ys pl * * (9) where * pl
is the compressive strength of the foam, ys is the compressive strength of solid, and a is constant. By fitting Eq. 8 to the results of DE foams, the following equation is obtained, 88 . 1 * * 100 s pl (10)
PEER-REVIEWED ARTICLE
bioresources.com
20 40 60 80
0.0 0.2 0.4
Stress/
Mpa
Strain/% Std3-d63
pl
a
0.01 0.1
0.1 1 10
DE Pentane DEP Fit of DE
Compre
ss
ive
stre
ngh/
Mpa
Relative density b
Fig. 6. (a) Typical strain-stress characteristics of a tannin/furanic rigid foam; (b) compressive strength of different tannin/furanic foam as function of relative density
CONCLUSIONS
1. Blowing agents such as DE, pentane, and a mixture of the two, are suitable blowing agents to produce foams with density in the ranges of 30 to 80 kg/m3, 120 to 180 kg/m3, and 80 to 120 kg/m3. Moreover, each blowing agent showed a very quick increase in cell size when the density was lower than a certain value.
2. For the thermal conductivity of tannin/furanic foams, lowering the relative density (or bulk density) is an efficient way to decrease thermal conductivity. However, there is a minimum thermal conductivity for DE and pentane foams, which is 0.037 W/m k and 0.050 W/mk, respectively. This occurs when the mean cell size is higher than 700
μm. Both the decrease of relative density and the increase of cell size lead to a sharp increase of radiation, which results in a sudden, rapid increase in thermal conductivity. The way to lower the thermal conductivity should be then to always keep the mean cell size of the foam under 700 μm.
3. Though different blowing agents result in different cell sizes, the mechanical performance of the foams is the same. Thus, pentane can improve the foam’s mechanical properties by extending the density of tannin/furanic foams to 180 kg/m3. 4. Pentane foams have greater density and higher compressive strength than DE foams of the same cell size. This is of great interest when the cell size is the only concern, as in applications like metal absorption and catalyst carriers
REFERENCES CITED
Abdalla, M. O., Ludwick, A., and Mitchell, T. (2003). “Boron-modified phenolic resins for high performance applications,”Polymer 44(24), 7353-7359.
a-PEER-REVIEWED ARTICLE
bioresources.com
Structural Materials Properties Microstructure and Processing 527(16-17), 4438-4446.
Checchin, C. C., Cellarosi, B., and Sam, F. O. (1999). “Use of cone calorimeter for evaluating fire performances of polyurethane foams,”Polymer Degradation and Stability 64, 573-576.
Chen, C., Kennel, E., Stiller, A., Stansberry, P., and Zondlo, J. (2006). “Carbon foam derived from various precursors,”Carbon 44(8), 1535-1543.
De Hoff, R. T., and Rhines,F. N. (1968). Quantitative Microscopy, McGraw-Hill, New York.
De Micco, C., and Aldao, C. M. (2006). “On the prediction of the radiation term in the thermal conductivity of plastic foams,”Latin American Applied Research 36(3), 193-197.
Gibson, L. J., and Ashby, M. F. (1997). Cellular Solids: Structure and Properties, Cambridge University Press, Cambridge, UK.
Glicksman, R. (1994). Heat Transfer in Foams, Chapman & Hall, London, UK. Greco, A., and Lionetto, F. (2009). “The influence of the stress relaxation and creep
recovery times on the viscoelastic properties of open cell foams,”Polymer Engineering & Science 49(6), 1142-1150.
Greco, A., Maffezzoli, A., and Manni, O. (2005). “Development of polymeric foams from recycled polyethylene and recycled gypsum,”Polymer Degradation and Stability 90(2), 256-263.
Indennidate, L., Cannoletta, D., Lionetto, F., Greco, A., and Maffezzoli, A. (2009).
“Nanofilled polyols for viscoelastic polyurethane foams,”Polymer International
59(4), 486-491.
Kim, A., Hasan, M. A., Nahm, S. H., and Cho, S. S. (2005). “Evaluation of compressive mechanical properties of Al-foams using electrical conductivity,” Composite
Structures 71(2), 191-198.
Klett, J., McMillan, A., Gallego, N., and Walls, C. (2004). “The role of structure on the thermal properties of graphitic foams,”Journal of Materials Science 39(11), 3659-3676.
Li, X., Basso, M. C., Braghiroli, F. L., Fierro, V., Pizzi, A., and Celzard, A. (2012).
“Tailoring the structure of cellular vitreous carbon foams,”Carbon 50(5), 2026-2036. Ligoure, C., Cloitre, M., Le Chatelier, C., Monti, F., and Leibler, L. (2005). “Making
polyurethane foams from microemulsions,”Polymer 46(17), 6402-6410.
Meikleham, N. E., and Pizzi, A. (1994). “Acid-catalyzed and alkali-catalyzed tannin-based rigid foams,”Journal of Applied Polymer Science 53(11), 1547-1556.
Modesti, M., Lorenzetti, A., and Dall'Acqua, C. (2004). “New experimental method for determination of effective diffusion coefficient of blowing agents in polyurethane foams,”Polymer Engineering and Science 44(12), 2229-2239.
Pasch, H., Pizzi, A., and Rode, K. (2001). “MALDI-TOF mass spectrometry of polyflavonoid tannins,”Polymer 42(18), 7531-7539.
Schuetz, M. A., and Glicksman, L. R. (1984). “A basic study of heat transfer through foam insulation," Journal of Cellular Plastics 20(2), 114-121.
Skochdopole, R. E. (1961). “Thermal conductivity of foamed plastics,”Chemical Engineering Progress 57, 114-121.
Tondi, G., Fierro, V., Pizzi, A., and Celzard, A. (2009b). “Tannin-based carbon foam,”
PEER-REVIEWED ARTICLE
bioresources.com
Tondi, G., and Pizzi, A. (2009). “Tannin-based rigid foams: Characterization and modification,”Industrial Crops and Products 29(2-3), 356-363.
Tondi, G., Zhao, W., Pizzi, A., Du, G., Fierro, V., and Celzard, A. (2009a). “ Tannin-based rigid foams: A survey of chemical and physical properties,”Bioresource Technology 100(21), 5162-5169.
Venkatesan, C., Jin, G. P., Chyu, M. C., Zheng, J. X., and Chu, T. Y. (2001).
“Measurement of thermophysical properties of polyurethane foam insulation during transient heating,”International Journal of Thermal Sciences 40(2), 133-144. Zhao, W., Pizzi, A., Fierro, V., Du, G., and Celzard, A. (2010). “Effect of composition
and processing parameters on the characteristics of tannin-based rigid foams. Part I: Cell structure,”Materials Chemistry and Physics 122(1), 175-182.

