Submitted30 January 2013
Accepted 27 May 2013
Published11 June 2013
Corresponding author Michael W. Kattan, kattanm@ccf.org
Academic editor Akio Inui
Additional Information and Declarations can be found on page 11
DOI10.7717/peerj.87
Copyright 2013 Wells et al.
Distributed under
Creative Commons CC-BY 3.0
OPEN ACCESS
Prediction of morbidity and mortality in
patients with type 2 diabetes
Brian J. Wells1, Rachel Roth2, Amy S. Nowacki1, Susana Arrigain1, Changhong Yu1, Wayne A. Rosenkrans, Jr.3and Michael W. Kattan1 1Department of Quantitative Health Sciences, Cleveland Clinic, Cleveland, OH, United States 2Department of Family Medicine, Swedish Hospital, Seattle, WA, United States
3Center for Biomedical Innovation, Personalized Medicine Coalition, Massachusetts Institute of
Technology, Cambridge, MA, United States
ABSTRACT
Introduction.The objective of this study was to create a tool that accurately predicts the risk of morbidity and mortality in patients with type 2 diabetes according to an oral hypoglycemic agent.
Materials and Methods.The model was based on a cohort of 33,067 patients with type 2 diabetes who were prescribed a single oral hypoglycemic agent at the Cleveland Clinic between 1998 and 2006. Competing risk regression models were created for coronary heart disease (CHD), heart failure, and stroke, while a Cox regression model was created for mortality. Propensity scores were used to account for possible treatment bias. A prediction tool was created and internally validated using tenfold cross-validation. The results were compared to a Framingham model and a model based on the United Kingdom Prospective Diabetes Study (UKPDS) for CHD and stroke, respectively.
Results and Discussion.Median follow-up for the mortality outcome was 769 days. The numbers of patients experiencing events were as follows: CHD (3062), heart fail-ure (1408), stroke (1451), and mortality (3661). The prediction tools demonstrated the following concordance indices (c-statistics) for the specific outcomes: CHD (0.730), heart failure (0.753), stroke (0.688), and mortality (0.719). The prediction tool was superior to the Framingham model at predicting CHD and was at least as accurate as the UKPDS model at predicting stroke.
Conclusions.We created an accurate tool for predicting the risk of stroke, coronary heart disease, heart failure, and death in patients with type 2 diabetes. The calculator is available online athttp://rcalc.ccf.orgunder the heading “Type 2 Diabetes” and entitled, “Predicting 5-Year Morbidity and Mortality.” This may be a valuable tool to aid the clinician’s choice of an oral hypoglycemic, to better inform patients, and to motivate dialogue between physician and patient.
Subjects Diabetes and Endocrinology, Epidemiology
Keywords Type 2 diabetes mellitus, Prediction, Propensity, Coronary heart disease, Heart failure, Stroke, Mortality, Electronic health record, Hypoglycemic agents
INTRODUCTION
treatment decisions are extremely difficult to make because the literature is frequently inconclusive about the preferred treatment. The best outcomes are not always experienced by patients with the best glycemic control (Abraira et al., 1997;Mellbin et al., 2008;
Duckworth et al., 2009). And, head-to-head comparisons of clinical outcomes between the oral hypoglycemic agents are lacking (Bolen et al., 2007). In addition, the most effective oral hypoglycemic drug likely depends on patient characteristics and comorbid conditions.
Calculators modeled from cohorts that are not exclusively comprised of patients with type 2 diabetes have been shown to predict poorly when applied to patients with diabetes (Sheridan, Pignone & Mulrow, 2003;Guzder et al., 2005;Coleman et al., 2007). The calculators that have been fashioned specifically for patients with type 2 diabetes only address single outcomes such as stroke (Wolf et al., 1991;Kothari et al., 2002), coronary heart disease (Wilson et al., 1998;Stevens et al., 2001;Lee et al., 2006), or mortality (Hong Kong Diabetes Registry et al., 2008;Wells et al., 2008). Other complications – like heart failure, which is much more prevalent among diabetic patients (12%) than the general population (3.9%) (Nichols et al., 2001)– have not been modeled with respect to risk at all. Each of these risk assessments exist in different locations and were modeled using slightly different populations, parameters and methods. The result is that they are difficult to combine, and not readily used by physicians.
The purpose of this project was to create a tool that would assist a clinician (and patient) with the selection of an oral hypoglycemic medication. The tool was designed to allow the consideration of a number of common complications and mortality separately but simultaneously, in a more realistic approximation of the complex decision-making process of risk optimization.
MATERIALS AND METHODS
A retrospective cohort gathered from the electronic health records (EHR) at the Cleveland Clinic between 1998 and 2006 was used for this study. The data were recorded for patients with type 2 diabetes for clinical and administrative purposes. The research in this project was approved by the Institutional Review Board of the Cleveland Clinic Foundation (Study #06-635) which granted a waiver of informed consent. Patients entered and exited the cohort according to their actual clinical courses and had varying follow-up periods. Baseline was defined as the date of first prescription of an oral hypoglycemic agent in an eligible patient.
The analysis was limited to patients who were prescribed a single one of the following oral hypoglycemic agents: sulfonylureas (SFUs), meglitinides (MEGs), biguanides (BIGs), or thiazolidinediones (TZDs). Patients with prescriptions for multiple oral agents at baseline were excluded because of the substantial number of possible two- and three-drug combinations. Patients prescribed alpha-glucosidase inhibitors, non-insulin injectable medications, and other less-commonly used medications were excluded because of inadequate sample sizes.
Patients with advanced disease on dialysis were excluded. Those patients who previously experienced the event of interest (e.g., stroke in the stroke model) were excluded from modeling of that specific outcome. Patients with a documented history of a transient ischemic attack were also excluded from the stroke analysis. Some patients with polycystic ovarian syndrome (ICD-9 256.4) can be placed on BIGs for management; to avoid confusion, patients with such a recorded diagnosis were also excluded. The EHR contained 49,939 patients with type 2 diabetes who were prescribed at least one oral agent. The exclusion of 16,872 patients on multiple oral agents left a final sample size of 33,067.
Four primary outcomes were modeled separately: stroke, heart failure, coronary heart disease (CHD), and mortality. Stroke was defined according to ICD-9 codes 430-434 and 436-438. These codes exclude transient ischemic attack as this diagnosis is difficult to capture reliably in the EHR. CHD was defined as a recorded diagnosis of CHD (ICD9 410-414), documentation of a coronary revascularization procedure, or documentation of CHD as a cause of death on death certificate data obtained from the National Death Index (National Center for Health Statistics, Hyattsville, MD). Heart failure was defined as documented heart failure (ICD9 402.01, 402.11, 402.91, 428.00–428.99, 404.01, 404.11, or 404.91) and/or left ventricular ejection fraction (LVEF)>40% on echocardiogram. Mortality was determined from vital status in the electronic health records (EHR) and/or the Social Security Death Index (SSDI).
Potential predictor variables for each of the four models were chosen individually based on their clinical and physiological relevance to the individual outcomes (Table 2). Values for each predictor variable were extracted from the EHR. The baseline value for each predictor variable was defined as the value of the variable on the baseline date. If missing, the most recent historical value was used, or the value closest to the baseline date up to 21 days following baseline. Patients were considered to have a new diagnosis of type 2 diabetes if they had been seen before their baseline date by either an endocrinologist or primary care physician at Cleveland Clinic and did not have a diagnosis of diabetes entered in the EHR at that time.
accuracy and decrease bias (Moons et al., 2006). Patients were censored at the time of their last follow up (or the date of the last SSDI update for mortality) and therefore imputation was not employed for the outcome information.
For mortality, a Cox proportional hazards regression model was fit with time to death as the outcome. For stroke, heart failure, and coronary heart disease, a competing risks regression model was fit with death considered the only competing event. Statistical analyses were performed using R, version 2.10.
Given that oral hypoglycemic medication is our variable of interest, a limited number of potential interactions were considered that might result from inclusion of medication in the predictive model. An interaction ofmedication class x glomerular filtration rate (GFR)
andmedication class x agewas considered due to precautions advised for use of biguanides (BIGs) in older adults and in patients with renal dysfunction. Similarly, formedication class x congestive heart failure (CHF), there are precautions advised for using TZDs and BIGs in patients with heart failure. (This interaction was not included in the heart failure model.) For parsimony, interactions were only included in the final model if they were statistically significant(p<0.05).
A modified version of Harrell’s “model approximation” (aka step-down) method (Harrell, Lee & Mark, 1996) that maximized the concordance index (c-statistic, a measure of predictive discrimination) and not R-squared (a measure of explained variation) was used for variable selection. Variables in the full models for each outcome were chosen according to clinical relevance (Table 2). Medication, as our primary variable of interest, was forced into each model. Interactions were included only when the interaction variables themselves remained in the model. The final model represents the subset of variables maximizing the c-statistic.
The final prediction model for CHD was compared head-to-head with the Framingham model described byWilson et al. (1998). This comparison was performed in a subset of patients between 30–74 years of age in order to fairly represent the population for which the Framingham model was intended. In addition, the test dataset was limited to patients for which complete data prior to imputation was available for calculating the Framingham risk score. The final comparison dataset after these restrictions consisted of 7,714 patients. The Framingham model was designed to produce 10-year risk, whereas our model pro-duces 5-year risk predictions. Thus, an assumption was made that the Framingham model follows an exponential association, and the 5 year risk was estimated accordingly. However, since these models are not time-dependent, the particular predicted follow up time will have no effect on the calculated discrimination (a patient with higher risk in 5 years will also have higher risk in 10 years). The predictions used to compare with the Framingham model were derived from the ten-fold cross validation and were therefore “overfit-corrected” as none of the predictions were made on patients used to build the model.
The final prediction model for stroke is compared to that created by the United Kingdom Prospective Diabetes Study (UKPDS) risk engine (Kothari et al., 2002). Again, a subset of the cohort was used in order to make a more fair comparison. The subset was limited to patients newly diagnosed with type 2 diabetes (i.e. length of diabetes=0)
since the UKPDS model contains a predictor variable for length of diabetes that was not available in the current cohort. The comparison dataset was also limited to patients between 25–65 years of age and without a history of coronary heart disease. Furthermore, the subset was limited to patients with triglycerides<500 mg/dl since the total cholesterol levels used for the UKPDS prediction were calculated using the Friedewald equation which can be inaccurate in patients with extremely high triglyceride values (Warnick et al., 1990). Finally, the dataset was limited to patients who had complete data prior to imputation for the calculation of the UKPDS prediction. The final stroke comparison dataset consisted of 2,072 patients. Unfortunately, an insufficient number of events in each risk quintile prevented the creation of a calibration curve. Once again, the predictions created in this study were overfit corrected using cross-validation.
RESULTS AND DISCUSSION
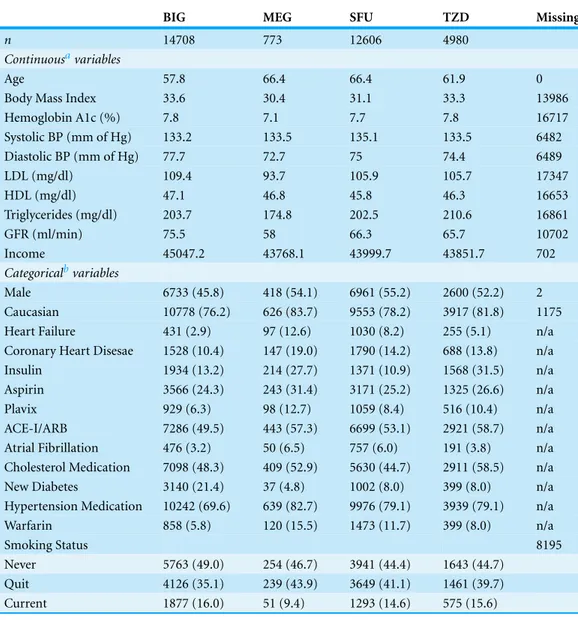
Characteristics of patients on each of the four hypoglycemic types can be seen inTable 1. Overall the patients were predominantly white with a roughly equal gender distribution. Patients taking BIGs were younger, had less heart failure, and were more likely to have newly diagnosed diabetes. Variables included in the final models after Harrell’s model approximation (aka step-down) method are shown below inTable 2. It is important to note that the final variables do not necessarily reflect the clinical importance of that individual variable but rather the best predictive model as a whole.
Figure 1 Calibration curves for the final models.The curves display the predicted probabilities on thex-axis and the Kaplan–Meier estimations on they-axis according to quintiles of the predicted probabilities.
Table 1 Characteristics of the overall cohort of patients with type 2 diabetes.
BIG MEG SFU TZD Missing
n 14708 773 12606 4980
Continuousavariables
Age 57.8 66.4 66.4 61.9 0
Body Mass Index 33.6 30.4 31.1 33.3 13986
Hemoglobin A1c (%) 7.8 7.1 7.7 7.8 16717
Systolic BP (mm of Hg) 133.2 133.5 135.1 133.5 6482
Diastolic BP (mm of Hg) 77.7 72.7 75 74.4 6489
LDL (mg/dl) 109.4 93.7 105.9 105.7 17347
HDL (mg/dl) 47.1 46.8 45.8 46.3 16653
Triglycerides (mg/dl) 203.7 174.8 202.5 210.6 16861
GFR (ml/min) 75.5 58 66.3 65.7 10702
Income 45047.2 43768.1 43999.7 43851.7 702
Categoricalbvariables
Male 6733 (45.8) 418 (54.1) 6961 (55.2) 2600 (52.2) 2
Caucasian 10778 (76.2) 626 (83.7) 9553 (78.2) 3917 (81.8) 1175
Heart Failure 431 (2.9) 97 (12.6) 1030 (8.2) 255 (5.1) n/a
Coronary Heart Disesae 1528 (10.4) 147 (19.0) 1790 (14.2) 688 (13.8) n/a
Insulin 1934 (13.2) 214 (27.7) 1371 (10.9) 1568 (31.5) n/a
Aspirin 3566 (24.3) 243 (31.4) 3171 (25.2) 1325 (26.6) n/a
Plavix 929 (6.3) 98 (12.7) 1059 (8.4) 516 (10.4) n/a
ACE-I/ARB 7286 (49.5) 443 (57.3) 6699 (53.1) 2921 (58.7) n/a Atrial Fibrillation 476 (3.2) 50 (6.5) 757 (6.0) 191 (3.8) n/a Cholesterol Medication 7098 (48.3) 409 (52.9) 5630 (44.7) 2911 (58.5) n/a
New Diabetes 3140 (21.4) 37 (4.8) 1002 (8.0) 399 (8.0) n/a
Hypertension Medication 10242 (69.6) 639 (82.7) 9976 (79.1) 3939 (79.1) n/a
Warfarin 858 (5.8) 120 (15.5) 1473 (11.7) 399 (8.0) n/a
Smoking Status 8195
Never 5763 (49.0) 254 (46.7) 3941 (44.4) 1643 (44.7)
Quit 4126 (35.1) 239 (43.9) 3649 (41.1) 1461 (39.7)
Current 1877 (16.0) 51 (9.4) 1293 (14.6) 575 (15.6)
Notes. aMean. bCount (%).
BIG=Biguanide. MEG=Meglitinide. SFU=Sulfonylurea. TZD=Thiazolidinedione. BP=Blood Pressure.
LDL=Low Density Lipoprotein. HDL=High Density Lipoprotein. GFR=Glomerular Filtration Rate.
ACE-I/ARB=Angiotensin Converting Enzyme Inhibitor or Angiotensin Receptor Blocker.
Table 2 Variables included in the four final models.
CHD Heart failure Stroke Mortality
Propensity for Biguanide Included Included Included Included
Age Included Included Included Included
Gender Included Included Removed Included
Ethnicity Included Included Removed Included
Medication Included Included Included Included
Income Included Included Included Included
Glomerular Filtration Rate Included Included Included Included
Body Mass Index Removed Included Included Included
Hemoglobin A1c Included Included Included Included
Coronary Heart Disease Not considered Included Included Removed
Smoking Status Included Included Included Included
Systolic Blood Pressure Included Included Included Included Diastolic Blood Pressure Included Included Included Included
Insulin Included Included Included Included
Clopidogrel Included Included Included Included
Aspirin Included Included Included Included
ACE-I/ARB Included Included Not considered Included
Cholesterol Medication Included Removed Included Included
New Diabetes Included Included Included Included
Low Density Lipoprotein Included Not considered Included Included High Denisty Lipoprotein Included Not considered Included Included
Triglycerides Removed Not considered Included Included
Heart Failure Removed Not considered Included Included
Atrial Fibrillation Not considered Not considered Removed Not considered Hypertension Medication Not considered Not considered Removed Not considered Warfarin Not considered Not considered Included Not considered
Age X Medication Included Included Included Included
GFR X Medication Included Included Included Included
Heart Failure X Medication Removed Not considered Included Included
Notes.
CHD=Coronary Heart Disease.
ACE-I/ARB=Angiotensin Converting Enzyme Inhibitor or Angiotensin Receptor Blocker. GFR=Glomerular Filtration Rate.
Table 3 Summary of the final model results.
Final cohort size
Median follow-up time (days)
N with Follow-up more than 5 years
C-statistic
Heart failure 25,882 503 1,211 0.7530
Coronary heart disease 23,906 462 943 0.7298
Stroke 26,140 501 1,088 0.6881
Figure 2 Calibration Curves for the CHD Outcome.
perform well in patients with type 2 diabetes (Sheridan, Pignone & Mulrow, 2003;Guzder et al., 2005;Coleman et al., 2007). Unfortunately, the CHD prediction model could not be compared head-to-head with UKPDS due to differences in the definition of CHD between the current study and the UKPDS. Specifically, the UKPDS defined CHD as MI, Fatal MI, and sudden death. It was not possible to determine which patients in the current study experienced a sudden death and it was also felt that it was important to include coronary revascularization procedures as a CHD endpoint.
For stroke, the final c-statistics were almost indistinguishable between our model (0.753) and the UKPDS model (0.752). The subset of data used for the UKPDS comparison was not large enough to create a calibration curve, but there was some evidence that the UKPDS may be underestimating stroke risk more than the stroke model created in this study when examining calibration in the large. The median predicted 5-year risk of stroke according to the UKPDS and the new model were 0.1% and 6.7%, respectively; the actual 5-year incidence of stroke was 16.4% in this subset.
(Framingham, UKPDS), but this tool is the first of its kind to predict multiple endpoints simultaneously for this population. This tool more closely addresses physician and patient real-world concerns for preventing a wide range of life-threatening complications. Further, it improves on the accuracy of past model’s predictions. It is interesting to note that our models created with observational EHR data matched or surpassed other published tools created using clinical trial data. Our use of propensity scores should reduce any potential concerns about treatment bias and the employment of competing risk regression should help prevent the overestimation of risks that might be caused by ignoring the competing risk of death for the CHF, CHD, and stroke outcomes.
In the past, the necessity of using a nomogram to calculate risk made large models difficult to use quickly and efficiently; replacement of this method with a free and accessible web-based calculator rectifies this issue. With the inclusion of so many individual predictor variables, the accuracy of the model is preserved while the web interface makes it easy to use. If the performance of the model is evaluated externally and found to be strong, it could be linked directly to the EHR, allowing patient characteristics to be directly imported into the calculator. All of the variables included in our models are readily accessible, making it functional for patients and clinicians everywhere.
Some limitations to our study should be highlighted. First, the duration of diabetes was not collected uniformly and therefore could not be included in the model. The patients in our cohort probably tend to be newer diabetic patients since the population was restricted to patients prescribed a single oral agent and therefore the risk calculator may be most appropriate for those types of patients. Future models may be able to out-predict ours if this variable can be captured. Of course, given the potentially lengthy period during which a patient may have undiagnosed diabetes or pre-diabetes, this variable may not add much to the accuracy of the model given the many other covariates already included. Secondly, the oral hypoglycemic included in the model was the medication at baseline. Medication changes were not considered since these future changes are unknown at the time when a new patient presents for oral hypoglycemic therapy. A final weakness of the study involves the substantial amount of missing data for some predictor variables. The imputation techniques used, however, help to limit the potential bias caused by simply eliminating incomplete records. Even with these limitations, should this model prove valid in external populations, it could prove an extremely helpful tool for clinicians who seek to understand their patient’s personal risk profile.
CONCLUSIONS
ADDITIONAL INFORMATION AND DECLARATIONS
Funding
Research was funded by a grant from AstraZeneca Pharmaceuticals in Wilmington, DE, and the SarnoffCardiovascular Foundation in Washington, DC. The online risk calculator resulting from this project was made possible by the Case Western Reserve University/Cleveland Clinic CTSA Grant Number UL1 RR024989 from the National Center for Research Resources (NCRR), a component of the National Institutes of Health and NIH roadmap for Medical Research. The funders had no role in study design, data collection and analysis, decision to publish, or preparation of the manuscript.
Grant Disclosures
The following grant information was disclosed by the authors: AstraZeneca Pharmaceuticals.
SarnoffCardiovascular Foundation, Case Western Reserve University/Cleveland Clinic CTSA Grant Number UL1 RR024989 from the National Center for Research Resources (NCRR).
Competing Interests
MK is a consultant for Pfizer, Merck, and GlaxoSmithKline, and is an Academic Editor for PeerJ. The other authors do not report any potential conflicts of interest.
Author Contributions
• Brian J. Wells conceived and designed the experiments, performed the experiments,
analyzed the data, wrote the paper.
• Rachel Roth and Amy S. Nowacki analyzed the data, wrote the paper.
• Susana Arrigain and Changhong Yu performed the experiments, analyzed the data.
• Wayne A. Rosenkrans Jr. conceived and designed the experiments.
• Michael W. Kattan conceived and designed the experiments, performed the
experi-ments.
Ethics
The following information was supplied relating to ethical approvals (i.e. approving body and any reference numbers):
Institutional Review Board of the Cleveland Clinic Foundation Study #06-635.
REFERENCES
Abraira C, Colwell J, Nuttall F, Sawin CT, Henderson W, Comstock JP, Emanuele NV, Levin SR, Pacold I, Lee HS. 1997. Cardiovascular events and correlates in the veterans affairs diabetes feasibility trial. Veterans affairs cooperative study on glycemic control and complications in type II diabetes. Archives of Internal Medicine 157:181–188
Bolen S, Feldman L, Vassy J, Wilson L, Yeh HC, Marinopoulos S, Wiley C, Selvin E, Wilson R, Bass EB, Brancati FL. 2007.Systematic review: comparative effectiveness and safety of oral medications for type 2 diabetes mellitus.Annals of Internal Medicine147:386–399
DOI 10.7326/0003-4819-147-6-200709180-00178.
Coleman RL, Stevens RJ, Retnakaran R, Holman RR. 2007.Framingham, SCORE, and DECODE risk equations do not provide reliable cardiovascular risk estimates in type 2 diabetes.Diabetes Care30:1292–1293DOI 10.2337/dc06-1358.
Duckworth W, Abraira C, Moritz T, Reda D, Emanuele N, Reaven PD, Zieve FJ, Marks J, Davis SN, Hayward R, Warren SR, Goldman S, McCarren M, Vitek ME, Henderson WG, Huang GD, VADT Investigators. 2009. Glucose control and vascular complications
in veterans with type 2 diabetes. New England Journal of Medicine360:129–139
DOI 10.1056/NEJMoa0808431.
Eddy DM, Schlessinger L. 2003.Archimedes: a trial-validated model of diabetes.Diabetes Care
26:3093–3101DOI 10.2337/diacare.26.11.3093.
Guzder RN, Gatling W, Mullee MA, Mehta RL, Byrne CD. 2005.Prognostic value of the Framingham cardiovascular risk equation and the UKPDS risk engine for coronary heart disease in newly diagnosed Type 2 diabetes: results from a United Kingdom study.Diabetes & Metabolism22:554–562.
Harrell FE Jr, Lee KL, Mark DB. 1996.Multivariable prognostic models: issues in developing models, evaluating assumptions and adequacy, and measuring and reducing errors.
Statistics in Medicine15:361–387DOI 10.1002/(SICI)1097-0258(19960229)15:4< 361::AID-SIM168>3.0.CO;2-4.
Hong Kong Diabetes Registry, Yang X, So WY, Tong PC, Ma RC, Kong AP, Lam CW, Ho CS, Cockram CS, Ko GT, Chow CC, Wong VC, Chan JC. 2008.Development and validation of an all-cause mortality risk score in type 2 diabetes.Archives of Internal Medicine168:451–457
DOI 10.1001/archinte.168.5.451.
Kothari V, Stevens RJ, Adler AI, Stratton IM, Manley SE, Neil HA, Holman RR. 2002.UKPDS 60: risk of stroke in type 2 diabetes estimated by the UK prospective diabetes study risk engine.
Stroke33:1776–1781DOI 10.1161/01.STR.0000020091.07144.C7.
Lee ET, Howard BV, Wang W, Welty TK, Galloway JM, Best LG, Fabsitz RR, Zhang Y, Yeh J, Devereux RB. 2006.Prediction of coronary heart disease in a population with high prevalence of diabetes and albuminuria: the strong heart study.Circulation113:2897–2905
DOI 10.1161/CIRCULATIONAHA.105.593178.
Mellbin LG, Malmberg K, Norhammar A, Wedel H, Ryden L, DIGAMI 2 Investigators. 2008. The impact of glucose lowering treatment on long-term prognosis in patients with type 2 diabetes and myocardial infarction: a report from the DIGAMI 2 trial.European Heart Journal
29:166–176DOI 10.1093/eurheartj/ehm518.
Moons KG, Donders RA, Stijnen T, Harrell FE Jr. 2006.Using the outcome for imputation of missing predictor values was preferred.Journal of Clinical Epidemiology59:1092–1101
DOI 10.1016/j.jclinepi.2006.01.009.
Nichols GA, Hillier TA, Erbey JR, Brown JB. 2001. Congestive heart failure in type 2 diabetes: prevalence, incidence, and risk factors. Diabetes Care 24:1614–1619
DOI 10.2337/diacare.24.9.1614.
Stevens RJ, Kothari V, Adler AI, Stratton IM, United Kingdom Prospective Diabetes Study (UKPDS) Group. 2001.The UKPDS risk engine: a model for the risk of coronary heart disease in Type II diabetes (UKPDS 56).Clinical Science (London)101:671–679
DOI 10.1042/CS20000335.
Warnick GR, Knopp RH, Fitzpatrick V, Branson L. 1990.Estimating low-density lipoprotein cholesterol by the Friedewald equation is adequate for classifying patients on the basis of nationally recommended cutpoints.Clinical Chemistry36:15–19.
Wells BJ, Jain A, Arrigain S, Yu C, Rosenkrans WA Jr, Kattan MW. 2008. Predicting 6-year mortality risk in patients with type 2 diabetes. Diabetes Care31:2301–2306
DOI 10.2337/dc08-1047.
Wilson PW, D’Agostino RB, Levy D, Belanger AM, Silbershatz H, Kannel WB. 1998. Prediction of coronary heart disease using risk factor categories.Circulation97:1837–1847
DOI 10.1161/01.CIR.97.18.1837.
Wolf PA, D’Agostino RB, Belanger AJ, Kannel WB. 1991.Probability of stroke: a risk profile from