Adam Wysokiński, Jakub Kaźmierski, Iwona Kłoszewska: De-partment of Old Age Psychiatry and Psychotic Disorders. Corre-spondence address: [email protected]
Acknowledgments. The study was supported by the Medical University of Lodz, grant No. 502-03/8-040-01/502-64-023. No competing financial interests exist.
Comparison of metabolic parameters and
Framingham cardiovascular risk scores before and
after in-hospital treatment with antipsychotics
Adam Wysokiński, Jakub Kaźmierski, Iwona Kłoszewska
Summary
Background. The objective of this naturalistic study was to evaluate changes in the prevalence of met-abolic syndrome (MetS) and Framingham cardiovascular risk scores in adult with schizophrenia after in-hospital treatment with antipsychotics.
Methods. For 58 patients (36 women and 22 men) the following data was acquired on admission and at discharge: body height and weight, waist circumference, cigarette smoking, total cholesterol, LDL cho-lesterol, HDL chocho-lesterol, triglycerides (TGA), fasting plasma glucose (FPG), blood pressure, concomi-tant use of antidiabetic, antihypertensive and antihyperlipidemic medications.
results. Mean TGA levels increased significantly (140.32 mg/dL vs. 180.17 mg/dL), other parameters did not change. MetS prevalence on admission and at discharge did not differ significantly, irrespective of definition used (IDF: 50.00% vs. 60.34%; ATPIII: 39.66% vs. 43.10%; ATPIII A: 46.55% vs. 51.72%). Two cardiovascular risk scores were reduced at discharge: stroke, 10-year (4.10% vs. 3.46%) and hyperten-sion, 4-year (22.18% vs. 16.58%). Other Framingham risk scores did not change. Very high prevalence of abnormal body weight (up to 65%), abdominal obesity (63% in men and 89% in women), hypertension (>50%) and lipid abnormalities (31-64%) was found.
Conclusions. We have found a very high rate of MetS in patients treated with antipsychotics. No met-abolic parameters improved after hospital stay, while some worsened. This did not, however, result in in-creased risk of cardiovascular events. Abnormal body weight and lipid abnormalities were very common in our study population. Our results indicate that metabolic parameters should be monitored regularly,
particularly in outpatient settings, and appropriate treatment should be introduced as soon as any signif- and appropriate treatment should be introduced as soon as any signif-icant changes are found.
schizophrenia / antipsychotics / metabolic syndrome / cardiovascular risk
INTRODuCTION
Metabolic syndrome (MetS) is a complex clini-cal condition. It is a cluster of disorders compris-is a cluster of disorders compris-ing central (abdominal) obesity, dyslipidemia, hypertension and abnormal blood glucose
cardiovas-cular events (e.g. myocardial infarction, sudden cardiac death and stroke) [5]. This applies not only to antipsychotics, but also to mood stabi-lizers [6] and antidepressants [7]. Treatment-in-duced metabolic disorders may account for dra-dra- ra-matically increased mortality of schizophrenia patients [8]. However, large Finnish study shows lower mortality compared with no antipsychot-ic use [9].
Framingham cardiovascular (CVD) risk scores allow to estimate risk score profiles of various cardiovascular disease outcomes in different time horizons: coronary heart disease, type 2 di-abetes, general cardiovascular disease and hy-pertension. Studies indicate increased 10-year coronary heart disease risk in schizophrenia [10]. Middle-aged and older patients with psychotic symptoms (and thus taking antipsychotics) have increased 10-year risk of coronary heart disease (up to 79% in case of schizophrenia) [11].
The objective of this naturalistic study was to assess if there are changes in metabolic pa-rameters, the prevalence of metabolic syndrome (MetS) or cardiovascular risk after in-hospital treatment with antipsychotics. Subjects with schizophrenia usually have low level of phys-ical activity [12], have poor diet [13] and lack medical support [14].
SuBJECTS AND METhODS
Data for 58 European Caucasian adult in-hos-pital patients with paranoid schizophrenia (men, n = 22; women, n = 36) was included into the study. The only inclusion criteria was current in-hospital antipsychotic treatment with at least one antipsychotic, irrespective of treatment type and previous treatment duration. The following data were collected on admission and at dis-charge: body height and weight, waist circum-ference, cigarette smoking, lipid panel and fast-ing plasma glucose levels, systolic and diastolic blood pressure. Antipsychotic treatment (class - first or second generation, drug name and dai-ly dose) and treatment of comorbidities (diabe-tes, arterial hypertension and hyperlipidemia) were also registered. For antipsychotic treatment we collected data for all antipsychotics admin-istered for at least one week during current hos-pital stay.
The blood samples for the chemistry panel that included fasting plasma glucose and lipid panel (total, HDL, and LDL cholesterol as well as trig-lycerides) were collected between 7 am and 8 am, after ensuring at least 8 h of overnight fast-ing. The samples were immediately transferred to the central laboratory where they were ana-lyzed. Plasma glucose and serum lipids were es-timated using a Dirui CS-400 Auto-Chemistry Analyzer (Dirui, China).
Height was measured with a wall-mount-ed height measure to the nearest 1 cm. Weight was measured with a spring balance that was kept on a firm horizontal surface. Subjects wore light clothing, stood upright without shoes and weight was recorded to the nearest 0.5 kg. Body mass index (BMI) was calculated as body weight in kilogram divided by the height in me-ter squared (kg/m2). Waist circumference was measured using a non-stretchable fiber measur-ing tape. Waist circumference was measured at a level midway between the lowest rib and the iliac crest.
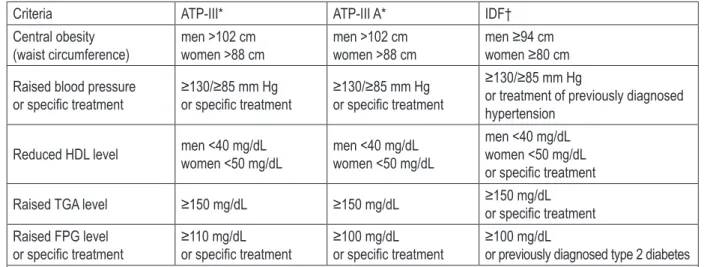
MetS and its components were defined accord-ing to the National Cholesterol Education Pro-gram criteria (NCEP, Adult Treatment Protocol, ATPIII), adapted ATP-III criteria (ATPIII A) and International Diabetes Federation (IDF) criteria. These criteria are defined in Table 1 – next page.
For IDF criteria, if body-mass index (BMI) was over 30 kg/m2, central obesity was assumed irre-spective of waist circumference [1].
Impaired fasting glucose was defined as fast-ing plasma glucose level 100-125 mg/dL based on American Diabetes Association guidelines, new onset of type 2 diabetes was defined as fast-ing plasma glucose level >125 mg/dL. Normal weight, overweight and obesity were defined as BMI <25 kg/m2, 25-30 kg/m2 and ≥30 kg/m2,
re-spectively. Raised triglycerides (TGA) level ≥150 mg/dL and/or total cholesterol (TC) ≥200 mg/dL
and/or reduced HDL cholesterol level <40 mg/ dL for men and <50 mg/dL for women and/or
raised LDL cholesterol level ≥135 mg/dL were
Criteria ATP-III* ATP-III A* IDF† Central obesity
(waist circumference) men >102 cmwomen >88 cm men >102 cmwomen >88 cm men ≥94 cmwomen ≥80 cm Raised blood pressure
or specific treatment ≥130/≥85 mm Hgor specific treatment ≥130/≥85 mm Hgor specific treatment
≥130/≥85 mm Hg
or treatment of previously diagnosed hypertension
Reduced HDL level men <40 mg/dLwomen <50 mg/dL men <40 mg/dLwomen <50 mg/dL men <40 mg/dLwomen <50 mg/dL or specific treatment Raised TGA level ≥150 mg/dL ≥150 mg/dL ≥150 mg/dL or specific treatment Raised FPG level
or specific treatment ≥110 mg/dLor specific treatment ≥100 mg/dLor specific treatment ≥100 mg/dLor previously diagnosed type 2 diabetes * MetS if 3 of 5 criteria are met.
† MetS if central obesity (obligatory) and additional 2 criteria are met.
HDL = high density lipoproteins; TGA = triglycerides; FPG = fasting plasma glucose.
Table 1. Definitions of the metabolic syndrome
Framingham cardiovascular risk scores were calculated using current Framingham Heart Study algorithms (http://www.framingham-heartstudy.org/risk/index.html) using variables including LDL level, HDL level, blood pressure, diabetes and smoking status. The following scores were calculated: coronary heart disease, 2-year risk [16]; coronary heart disease, 10-year risk [17]; type 2 diabetes, 8-year risk [18]; gener-al cardiovascular disease (coronary death, myo-cardial infarction, coronary insufficiency, angi-na, ischemic stroke, hemorrhagic stroke, tran-sient ischemic attack, peripheral artery disease, heart failure), 10-year risk [19]; hard coronary heart disease (myocardial infarction or coronary death), 10-year risk; recurring coronary heart disease (mostly hospitalized events consisting of myocardial infarction, coronary insufficien-cy, angina pectoris, and sudden and non-sud-den coronary death), 2-year risk [16]; stroke, 10-year risk [20]; and arterial hypertension, 4-10-year risk. Next, the risk points were converted to cor-responding percentage of risk [21].
Statistical procedures were performed with STATA 13.1 for OS X (StataCorp, College Sta-tion, Texas, USA). Simple descriptive statistics (means, standard deviations and 95% confidence interval) were generated for all continuous var-iables. For discrete variables number of patients and percentages are given. Shapiro-Wilk and Brown-Forsythe tests were used to test normal-ity and equalnormal-ity of variances, respectively. The
difference between initial and final variables was analyzed by paired Student’s t-test or Wilcoxon signed-rank test (for non-parametric analysis). The difference between two group proportions
was analyzed by chi-square (Χ2) test. The differ-ence between pre- and post-hospitalization pro-portions was analyzed by McNemar chi-square
(Χ2) test (exact McNemar significance proba-bility is given). The significant level was set at p <0.05.
The study protocol was approved by the local Bioethics Committee. There was no financial involve-ment from the industry.
RESuLTS
Table 2. Demographic and clinical details.
All (N = 58)
Men (n = 22)
Women
(n = 36) P†
Age 38.48±1.67
[35.13-41.83]
34.82±2.60 [29.41-40.23]
40.72±2.12 [36.42-45.02]
0.043 t = 1.74 Tobacco smoking 24 (41.38) 9 (40.91) 15 (41.67) NS
Hospital stay (days) 54.95±2.96 [49.02-60.87]
50.77±5.64 [39.04-62.50]
57.57±3.25
[50.97-64.18] NS
Treatment duration (months) 144.40±16.36 [111.63-177.16]
142.45±26.20 [87.97-196.94]
145.58±21.23
[102.49-188.68] NS Hyperprolactinemia 5 (8.62) 2 (9.09) 3 (8.33) NS Patients taking FGAs 14 (24.14) 8 (36.36) 6 (16.67) NS Patients taking SGAs 53 (91.38) 19 (86.36) 34 (94.44) NS Number of APs
1
>1
11 (18.97) 47 (81.03)
4 (18.18) 18 (81.82)
7 (19.44) 29 (80.56)
NS
APs, dose (mg/day) (no. of subjects)
Quetiapine
591.91±25.91 [539.19-644.63]
(34)
631.82±31.82 [560.92-702.71]
(11)
572.83±34.89 [500.46-645.19]
(23)
NS
Aripiprazole
27.5±1.71 [23.88-31.12]
(18)
26.79±3.21 [18.92-34.65]
(7)
27.95±2.04 [23.40-32.51]
(11)
NS
Olanzapine
15.83±6.45 [12.26-19.41]
(15)
17.50±8.22 [8.88-26.12]
(6)
14.72±5.22 [10.71-18.73]
(9)
NS
Clozapine
323.33±145.92 [242.53-404.14]
(15)
450.00±150.00 [77.38-822.62]
(3)
291.67±132.43 [207.52-375.81]
(12)
NS
Risperidone*
3.29±1.84 [1.97-4.61]
(10)
4.23±3.29 [-3.94-12.39]
(3)
2.88±0.94 [2.02-3.75]
(7)
NS
Antihypertensive treatment 10 (17.24) 4 (18.18) 6 (16.67) NS Dyslipidemia treatment 9 (15.52) 4 (18.18) 5 (13.89) NS
Antidiabetic treatment 4 (6.90) 0 4 (11.11) NS
Normal body weight 20 (34.48) 6 (27.27) 14 (38.89) NS
Overweight 16 (27.59) 6 (27.27) 10 (27.78) NS
Obesity 22 (37.93) 10 (45.45) 12 (33.33) NS
Abdominal obesity‡ 46 (79.31) 14 (63.64) 32 (88.89) Χ0.021, 2 = 5.31
– carbamazepine (780.00±268.32 mg/day) and 8 patients were taking selective serotonin reuptake inhibitors (SSRI). Women were significantly old-er (t = 1.74, p = 0.043). IDF-defined (critold-eria for European population) abdominal obesity was
more common in women (Χ2 = 5.31, p = 0.021).
No other differences between men and women were found for subject characteristics. Table 3.
SGA during hospital treatment comparing to
non-MetS ATPIII (Χ2 = 11.82, p = 0.037). Again,
there were no differences for other MetS defi-nitions.
The analysis of changes in metabolic param-eters (see Table 4 – next page) reveled that there were no improvements of these parameters. Triglyceride levels were significantly higher at discharge (z = -4.51; P <0.0001). Mean total cho-lesterol on admission (210.2 mg/dL) and at dis-charge (208.5 mg/dL), as well as mean TGA at discharge (180.2 mg/ dL) levels were above upper lim-it of normal ranges. The majori-ty (39 of 48, i.e. 81.2%) of patients with any type of lipid abnormali-ties received no treatment for dy-slipidemia. Although AITC/HDL ex-ceeded the low risk range, there was no change from admission to discharge. Six patients (10.34%)
gained ≥7% of body weight. Over
-weight and obesity were found in 27.59% and 37.93% of the patients, respectively. Mean BMI (28.5 kg/ m2) and waist circumference (96.5 cm) were above cut-off points for overweight and IDF-defined ab-dominal obesity, both on admis-sion and at discharge.
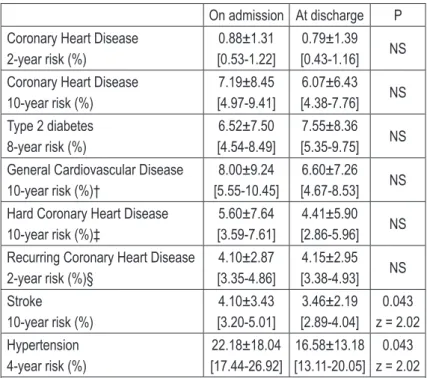
Table 5 – next page – shows cal-culated Framingham CVD risk scores for various CVD events. Despite observed changes in met-abolic parameters, we have observed a signifi-cant reduction in stroke (z = 2.02, p = 0.043) and hypertension (z = 2.02, p = 0.043) risk scores.
DISCuSSION
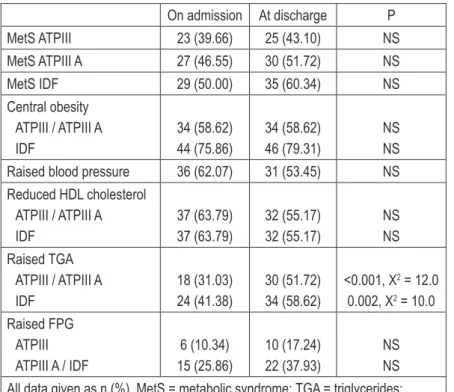
Studies of general population demonstrated that the overall prevalence of MetS in Europe-an countries varies from 5.9% in men Europe-and 2.1% in women (France) [22], through 15.7% in men and 14.2% in women (Finland) [23] and 16.2% in men and 20.9% in women (Poland) [24] to 11.0% in men and 23.1% in women (Russia) [25]. Amer-ican study found that MetS was present in 23.4% of women and 24% of men [26]. The prevalence of MetS increases with age and can reach up to On admission At discharge P
MetS ATPIII 23 (39.66) 25 (43.10) NS MetS ATPIII A 27 (46.55) 30 (51.72) NS MetS IDF 29 (50.00) 35 (60.34) NS Central obesity
ATPIII / ATPIII A IDF
34 (58.62) 44 (75.86)
34 (58.62) 46 (79.31)
NS NS Raised blood pressure 36 (62.07) 31 (53.45) NS Reduced HDL cholesterol
ATPIII / ATPIII A IDF
37 (63.79) 37 (63.79)
32 (55.17) 32 (55.17)
NS NS Raised TGA
ATPIII / ATPIII A IDF
18 (31.03) 24 (41.38)
30 (51.72) 34 (58.62)
<0.001, Χ2 = 12.0
0.002, Χ2 = 10.0
Raised FPG ATPIII ATPIII A / IDF
6 (10.34) 15 (25.86)
10 (17.24) 22 (37.93)
NS NS All data given as n (%). MetS = metabolic syndrome; TGA = triglycerides; FPG = fasting plasma glucose; NS = not significant.
Table 3. Prevalence of metabolic syndrome
and its components.
Table 4. Changes in metabolic parameters
On admission At discharge P
Body weight (kg) 82.43±21.65 [76.69-88.17]
82.38±20.94 [76.82-87.93] NS
BMI (kg/m2) 28.49±6.38
[26.80-30.18]
28.47±6.06 [26.86-30.07] NS
Waist circumference (cm) 96.54±15.91 [92.32-100.76]
96.46±15.55 [92.33-100.58] NS Total cholesterol (mg/
dL) [197.35-223.00]210.17±48.32
208.46±40.85 [197.62-219.29] NS
HDL cholesterol (mg/dL) 44.09±13.22 [40.58-47.60]
44.40±13.41 [40.85-47.96] NS
LDL cholesterol (mg/dL) 136.39±41.63 [125.34-147.43]
128.33±35.99 [118.78-137.88] NS
TGA (mg/dL) [118.60-162.03]140.32±81.82 [155.40-204.95]180.17±93.36 z = -4.51<0.0001
AILDL/HDL [2.98-3.78]3.38±1.51 [2.81-3.56]3.19±1.41 NS
AITC/HDL [2.81-3.56]3.19±1.41 [4.63-5.65]5.14±1.91 NS
FPG (mg/dL) [89.47-102.07]95.77±23.73 [93.05-100.56]96.81±14.16 NS
Systolic blood pressure
(mm Hg) [122.48-132.33]127.40±18.56
120.67±15.24 [116.62-124.71] NS Diastolic blood pressure
(mm Hg) [80.10-87.48]83.79±13.91
80.51±8.25
[78.32-82.70] NS Hyperglycemia 14 (24.14) 20 (34.48) NS Impaired FPG 3 (5.17) 8 (13.79) NS Type 2 diabetes 5 (8.62) 5 (8.62) NS Data given as mean±standard deviation [95% Confidence Interval] for continuous variables or n (%) for discrete variables.
47.2% in the 80-89 years of age group in men and 64.4% for women in the corresponding age groups [27]. Large meta-analysis (n = 25,692) re- Large meta-analysis (n = 25,692) re-eta-analysis (n = 25,692) re-,692) re-692) re-vealed that the overall rate of MetS in schizo-phrenia and related disorders is 32.5% [28]. De Hert et al. reported MetS prevalence in patients with schizophrenia treated with antipsychot-ics of 28.4% (ATPIII), 32.3% (ATPIII A) and 36% (IDF) [4]. Therefore, the rate of MetS at discharge observed in our study is a lot higher than re- higher than re-ported in other European studies. Our results are close to those observed in Clinical Antipsy-close to those observed in Clinical Antipsy- to those observed in Clinical Antipsy-observed in Clinical Antipsy- in Clinical Antipsy-chotic Trials of Intervention Effectiveness (CAT-IE) Study (ATPIII: 40.9%; ATPIII A: 42.7%) [29]. Our study on the prevalence of MetS in adults
schizophrenics taking antipsychotics re-confirms high prevalence of MetS in this popula-tion, reaching as much as twice (or even thrice) the prevalence of the general pop-the prevalence of the general pop-ulation.
We have also demonstrated the preva-demonstrated the preva- the preva-lence of individual MetS components to be higher than in other studies. De Hert et al. found abdominal obesity, raised blood pressure, reduced HDL, raised TGA and raised FPG in 62.1%, 48.8%, 29.8%, 42.3% and 25.3% of patients, respectively [4]. The corresponding rates (IDF criteria) in our study are: 75.9%, 62.1%, 63.8%, 41.4% and 25.9% on admission and 79.3%, 53.4%, 55.2%, 58.6% and 37.9% at discharge. Our results are also higher than reported by Sicras-Mainar et al. (ATPIII A): abdomi-nal obesity (defined as BMI >28.8 kg/m2) 17.8%, raised blood pressure 24.3%, re-duced HDL 29.3%, raised TGA 11.2% and raised FPG 9.7% [30).
emphasizes the importance of prop-er hypprop-ertension treatment and man-agement in patients with mental dis-orders.
Our results indicate one more im-portant finding that it is imim-portant to monitor metabolic parameters during out-hospital treatment with antipsychotics. While a detrimental effect of this type of drugs are well established, they may remain un-detected during the first weeks of treatment. This would indicate that during a relatively short period of time (mean hospital stay was ap-proximately 8 weeks) severe meta-bolic alterations may not occur, but they develop during the next weeks or months.
In our study population mean values of BMI and waist circumfer-ence exceeded upper normal limits (as defined by WHO and IDF). We also found that mean total choles-terol levels were above upper limit of normal range (ULN), while mean TGA levels were above ULN at dis- at dis-charge. Mean value of atherogenic indices AILDL/HDL and AITC/HDL were above respec-were above respec-ere above respec- above respec- respec-tive ULN. Moreover, a very high (up to 89%) prevalence of increased body weight, abdomi-nal obesity (which was significantly more fre-quent in women) and hyperlipidemia was found in patients taking antipsychotics. This confirms that physical health condition of people taking antipsychotics (regardless they have metabol-ic syndrome or not) is very poor [31]. Since in- very poor [31]. Since in- poor [31]. Since in-creased mortality and morbidity is potentially preventable by improving medical treatment, our finding that the majority (more than 80%) of patients with hyperlipidemia did not receive specific treatment is alarming.
Although the prevalence of cigarette smoking among schizophrenics can be up to 90% (32], our result (41.38%) is almost twice as high as in the general population [33]. Since there is a well known adverse effect of smoking on LDL and HDL cholesterol, and triglycerides in a hyper- cholesterol, and triglycerides in a hyper-cholesterolemic population, regardless of age [34], this indicates an area for possible improve-, this indicates an area for possible improve-ment.
Table 5. Framingham cardiovascular risk scores
On admission At discharge P
Coronary Heart Disease 2-year risk (%)
0.88±1.31 [0.53-1.22]
0.79±1.39 [0.43-1.16] NS Coronary Heart Disease
10-year risk (%)
7.19±8.45 [4.97-9.41]
6.07±6.43 [4.38-7.76] NS Type 2 diabetes
8-year risk (%)
6.52±7.50 [4.54-8.49]
7.55±8.36 [5.35-9.75] NS General Cardiovascular Disease
10-year risk (%)†
8.00±9.24 [5.55-10.45]
6.60±7.26 [4.67-8.53] NS Hard Coronary Heart Disease
10-year risk (%)‡
5.60±7.64 [3.59-7.61]
4.41±5.90 [2.86-5.96] NS Recurring Coronary Heart Disease
2-year risk (%)§
4.10±2.87 [3.35-4.86]
4.15±2.95 [3.38-4.93] NS Stroke
10-year risk (%)
4.10±3.43 [3.20-5.01]
3.46±2.19 [2.89-4.04]
0.043 z = 2.02 Hypertension
4-year risk (%)
22.18±18.04 [17.44-26.92]
16.58±13.18 [13.11-20.05]
0.043 z = 2.02 All data given as mean±SD [95% Confidence Interval]. NS = non-signifi-cant. †Coronary death, myocardial infarction, coronary insufficiency, angi-na, ischemic stroke, hemorrhagic stroke, transient ischemic attack, periph-eral artery disease, heart failure. ‡ Myocardial infarction or coronary death. § Mostly hospitalized events consisting of myocardial infarction, coronary in-sufficiency, angina pectoris, and sudden and non-sudden coronary death.
Every research has its limitations, and so has this one. Our sample size is relatively small and so is the time interval between the two observa-tions (the period of follow-up was only about 8 weeks). This unlikely to have a significant im-pact on the Framingham risk scores. Therefore, detailed analysis of some factors (e.g. individu-al antipsychotics) was not possible. Second, due to a naturalistic study design, a sufficient control for the effect of different pharmacological treat-ments is limited. The majority of subjects were on polypharmacy, so it was difficult to analysis and discuss. Moreover, it results in heterogene-ity of the study group (e.g. in terms of treatment duration, types and doses of antipsychotics). Since patients were recruited only in one site, this could have also affected our results. Data on physical activity and diet were not available for analysis. We cannot analyzed data regard- We cannot analyzed data regard-ing the duration of the mental disorder the sub-jects were diagnosed. Also, we did not use rat-ing scales to demonstrate the symptomatology and the severity of the schizophrenia.
CONCLuSIONS
Between admission and discharge, the preva-lence of MetS did not increase. Very high rate of MetS in patients treated with antipsychotics that we found in this study (up to 60.34%) exceeds MetS prevalence in general population. Signifi-cantly more subjects had raised triglycerides lev-els at discharge. Other MetS components did not improve. Most patients had at least one compo-nent of MetS. Abdominal obesity, raised TGA, reduced HDL cholesterol and raised blood pres-sure were the most frequent MetS components. No metabolic parameters improved after hospi-tal stay, while triglyceride levels and the num-ber of subjects with hyperglycemia increased significantly during in-hospital treatment. The risk of cardiovascular events did not increase. Framingham risk scores for stroke and hyper-tensions were significantly lower at discharge, yet this could be an artifact. The majority of our subjects were overweight or obese, had abdom-inal obesity and lipid abnormalities. A very im-portant clinical finding was that the majority of patients with hyperlipidemia had no antihyper-lipidemic treatment introduced. The prevalence
of tobacco use is still too high. Metabolic param-eters should be monitored, particularly in out-should be monitored, particularly in out-patient settings, on a regular basis using availa-ble algorithms.
REFERENCES
1. Alberti KG, Zimmet P, Shaw J. Metabolic syndrome--a new world-wide definition. A Consensus Statement from the In-ternational Diabetes Federation. Diabet Med. 2006; 23: 469–480.
2. Grundy SM, Brewer HBJ, Cleeman JI, Smith SCJ, Lenfant C. Definition of metabolic syndrome: Report of the Nation-al Heart, Lung, and Blood Institute/American Heart Associa-tion conference on scientific issues related to definiAssocia-tion. Cir-culation. 2004; 109: 433–438.
3. Kowalski J, Barylski M, Godala M, Irzmański R, Brocka E, Pawlicki L. Estimation of cardiovascular complications and death risk in subjects with metabolic syndrome. Arch Med Sci. 2006; 2: 252–255.
4. De Hert MA, van Winkel R, Van Eyck D, Hanssens L, Wampers M, Scheen A, Peuskens J. Prevalence of the met-abolic syndrome in patients with schizophrenia treated with antipsychotic medication. Schizophr Res. 2006; 83: 87–93. 5. Correll CU, Frederickson AM, Kane JM, Manu P. Metabolic
syndrome and the risk of coronary heart disease in 367 pa-tients treated with second-generation antipsychotic drugs. J Clin Psychiatry. 2006; 67: 575–583.
6. Teixeira PJ, Rocha FL. The prevalence of metabolic syn-drome among psychiatric inpatients in Brazil. Rev Bras Psiq-uiatr. 2007; 29: 330-336.
7. McIntyre RS, Park KY, Law CW et al. The association be-tween conventional antidepressants and the metabolic syn-drome: a review of the evidence and clinical implications. CNS Drugs. 2010; 24: 741–753.
8. Auquier P, Lancon C, Rouillon F, Lader M, Holmes C. Mor-tality in schizophrenia. Pharmacoepidemiol Drug Saf. 2006; 15: 873–879.
9. Tiihonen J, Lonnqvist J, Wahlbeck K, Klaukka T, Niskanen L, Tanskanen A, Haukka J. 11-year follow-up of mortality in patients with schizophrenia: a population-based cohort study (FIN11 study). Lancet. 2009; 374: 620–627.
10. Goff DC, Sullivan LM, McEvoy JP et al. A comparison of ten-year cardiac risk estimates in schizophrenia patients from the CATIE study and matched controls. Schizophr Res. 2005; 80: 45–53.
12. Brown S, Birtwistle J, Roe L, Thompson C. The unhealthy lifestyle of people with schizophrenia. Psychol Med. 1999; 29: 697–701.
13. Dipasquale S, Pariante CM, Dazzan P, Aguglia E, McGuire P, Mondelli V. The dietary pattern of patients with schizophrenia: a systematic review. J Psychiatr Res. 2013; 47: 197–207. 14. Oud MJ, Schuling J, Groenier KH, Verhaak PF, Slooff CJ,
Dekker JH, Meyboom-de Jong B. Care provided by gener-al practitioners to patients with psychotic disorders: a cohort study. BMC Fam Pract. 2010; 11: 92.
15. Castelli WP, Abbott RD, McNamara PM. Summary estimates of cholesterol used to predict coronary heart disease. Circu-lation. 1983; 67: 730–734.
16. D’Agostino RB, Russell MW, Huse DM, Ellison RC, Silber-shatz H, Wilson PW, Hartz SC. Primary and subsequent cor-onary risk appraisal: new results from the Framingham study. Am Heart J. 2000; 139: 272–281.
17. Wilson PW, D’Agostino RB, Levy D, Belanger AM, Sil-bershatz H, Kannel WB. Prediction of coronary heart dis-ease using risk factor categories. Circulation. 1998; 97: 1837–1847.
18. Wilson PW, Meigs JB, Sullivan L, Fox CS, Nathan DM, D’Agostino RBS. Prediction of incident diabetes mellitus in middle-aged adults: the Framingham Offspring Study. Arch Intern Med. 2007; 167: 1068–1074.
19. D’Agostino RBS, Vasan RS, Pencina MJ, Wolf PA, Cobain M, Massaro JM, Kannel WB. General cardiovascular risk profile for use in primary care: the Framingham Heart Study. Circu-lation. 2008; 117: 743–753.
20. D’Agostino RB, Wolf PA, Belanger AJ, Kannel WB. Stroke risk profile: adjustment for antihypertensive medication. The Framingham Study. Stroke. 1994; 25: 40-43.
21. Parikh NI, Pencina MJ, Wang TJ et al. A risk score for pre-dicting near-term incidence of hypertension: the Framingham Heart Study. Ann Intern Med. 2008; 148: 102–110.
22. Maumus S, Marie B, Siest G, Visvikis-Siest S. A prospec-tive study on the prevalence of metabolic syndrome among healthy french families: two cardiovascular risk factors (HDL cholesterol and tumor necrosis factor-alpha) are revealed in the offspring of parents with metabolic syndrome. Diabetes Care. 2005; 28: 675–682.
23. Hu G, Qiao Q, Tuomilehto J, Balkau B, Borch-Johnsen K, Py-orala K. Prevalence of the metabolic syndrome and its rela-tion to all-cause and cardiovascular mortality in nondiabet-ic European men and women. Arch Intern Med. 2004; 164: 1066–1076.
24. Szurkowska M, Szafraniec K, Gilis-Januszewska A, Pach D, Krzentowska A, Szybinski Z, Huszno B. [Prevalence of the metabolic syndrome and its components in adult inhabitants of Krakow]. Przegl Lek. 2006;63:733–737.
25. Sidorenkov O, Nilssen O, Brenn T, Martiushov S, Arkhipovsky
VL, Grjibovski AM. Prevalence of the metabolic syndrome
and its components in Northwest Russia: the Arkhangelsk study. BMC Public Health. 2010; 10: 23.
26. Ford ES, Giles WH, Dietz WH. Prevalence of the metabolic syndrome among US adults: findings from the third National Health and Nutrition Examination Survey. JAMA. 2002; 287: 356–359.
27. Hildrum B, Mykletun A, Hole T, Midthjell K, Dahl AA. Age-spe-cific prevalence of the metabolic syndrome defined by the In-ternational Diabetes Federation and the National Cholester-ol Education Program: the Norwegian HUNT 2 study. BMC Public Health. 2007; 7: 220.
28. Mitchell AJ, Vancampfort D, Sweers K, van Winkel R, Yu W, De Hert M. Prevalence of metabolic syndrome and metabolic abnormalities in schizophrenia and related disorders--a sys-tematic review and meta-analysis. Schizophr Bull. 2013; 39: 306–318.
29. McEvoy JP, Meyer JM, Goff DC et al. Prevalence of the met-abolic syndrome in patients with schizophrenia: baseline re-sults from the Clinical Antipsychotic Trials of Intervention Ef-fectiveness (CATIE) schizophrenia trial and comparison with national estimates from NHANES III. Schizophr Res. 2005; 80: 19–32.
30. Sicras-Mainar A, Blanca-Tamayo M, Rejas-Gutierrez J, Na-varro-Artieda R. Metabolic syndrome in outpatients receiv-ing antipsychotic therapy in routine clinical practice: a cross-sectional assessment of a primary health care database. Eur Psychiatry. 2008; 23: 100–108.
31. Brown S, Inskip H, Barraclough B. Causes of the excess mortality of schizophrenia. Br J Psychiatry. 2000; 177: 212–217.
32. Dervaux A, Laqueille X. [Smoking and schizophrenia: ep-idemiological and clinical features]. Encephale. 2008; 34: 299–305.
33. Smith SS, Fiore MC. The epidemiology of tobacco use, de- Smith SS, Fiore MC. The epidemiology of tobacco use, de-Smith SS, Fiore MC. The epidemiology of tobacco use, de-pendence, and cessation in the United States. Prim Care. 1999; 26: 433–461.
![Table 2. Demographic and clinical details. All (N = 58) Men (n = 22) Women (n = 36) P† Age 38.48±1.67 [35.13-41.83] 34.82±2.60 [29.41-40.23] 40.72±2.12 [36.42-45.02] 0.043 t = 1.74 Tobacco smoking 24 (41.38) 9 (40.91) 15 (41.67) NS](https://thumb-eu.123doks.com/thumbv2/123dok_br/17157922.240508/4.934.118.811.184.1055/table-demographic-clinical-details-men-women-tobacco-smoking.webp)
![Table 4. Changes in metabolic parameters On admission At discharge P Body weight (kg) 82.43±21.65 [76.69-88.17] 82.38±20.94 [76.82-87.93] NS BMI (kg/m 2 ) 28.49±6.38 [26.80-30.18] 28.47±6.06 [26.86-30.07] NS Waist circumference (cm) 96.54±15.91 [92.32-100.](https://thumb-eu.123doks.com/thumbv2/123dok_br/17157922.240508/6.934.116.502.186.807/table-changes-metabolic-parameters-admission-discharge-weight-circumference.webp)