Pharmacokinetic and Genomic Effects
of Arsenite in Drinking Water on Mouse
Lung in a 30-Day Exposure
Jaya Chilakapati
1, Kathleen Wallace
2, Araceli Hernandez-Zavala
3,
Tanya Moore
2, Hongzu Ren
2, and Kirk T. Kitchin
2Abstract
The 2 objectives of this subchronic study were to determine the arsenite drinking water exposure dependent increases in female C3H mouse liver and lung tissue arsenicals and to characterize the dose response (to 0, 0.05, 0.25, 1, 10, and 85 ppm arsenite in drinking water for 30 days and a purified AIN-93M diet) for genomic mouse lung expression patterns. Mouse lungs were analyzed for inorganic arsenic, monomethylated, and dimethylated arsenicals by hydride generation atomic absorption spectroscopy. The total lung mean arsenical levels were 1.4, 22.5, 30.1, 50.9, 105.3, and 316.4 ng/g lung tissue after 0, 0.05, 0.25, 1, 10, and 85 ppm, respectively. At 85 ppm, the total mean lung arsenical levels increased 14-fold and 131-fold when compared to either the lowest noncontrol dose (0.05 ppm) or the control dose, respectively. We found that arsenic exposure elicited minimal numbers of differentially expressed genes (DEGs; 77, 38, 90, 87, and 87 DEGs)after 0.05, 0.25, 1, 10, and 85 ppm, respectively, which were associated with cardiovascular disease, development, differentiation, apoptosis, proliferation, and stress response. After 30 days of arsenite exposure, this study showed monotonic increases in mouse lung arsenical (total arsenicand dimethylarsinic acid) concentrations but no clear dose-related increases in DEG numbers.
Keywords
arsenic, mice, drinking water, genomics, dose response
Introduction
Inorganic arsenic causes cancer in skin, bladder, lung, liver, and kidneys. Arsenic causes lung cancer via inhalation and ingestion of drinking water.1In 2001, the United States Envi-ronmental Protection Agency (EPA) set the arsenic drinking water standard of 0.01 ppm2 based on extrapolation of the human cancer data from the high arsenic exposure areas in Taiwan.3 In 2002, the International Agency for Research on Cancer (IARC) classified arsenic in drinking water as a cause of lung, bladder, and skin cancers.3
Much is known about arsenic-induced carcinogenic effects in urinary bladder and skin. Lung cancer is the leading cause of cancer-related mortality in the United States and worldwide. The IARC has classified arsenic as a group 1 carcinogen for lung cancer.3 Humans exposed to inorganic arsenic in their drinking water have demonstrated elevated risks of death from lung cancer in Taiwan,4,5Chile,6and Argentina.7 Epidemiolo-gic evidence supports the presence of a causal association between exposure to elevated arsenic concentrations in drink-ing water and the risk of developdrink-ing or dydrink-ing from lung cancer.
Beginning in the 1990s, epidemiological studies in Chile showed that the rate of lung and bladder cancer in arsenic-polluted areas was considerably higher than mean cancer rates of nearby areas.6,8Less is known about the risk of lung cancer at lower exposure levels than achieved in Taiwan, Chile, or Argentina. Arsenic also causes noncancer pulmonary health effects such as chronic obstructive pulmonary disease and bronchiectasis.6,9For these reasons, we conducted our studies
1Alcon Labs (R9-7), Fort Worth, TX, USA
2Integrated Systems Toxicology Division, National Health and Environmental
Effects Research Laboratory, US Environmental Protection Agency, Durham, NC, USA
3Seccio´n de Investigacio´n y Posgrado, Escuela Superior de Medicina del
Instituto Polit´ecnico Nacional, Mexico City, Mexico
Corresponding Author:
Kirk T. Kitchin, US Environmental Protection Agency, Integrated Systems Toxicology Division, 109 TW Alexander Drive (B105-03), Durham, NC 27711. Email: [email protected]
Dose-Response: An International Journal April-June 2015:1-11
ªThe Author(s) 2015 DOI: 10.1177/1559325815592392 dos.sagepub.com
primarily in the lung, a lesser studied organ that still is a large contributor to arsenic cancer-induced death in humans.
Inorganic arsenic ingested through drinking water is quickly absorbed into the bloodstream and is transported to the liver where it is metabolized through methylation processes to gen-erate monomethylarsonic acid (MMA) and dimethylarsinic acid (DMA) metabolites.10Most of the arsenic metabolites are excreted in the urine; however, some are deposited in lung, liver, kidney, nails, and hair.11In earlier toxicological thinking, arsenic was sometimes considered to be a promoter and not an initiator of carcinogenesis, as no mutagenic potential was shown in early experimental models.12 However, there has been growing evidence that MMA and DMA are cytotoxic and genotoxic in cell lines.13-17
Arsenic-induced carcinogenesis may occur through several biological mechanisms, particularly via the highly biologically
active MMA and DMA metabolites.18 These mechanisms
include chromosomal abnormalities, oxidative stress, altered DNA repair, altered DNA methylation patterns, altered growth factors, enhanced cell proliferation, promotion/progression, gene amplification, and suppression of p53.18-21Thus, several mechanisms for carcinogenesis with ingested arsenic exposure have been suggested, but the percentage of causality of each pathway and the particulars on how and when these pathways operate to cause lung cancer are not well understood.
Humans are the best model to study arsenic carcinogenesis. However, since it is not possible to study the mechanisms of carcinogenesis in humans (particularly with interior organs such as the lungs), animal models of carcinogenesis are fre-quently used. Unfortunately, with respect to exterior dose and organ susceptibility, rats and mice are not as sensitive as humans to arsenic-induced toxicity and carcinogenicity. In a recent study, whole-genome DNA methylation and gene expression changes were evaluated in lungs from female C57BL/6 mice exposed for 90 days to 50 ppm arsenate (As) in drinking water.22 This study reported a subset of 17 genes showing differential methylation that included a substantial number that has been demonstrated to play a functional role
in cancer-related processes.22Of the available arsenic rodent models (Table 1), we chose a sensitive mouse model to study the mechanisms, that is, female C3H mouse, primarily because of positive carcinogenicity data in a gestational arsenic expo-sure from the Waalkes group.24,33 The C3H mouse strain is known to have a high spontaneous incidence of tumors.34
Arsenic can elicit many diverse effects in humans as well as in animal models. It is now well accepted that more than 1 causal mechanism may be involved in its carcinogenic poten-tial (eg, oxidative stress, sulfhydryl group occupancy, DNA methylation, etc). With greater use of appropriate animal mod-els, particularly with various chronic or subchronic in vivo exposures using arsenic, a better understanding of the adverse effect can be achieved and an easier extrapolation to human exposures be made. A major question that remains to be answered is the level of risk of cancer with human arsenic exposure, particularly in the low-exposure range of 0 to approximately 200 ppb arsenic. In the United States, some past arsenic exposures might have reached 0.05 to 0.2 ppm in cer-tain areas, but in the future, major regulated American water systems should be at 0.01 ppm or lower.2
The objective of this subchronic study was to characterize both the dose–response relationship for tissue arsenical accu-mulation in mouse lung and liver (a well-studied organ for arsenical speciation) and the gene expression patterns involved in arsenical-induced lung effects in female C3H mice. Mice were administered sodium arsenite via drinking water at 0 (control), 0.05, 0.25, 1, 10, and 85 ppm as either elemental arsenic (lowest 2 concentrations) or as arsenite (top 3 concen-trations; Table 2). A purified diet (AIN-93M) was used to reduce arsenicals present in the diet and thereby lower the mouse tissue arsenic background levels. As a result, the effects of low arsenite concentrations in drinking water could be seen. Mice were exposed to sodium arsenite in their drinking water for 30 days, and the lung samples from each treatment group were analyzed for gene expression and pathway involvement to identify transcription changes that may be linked to arsenic carcinogenesis.
Table 1.Some Arsenic-Induced Tumor-Related Health Effects in Mice.
Mouse Strain Arsenic Treatment
Time of
Exposure Organ Findings Reference
A/J mice DMAV 400 ppm 50 weeks Lung Hyperplasia, adenoma, and adenocarcinoma
23
Female C3H mice
AsIII 85 ppm Gestational days 8-18 in utero
Liver, lung, adrenal, and uterus
Tumors 24,25
Ogg1-deficient mice
DMAV 200 ppm 72 weeks Lung Tumors 26
Male ddY mice DMAV 200 or 400 ppm þ4-nitroquinoline 1-oxide
25 weeks Lung Adenocarcinomas and adenosquamous carcinomas
27
K6/ODC DMAV 10 or 100 ppm, AsIII 10 ppm 5 months Skin Squamous papillomas 28
K6/ODC MMAIII 10, 50, or 75 ppm 26 weeks Skin Squamous papillomas 29
Tg.AC AsIII 200 ppmþTPA 22 weeks Skin Tumors 30
Hairless mice DMAV 1000 ppmþUVB light 25 weeks Skin Tumors 31
p53þ/– DMAV 50 ppm 80 weeks Not organ specific Tumors 32
Materials and Methods
Chemicals
Sodium arsenite (82.9%—arsenite and 17.1%—As) was pur-chased from Sigma-Aldrich (St Louis, Missouri). This arsenite–As ratio hydride generation data were obtained after the animal exposure was completed. All other chemicals used were the highest grade commercially available.
Animals
Female C3H mice (52- to 55-day old) were obtained from Charles River Laboratories (Raleigh, North Carolina). The ani-mals were housed in an AAALAC-approved animal facility at the EPA, Research Triangle Park, North Carolina, and main-tained according to the National Institutes of Health ‘‘Guideline on the Care and Use of Laboratory Animals.’’ The animal room was kept on a 12-hour light/12-hour dark cycle at a temperature of 22
C+1
C and humidity of 50%+10%. The animals were
group housed 5 per cage in clear polycarbonate cages with Alpha Dri (Shepherd Specialty Papers, Inc., Portage, MI) used as bedding.For gene expression analysis, 4 mice per dose group were utilized. The animal experimentation protocol was approved by an Institutional Animal Care and Use Committee. High levels of dietary arsenic are found in standard labora-tory chow.36A diet with high and variable background levels of the toxicant under investigation is expected to skew or mask experimental results (both pharmacokinetic and pharmacody-namics). Laboratory diet can also considerably confound the analysis of gene expression studies. The As level of purified diets (AIN-93G and AIN-93M) with an ultra-trace mineral mix was analyzed for As and found to have 20 ppb.37In our study, mice were acclimated on a purified diet, AIN-93M diet (Harlan-Tekland, Madison, Wisconsin), for 2 weeks prior to initiation of the arsenite study to allow for washout of residual arsenic in their system. Mice were provided with carbon-purified water at pH 3.3 to 3.8 as a vehicle for administration
because mice consume more water at this pH range.38 Mice also consume less deionized or distilled water when compared to carbon-purified water at all pH ranges.38
Experimental Design
Body weights, food, and drinking water consumption were mon-itored weekly. The water bottles were changed 2 times a week. Female C3H mice were exposed to increasing concentrations of arsenite (0, 0.087, 0.434, 1, 10, and 85 ppm as arsenite or 0, 0.05, 0.25, 0.58, 5.77, and 49 expressed as elemental arsenic ppm) in their drinking water (pH 3.3-3.8) for 30 days.
The EPA regulates drinking water arsenic as elemental arsenic. Therefore, the lower concentrations were selected to be 0.05 and 0.25 ppm as elemental arsenic (which is 0.087 and 0.434 ppm when expressed as arsenite). Thus, the 2 lowest concentrations come out even as elemental arsenic (0.05 and 0.25), while the 3 higher groups (1, 10, and 85) have even numbers when expressed as ppm of arsenite. In much of this article, these 5 water arsenic concentrations are simply referred to as 0.05, 0.25, 1, 10, and 85 ppm.
On day 31, the animals were euthanized using carbon diox-ide. Livers were flash frozen with liquid nitrogen and stored at
80
C. The left lungs of 4 selected mice per dose group were instilled with formaldehyde for pathology. All other lungs were removed and flash frozen in liquid nitrogen for later use. Histo-logical examination of the lungs was done by light microscopy of hematoxylin and eosin-stained slides in an unblind manner.39 A standard lesion scoring system was used for lung histology.
Lung and Liver Analysis
The determination of arsenical species (inorganic arsenic, MMA, and DMA) in tissue samples was performed using a Perkin Elmer 5100 atomic absorption spectrophotometer (Perkin-Elmer, Norwalk, Connecticut). Tissue samples (0.02-0.1 g, N¼ 5 or more per each treatment group) were
Table 2.Mouse Liver Concentrations of Arsenicals After 30-Day Exposure to a Wide Range of Drinking Water Arsenite Concentrations.
Arsenite Drinking Water Concentration, ppm as arsenite
Arsenite Drinking Water Concentration,
ppm as elemental arsenic iAs, ng/ga MMA, ng/ga DMA, ng/ga Total As, ng/ga 0 (controls) 0 (controls) Not detectedb 5.54+1.47 11.5+4.6 17.0+5.8
0.087c 0.05c 17.1+3.0d 1.33+1.19 2.3+1.1 20.7+2.0
0.434c 0.25c 19.8+0.8d Not detectedb 1.3+0.16 21.1+0.7
1 0.58 16.8+1.4d 2.04+0.17 2.4+0.3 21.2+1.9
10 5.77 27.2+1.6d 19.4+2.28d 27.5+5.3 74.0+8.6d
85 49.0 25.9+5.3d 21.6+45.4d 183.+32.7d 65.8+138d
Abbreviations: As, inorganic arsenic; EPA, United States Environmental Protection Agency; iAs, inorganic arsenic; MMA, monomethylarsonic acid; DMA, dimethylarsinic acid; SEM, standard error of the mean; MCL, maximum contaminant level.
aValues are the mean
+SEM for 5 or 6 samples. The experimental animals were adult female C3H mice. Data are expressed as ng of the arsenical, for example, arsenate, MMA(V), and DMA(V), and not as elemental arsenic. The total As is the sum of arsenate, MMA(V), and DMA(V). To decrease their background tissue arsenical concentrations, mice were fed a purified diet (AIN 93M) for 14 days prior to the study and also during the 30 days of drinking water arsenite exposure.
bThe limit of detection is about 0.2 ng/g tissue for all analytes. Arsenic drinking water concentrations are expressed as ppm sodium arsenite and as ppm elemental
arsenic in 2 different columns.
cThe lower concentrations of 0.087 and 0.434 (as arsenite) were used and not 0.05 and 0.25 ppm to make them match elemental arsenic in the lower groups, as the EPA
MCL is expressed as elemental arsenic. The higher groups at 1 to 85 are ppm of the whole compound and not as elemental arsenic. Adapted from Chilakapati et al.35
digested using 2 mol/L phosphoric acid.40This method gener-ates pentavalent arsenicals from both tri- and pentavalent arsenicals in tissues. Thus, we were unable to distinguish whether the arsenicals in the tissue samples were either in the tri- or in the pentavalent oxidation state.
Gene Expression Analysis
Frozen mouse lungs (4 mice/group) were homogenized in TRI-zol. Total RNA was isolated from mouse lungs according to the TRIzol RNA extraction protocol (Invitrogen, Carlsbad, Califor-nia) followed by RNeasy Mini Kit (RNeasy; Qiagen, Valencia, California). RNA quality was ascertained spectrophotometri-cally (ratio of A260-A280) using a NanoDrop ND-1000 spectro-photometer (NanoDrop Technologies, Wilmington, Delaware) and also by checking ratio of 18S to 28S RNA using the RNA Nano Chip on a 2100 Bioanalyzer (Agilent Technologies, Santa Clara, California). Total RNA (3 mg) was labeled using the Affymetrix One-Cycle complementary DNA Synthesis protocol and hybridized to Affymetrix Mouse Genome 430A 2.0 Gene-Chips (containing 39 000 probesets; all Affymetrix products from Affymetrix, Inc., Santa Clara, California) as described by the manufacturer. Biotin-labeled complementary RNA (cRNA) was then quantified using NanoDrop and evaluated for quality after fragmentation on a 2100 Bioanalyzer. Following overnight hybridization at 45
C to Affymetrix Mouse Genome 430A 2.0 GeneChips (for 0-85 ppm doses) in an Affymetrix Model 640 GeneChip hybridization oven, the arrays were washed and stained using an Affymetrix 450 fluidics station as recom-mended by the manufacturer and scanned on an Affymetrix Model 3000 scanner. After scanning, raw data (Affymetrix .cel files) were obtained using Affymetrix GeneChip Operating Soft-ware (version 1.4). Data (.cel files) were analyzed and statisti-cally filtered using Rosetta Resolver version 6.0 software (RosettaBiosoftware, Seattle, Washington). Differentially expressed genes (DEGs) were determined using a 1-way analy-sis of variance (P.05) by Rosetta Resolver (Microsoft, Inc. Redmond, WA), a Benjamini-Hochberg false discovery rate (FDR) multiple testing correction (<.05), followed by a Scheffe’s post hoc test and a +1.5-fold change cutoff. The DEGs were evaluated for canonical pathways and biological function using Ingenuity Pathway Analysis (Agilent Technolo-gies, Santa Clara, California). A data set containing gene identi-fiers and their corresponding expression values of fold-changes was uploaded as a tab-delimited text file. Each gene identifier was mapped to its corresponding gene object in the Ingenuity Pathways Knowledge Base. A fold-change cutoff of 1.5-fold and
P.05 was set to identify genes whose expression was differ-entially regulated. These genes were then used as the starting point for generating biological networks.
Results
Liver Arsenic Accumulation
As the mice were on a purified AIN-93M diet for over 6 weeks, the control animals accumulated very low arsenic tissue levels.
In the liver arsenical level data, biological variation occurred in the exposure range of 0 to 1 ppm arsenite without any clear treatment effects. Mice start accumulating higher concentra-tions of total arsenic in liver at 10 and 85 ppm (4.3- and 38.7-fold, respectively) as shown in Table 2. Interestingly, at 0.05, 0.25, and 1 ppm concentrations, the MMA and DMA concentrations found were considerably lower than the concen-trations of iAs (inorganic arsenic) in the liver.
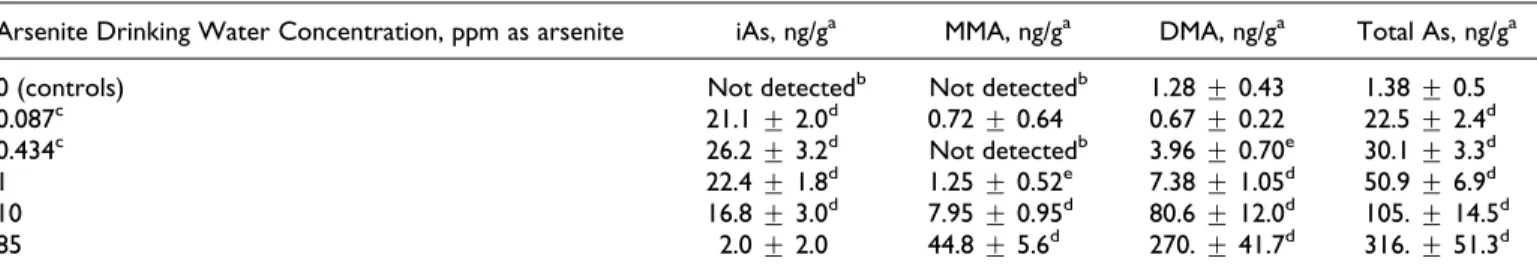
Lung Arsenic Accumulation
The control animals accumulated almost undetectable arsenic levels in their lungs. With pulmonary iAs, DMA, and total As levels, there were clear elevations observed in the 0.05, 0.25, and 1.0 ppm treatment groups. Interestingly, there was no detectable MMA in the 0.25 ppm group, which also had the lowest number of differential genes expressed. Then, similar to the liver accumulation data, mice continued to accumulate more pulmonary arsenic at 10 and 85 ppm as shown in Table 3. However, the pulmonary inorganic arsenic accumulation started declining at 10 and 85 ppm when compared to 0.05 to 1 ppm treatment groups. Mouse pulmonary arsenic was elevated, that is, 16.3-, 21.8-, 76.1-, and 229-fold in the 0.05, 0.25, 1.0, and 85 ppm treatment groups, respectively. Although the 85 ppm group has an unusually low pulmonary iAs concentration of only 2 ng/g, the pulmonary concentrations of MMA (44.8 ng/g) and DMA (27.0 ng/g) were much higher.
Pathology
By light microscopy of hematoxylin and eosin-stained sections, no significant changes in mean lesion scores occurred in the treated lung tissue (data not shown). The treated lungs resembled those of the control animals.
Dose Response in Number of Genes
There is no clear dose–response relationship in gene expression for arsenite in drinking water (Figure 1). Exposure to 0.05, 0.25, 1.0, 10, and 85 ppm resulted in 77, 38, 90, 87, and 87 DEGs, respectively.
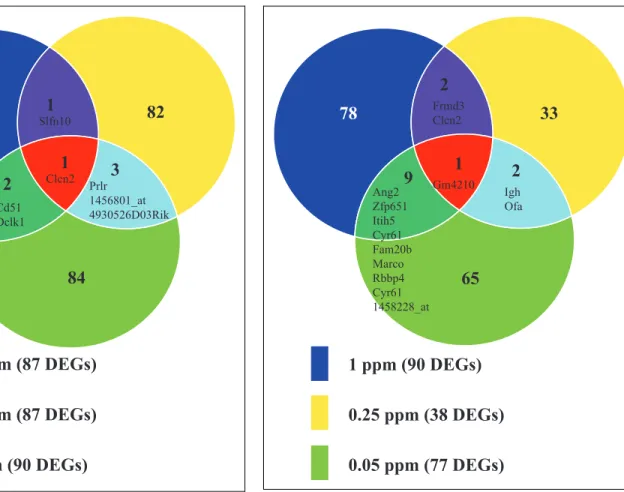
Venn Analysis
A+1.5-fold change cutoff was applied to the DEGs to conduct Venn analysis. Overall, there was not much overlap between adjacent doses. The top 3 exposures (85, 10, and 1 ppm) and bottom 3 exposures (1, 0.25, and 0.05 ppm) had 1 common gene, respectively (Figures 2 and 3).
Pathway Analysis
were modulated by drinking water arsenic exposure (Table 4). This study has shown genomic changes in the pathways of cell death (0.05 and 0.25 ppm), cell cycle (0.05 and 1 ppm), and cell growth and proliferation (0.25 ppm). All 3 pathways could be causally connected to carcinogenesis both in this mouse lung system and in other species and target organs. These 3 pathways were always statistically different at all 5 exposure levels: cell death (P values of 6.9 E-07 to 4.9 E-02), cell cycle (2.4 E-05 to 4.9 E-02), and cellular growth and proliferation (8.0 E-04 to 4.9 E-02; Table 4). Differen-tially expressed genes were mapped using Ingenuity Pathway Analysis canonical pathways (data not presented). Most bio-logical phenomena occur through interactions of multiple genes, via signaling pathways or other functional relation-ships. We could identify common pathways in the dose range used, though they were not found in each and every dose
used. Interleukin 6 and acute-phase response signaling were the only 2 that showed up at 0.25 ppm dose. Ras homolog gene family, member A (RhoA) signaling, calcium signaling, actin cytoskeleton signaling, protein kinase A signaling, and acute-phase response signaling have been noted as major pathways that overlap somewhat among the different doses. Five signaling pathways that have been significantly impacted in at least 2 dose levels of arsenic exposure (Table 5 shows a partial list of genes exhibiting differential expression in these pathways) are now sequentially presented.
Ras Homolog Gene Family, Member A Signaling
(0.05, 1, and 10 ppm)
Ras homolog gene family, member A is a critical signaling molecule regulating a variety of cellular processes, such as
Figure 1.Total number of differentially expressed genes (DEGs; with a 1.5-fold cutoff) after 0.05, 0.25, 1, 10, and 85 ppm arsenite exposure to lungs of female C3H mice at the end of 30 days of exposure via drinking water.
Table 3.Mouse Lung Concentrations of Arsenicals After 30-Day Exposure to a Wide Range of Drinking Water Arsenite Concentrations.a Arsenite Drinking Water Concentration, ppm as arsenite iAs, ng/ga MMA, ng/ga DMA, ng/ga Total As, ng/ga 0 (controls) Not detectedb Not detectedb 1.28+0.43 1.38+0.5
0.087c 21.1+2.0d 0.72+0.64 0.67+0.22 22.5+2.4d
0.434c 26.2+3.2d Not detectedb 3.96+0.70e 30.1+3.3d
1 22.4+1.8d 1.25+0.52e 7.38+1.05d 50.9+6.9d
10 16.8+3.0d 7.95+0.95d 80.6+12.0d 105.+14.5d
85 2.0+2.0 44.8+5.6d 270.+41.7d 316.+51.3d
Abbreviations: As, inorganic arsenic; EPA, United States Environmental Protection Agency; MMA, monomethylarsonic acid; DMA, dimethylarsinic acid; SEM, standard error of the mean; MCL, maximum contaminant level.
aValues are the mean+SEM for 5 or 6 samples. The experimental animals were adult female C3H mice. Data are expressed as ng of the arsenical, for example,
arsenate, MMA(V), DMA(V), and not as elemental arsenic. The total As is the sum of arsenate, MMA(V), and DMA(V). To decrease their background tissue arsenical concentrations, mice were fed a purified diet (AIN 93M) for 14 days prior to the study and also during the 30 days of drinking water arsenite exposure.
bThe limit of detection is about 0.2 ng/g tissue for all analytes. Arsenic drinking water concentrations are expressed as ppm sodium arsenite and as ppm elemental
arsenic in 2 different columns.
cThe lower concentrations of 0.087 and 0.434 (as arsenite) were used and not 0.05 and 0.25 ppm to make them match elemental arsenic in the lower groups as the EPA
cytoskeletal organization, adhesion, and apoptosis. It is recently considered responsive to reactive oxygen species (ROS).41 The RhoA is regulated by several proteins and particularly by RhoGDI proteins, which maintain RhoA in its inactive
GDP-bound form.42 DNA microarrays have revealed that
arsenite can downregulate messenger RNA levels of RhoGDI proteins.43,44 Rho-activating effect of MMAIII has been reported recently.45
Calcium Signaling (0.05 and 1 ppm)
Studies in cells show that the calcium stores and calcium recep-tors are a primary target of arsenic-induced deregulation, while the disturbance of [Ca2þ]i homeostasis is related to
reduced cell viability, DNA damage, and apoptosis.46-48 But, to introduce toxic effects, arsenic compounds do not necessarily need to be taken up and biotransformed, since they could trigger death mechanisms by interacting with the cell membrane or simply by small amounts of arsenic pass-ing through the membrane. Such instances could be suffi-cient to modify other physiological processes such as calcium homeostasis.48-50
Actin Cytoskeleton Signaling (0.05, 1, and 10 ppm)
Arsenite-caused mitochondrial damage has been shown to play a crucial role in the accumulation of ROS leading to arsenic muta-genicity in vitro.51 This increase in mitochondria-dependent ROS production by arsenite can be partly attributed to its inter-ference in the dynamics of the actin cytoskeleton.52,53 Actin carbonylation induced by H2O2results in an increase in the lag
phase and a decrease in both the polymerization rate and the polymerization extent.54 Protein carbonylation may actually interfere with the actin bundling activity and disturb the integrity of the actin cytoskeleton under arsenite exposure.55
Protein Kinase A Signaling (0.05 and 1 ppm)
Protein kinase A (PKA) regulates processes as diverse as growth, development, memory, and metabolism. The PKA rep-resents a major regulator in cyclic adenosine monophosphate (cAMP) signal transduction pathway. The PKA is a multimeric protein consisting of 2 catalytic subunits complexed with a regulatory subunit dimer.56One study demonstrated the exis-tence of synergism between arsenic and cAMP that triggers maturation pathway for acute promyelocytic leukemia (APL)
78
33
2
1
65
9
2
1 ppm (90 DEGs)
0.05 ppm (77 DEGs)
0.25 ppm (38 DEGs)
Ang2 Zfp651 Itih5 Cyr61 Fam20b Marco Rbbp4 Cyr61 1458228_at
Gm4210 Igh Ofa Frmd3
Clcn2
Figure 3.Venn analysis showing the common and unique number of significant differentially expressed genes (DEGs; with a 1.5-fold cutoff ) among the bottom 3 doses (1, 0.25, and 0.05 ppm). The names of the common genes are shown in the figure.
83
1
82
1
84
2
3
85 ppm (87 DEGs)
1 ppm (90 DEGs)
10 ppm (87 DEGs)
Prlr 1456801_at 4930526D03Rik Slfn10
Clcn2
Cd51 Dclk1
cells. Although neither arsenic nor cAMP is sufficient alone in promoting terminal differentiation, these 2 signals cooperated to induce the maturation of APL cells.57
Acute-Phase Response Signaling (0.25 and 10 ppm)
The acute-phase response is a rapid inflammatory response that provides protection against microorganisms using nonspecific defense mechanisms. In addition to infection, it can also be triggered by tissue injury, trauma or surgery, neoplastic growth, or immunological disorders. Typically, it consists of fever, an increase in inflammatory factors (such as proinflammatory cytokines), and a change in concentration of several plasma proteins (the acute-phase proteins) due largely to an altered
hepatic metabolism. Arsenic exposure is known to increase the production of ROS.58-60Alterations in intracellular oxidation– reduction (redox) reactions have been shown to activate signal cascades that regulate early response genes. This can also cause the activation of transcription factors (eg AP-1 and nuclear factorkB) and produce oversecretion of proinflammatory and growth-promoting cytokines,17,61resulting in increased cell proliferation and finally carcinogenesis.62,63
Discussion
A lot of past research effort has been directed toward the role of arsenic on carcinogenesis in either skin or urinary bladder with little emphasis on lung as the target organ. This article is
Table 4.Ingenuity Analysis of Biological Processes in Significant Differentially Expressed Genes Across All Doses.
Name 0.05 ppm 0.25 ppm 1 ppm 10 ppm 85 ppm
Cell death 169 21 96 11 11
Pvalue range 6.87E-07 to 2.80E-02 2.31E-03 to 4.81E-02 3.24E-03 to 2.83E-02 1.41E-02 to 2.89E-02 4.4E-03 to 4.85E-02
Gene expression 140 15 89 16 30
Pvalue range 3.73E-06 to 2.55E-02 5.89E-03 to 4.33E-02 5.28E-04 to 2.83E-02 1.76E-04 to 2.89E-02 7.2E-03 to 4.85E-02
Cell morphology 90 21 64 34 34
Pvalue range 6.38E-06 to 3.01E-02 2.92E-03 to 4.32E-02 2.16E-04 to 2.83E-02 7.61E-04 to 4.85E-02 7.61E-04 to 4.85E-02
Cellular development 118 15 63 12 34
Pvalue range 6.38E-06 to 3.01E-02 6.14E-03 to 4.53E-02 3.69E-04 to 2.83E-02 6.88E-03 to 2.89E-02 7.61E-04 to 4.85E-02
Cell cycle 82 15 33 12 13
Pvalue range 2.42E-05 to 2.92E-02 1.07E-02 to 4.66E-02 1.48E-04 to 2.83E-02 7.33E-03 to 2.89E-02 1E-02 to 4.85E-02
Protein synthesis 22 6 7 8 –
Pvalue range 2.51E-02 to 2.51E-02 2.82E-03 to 4.22E-02 1.84E-04 to 1.84E-04 5.58E-03 to 1.46E-02 – Carbohydrate
metabolism
12 12 8 17 15
Pvalue range 3.94E-03 to 2.54E-02 3.06E-03 to 4.85E-02 4.62E-03 to 2.83E-02 2.4E-04 to 2.49E-02 7.61E-04 to 2.76E-02 Cellular growth and
proliferation
154 24 15 7 7
Pvalue range 1.50E-03 to 2.90-02 3.06E-03 to 4.22E-02 7.99E-04 to 2.83E-02 1.46E-02 to 2.89E-02 2.24E-03 to 4.85E-02 Cellular function and
maintenance
40 12 31 13 21
Pvalue range 2.98E-03 to 2.54E-02 9.54E-03 to 4.97E-02 2.87E-05 to 2.83E-02 4.23E-03 to 2.89E-02 2.82E-03 to 3.55E-02 Cellular assembly and
organization
90 18 73 21 42
Pvalue range 4.46E-05 to 2.64E-02 9.54E-03 to 4.99E-02 1.29E-04 to 2.83E-02 2.11E-03 to 2.89E-02 2.24E-03 to 4.85E-02
Cellular compromise 23 5 24 5 10
Pvalue range 2.82E-03 to 2.54E-02 1.07E-02 to 4.22E-02 1.84E-04 to 2.83E-02 7.1E-03 to 2.89E-02 2.76E-02 to 3.07E-02 Posttranslational
modification
– – 7 4 8
Pvalue range – – 1.84E-04 to 1.84E-04 1.46E-02 to 2.21E-02 6.94E-03 to 3.75E-02
Lipid metabolism 44 11 14 24 25
Pvalue range 2.26E-04 to 2.54E-02 4.78E-03 to 4.22E-02 6.49E-03 to 2.83E-02 2.92E-06 to 2.89E-02 8.01E-04 to 4.86E-02 Small molecule
biochemistry
57 18 23 30 38
Pvalue range 2.26E-04 to 2.54E-02 4.78E-03 to 4.85E-02 4.62E-03 to 2.83E-02 2.92E-06 to 2.89E-02 7.61E-04 to 4.86E-02
Molecular transport 22 11 18 21 23
Pvalue range 1.91E-03 to 2.54E-02 4.78E-03 to 4.22E-02 4.62E-03 to 2.83E-02 2.11E-05 to 2.77E-02 4.4E-03 to 4.51E-02
Cellular movement 81 11 17 29 34
Pvalue range 6.58E-04 to 2.54E-02 7.02E-03 to 4.85E-02 1.25E-03 to 2.83E-02 1.42E-04 to 2.46E-02 1.95E-03 to 4.85E-02 RNA
Posttranscriptional modification
14 – 1 5 14
directed toward the effects of drinking water arsenic exposure on mouse lung incorporation of arsenicals and genomics. In general, mice are relatively resistant to arsenic toxicity due to their excellent metabolism and/or excretion of arsenic. How-ever, it would be interesting to try longer periods of exposure (Table 1) and then study changes at the genomic level.
This study is unique in terms of the wide dose range studied (as low as 0.087 to as high as 85 ppb, a 977-fold range in exposure). These exterior drinking water arsenite concentra-tions were found to drive a 39-fold elevation in mouse hepatic total arsenic concentration (Table 2), while in the lung an even higher 229-fold elevation in pulmonary total arsenic (Table 3) was observed. These doses reflect low to high drinking water levels in humans as well as doses required for animal carcino-genesis studies.24In this study, we found that female C3H mice do not show any evidence of arsenic-induced major clinical– biological changes at the doses and time of exposure used in this experiment but do show changes at the genomic level. We also did not find any histological evidence of toxicity in the lungs by light microscopy, although we would expect to find histological changes if longer exposure time points were used. For example in 1 time course study,64 mice showed major redox changes in liver at the 6- to 15-month time points, but few changes were observed at only 3 months after the start of arsenic exposure. Lungs are exposed to the highest oxygen tensions in the body; thus, ROS could preferentially form in pulmonary tissues.
This study is one of the few studies that has used a purified low arsenic diet. Thus, in control mice, we did not detect iAs in liver or lung, and very low total As was found in mouse lungs. Using a purified diet, increases in mouse tissue arsenic levels could be detected with arsenite exposures as low as 0.05 ppm in the case of iAs in both mouse liver and lung. At the intermedi-ate exposure concentrations of 0.25 and 1 ppm, hepatic iAs was elevated along with iAs, DMA, and total As in mouse lungs. At 10 and 85 ppm arsenite exposures, almost all tissue arsenicals were elevated often to a fairly large degree in the 5- to 225-fold
range (Tables 2 and 3). This combined pharmacokinetic–phar-macodynamic data set can be useful in better linking exterior drinking water exposure concentrations, interior speciated arsenical tissue concentration, and subsequent adverse biologi-cal effects.
This 5 exposure-level dose–response study has resulted in pulmonary and hepatic iAs, MMA, and DMA data over the unusually broad range from 0.05 to 85 ppm. These data sets could be of utility to pharmacokinetic modelers interested in (1) low exposure concentrations applicable to current human exposures and risk assessments and (b) extrapolation from ani-mal to human exposures.
A similar study was previously conducted in K6/ODC mice administered 0, 0.05, 0.25, 1.0, and 10 ppm sodium arsenite in their drinking water for 4 weeks65to identify potential biomar-kers and modes of action for skin tumorigenicity. K6/ODC transgenic mice are hairless mice, especially useful to detect the skin carcinogenicity of mutagenic chemicals administered at low doses within months of exposure.28With respect to the mouse skin study, (1) low exposures to arsenite caused an unexpectedly large number of DEGs (437-511) in the 3 lowest exposure groups and (2) the highest exposure group had the most DEGs (1227), fitting simple dose–response theories.65 With respect to the present lung study from animals eating a purified AIN-93M diet, (1) the lowest exposure group responded very well (77 DEGs), (2) surprisingly, 0.25 resulted in lower number of DEGs when compared to 0.05 ppm, and (3) at higher arsenic exposures of 10 and 85 ppm which greatly increased total, MMA, and DMA lung arsenical concentrations (Table 3), there was not a dramatic increase in DEGs found (87 DEGS at both dose levels). This lack of responsiveness to tissue total arsenicals of 76 and 229 times control levels is quite unexpected and hard to explain. If the pulmonary responses were largely driven by the arsenite concentration alone, the observed pattern makes more sense. In pulmonary iAs concen-tration, there is a big jump from not detected to 21 ng/g iAs when compared to the control and 0.05 ppm groups. Increasing
Table 5.Sodium Arsenite Dose–Response Altered Gene Expression in 5 Common Significantly Impacted Pathways.
Pathway/Gene Gene Symbol Gene ID 0.05 ppm 0.25 ppm 1 ppm 10 ppm 85 ppm
RhoA signaling ACTA1 11459 1.61
Calcium signaling CREB5 231991 1.60
MYH8 17885 2.32
Actin cytoskeleton signaling ACTA1 11459 2.07 1.61
MYH8 17885 2.32
PXN 19303
Protein kinase A signaling CREB5 231991 1.60
GRK1 24013 3.23
PDE3A 54611 1.53
PXN 19303 2.07
Acute-phase response signaling ALB 11657 6.29
APOA1 11806 3.50
IKBKE 56489 2.22
SERPINA1 20703 14.1
TTR 22139 25.3
the exposure level to 10 ppm did not increase lung iAs concen-trations. At 85 ppm arsenite exposure, the pulmonary iAs was actually decreased to 2 ng/g only about 10%of what it was at
lower exposures. Venn analysis of the top and bottom 3 doses showed that the effects are fairly different across this wide dose range and that arsenic can be acting differently in different regions of the exposure range, more dependent on the dose than similar based on the same exposure compound. In both of these studies (and the current study),65 arsenic-induced genomic effects often appear only over certain dose windows and are not simple monotonic (always increasing or decreasing) biological effects. The large dose range used and the large amount of spacing between the drinking water doses in our studies have produced a genomic data set with many nonmonotonic effects, just as in a prior arsenic study in K6/ODC mice.65
In comparing these 2 similar dose–response studies with arsenite, one is struck with several overall facts: (1) lower arsenite concentrations are responding much more than antici-pated or easily explained, (2) simple monotonic dose–response models are not well matching the experimental results, and (3) the lowest arsenite exposures of 50 ppb (the former American maximum contaminant level [MCL]) showed both observable effects and a higher number of DEGs than did at least 1 higher exposure concentrations. From this, we conclude that genomic dose–response studies of arsenicals in vivo after longer expo-sure times are still in their infancy and we are not close to understanding the types of genomics results that are being obtained. If arsenic operates via multiple mechanisms in mul-tiple dose windows, then one would expect a genomics pattern as complex as the one actually observed. Nevertheless, such low-level subchronic exposures are the key to understanding important chronic diseases such as arsenic-induced carcinogen-esis and cardiovascular diseases.
In the attempt to link mouse lung arsenical concentrations (Table 3) with genomic effects (Tables 4 and 5), one can see where the larger mouse lung arsenicals increases are (e. g. 0.087 ppm for iAs, 10 ppm for DMA) as the exterior arsenite dose is increased. Based on Table 3 data, from control to 0.087 ppm arsenite, the lung iAs appears to be the likely driver of genomic effects. Increasing to 0.434 ppm arsenite, the large increase from 0.67 to 3.96 ng/g lung DMA is notable. At 1, 10, and 85 ppm arsenite, both mouse lung MMA and DMA concentrations rose dramatically, without major increases in lung iAs concentration (Table 3). Thus, depending where you are on the dose–response curve, the more likely genomic driv-ers are iAs (0.087 ppm), DMA (0.434 ppm), or MMA and DMA together (1, 10, and 85 ppm).
Genes identified via microarray in screening of tissues exposed to arsenic are a valuable tool in determining the mechanism of arsenic toxicity and cancer formation. Gene expression changes can act as sensitive indicators of molecular processes at doses where standard toxicological end points are not responsive and these genomic changes could provide insights into the precursor events that might eventually lead to serious disease outcomes.66Moreover, genomic tools have the potential to uncover adverse events at treatment levels
below the limits of detection of traditional measures of toxicity, at much earlier times, and provide a wealth of mechanistic information.66The list of candidate genes and processes iden-tified in this study will need further investigation to confirm their role in events that occur at low exposures to arsenic and that could potentially lead to carcinogenicity following chronic exposure of iAs to mice.
In summary, this study demonstrates that exposure to drink-ing water arsenic at levels that have been found in the past in US drinking water (0.05 ppm) is associated with altered geno-mic expression profiles in the C3H mouse lung. A definitive understanding of the various mechanisms of arsenic action in experimental animal models will both provide useful data and assist in model selection and development in arsenic risk assessment. With further validation, some of these genes may be useful as intermediate biomarkers in studies investigating arsenic-associated chronic diseases. Future investigation of the effects of arsenic on the function of these pathways is war-ranted. These data identify pathways that will help guide inves-tigations into mechanisms of arsenic’s health effects and help clarify the threshold for biologic effects and potential disease risk. These data not only facilitate understanding the mechan-ism of lung carcinogenicity of iAs but also provide useful information for establishing an appropriate animal model for pulmonary arsenic risk assessment.
Acknowledgments
We thank Gail Nelson and Janice S. Lee for reviewing this manuscript as part of EPA clearance procedures.
Author’s Note
Although the research described in this article has been supported by the US Environmental Protection Agency through an EPA postdoc-toral trainee award to Jaya Chilakapati, it has not been subjected to official Agency review and therefore does not necessarily reflect the views of the Agency and no official endorsement should be inferred. This article has been approved for publication by the US EPA NHEERL clearance procedure. Mention of trade names or commercial products does not constitute endorsement or recommendation for use. This manuscript does not necessarily reflect the views of US EPA.
Declaration of Conflicting Interests
The author(s) declared no potential conflicts of interest with respect to the research, authorship, and/or publication of this article.
Funding
The author(s) disclosed receipt of the following financial support for the research, authorship, and/or publication of this article: This work was funded by the United States Protection Agency. This work was supported by UNC/EPA Cooperative Agreement EPA CR 833237.
References
1. Smith AH, Ercumen A, Yuan Y, Steinmaus CM. Increased lung cancer risks are similar whether arsenic is ingested or inhaled.
J Expo Sci Environ Epidemiol. 2009;19(4):343-348.
Accessed June 1, 2013. Updated April 27, 2015. Published September 17, 2013.
3. International Agency for Research on Cancer, 2004.Some Drink-ing Water Disinfectants and Contaminants, IncludDrink-ing Arsenic, Vol 84. Lyon, France: IARC Press; 97-156.
4. Guo HR, Chiang HS, Hu H, Lipsitz SR, Monson RR. Arsenic in drinking water and incidence of urinary cancers.Epidemiology. 1997;8(5):545-550.
5. Wu MM, Kuo TL, Hwang YH, Chen CJ. Dose response relation between arsenic concentration in well water and mortality from cancers and vascular diseases.Am J Epidemiol. 1989;130(6): 1123-1132.
6. Smith AH, Goycolea M, Haque R, Biggs ML. Marked increase in bladder and lung cancer mortality in a region of Northern Chile due to arsenic in drinking water.Am J Epidemiol. 1998;147(7): 660-669.
7. Hopenhayn-Rich C, Biggs ML, Smith AH. Lung and kidney can-cer mortality associated with arsenic in drinking water in Cor-doba, Argentina.Int J Epidemiol. 1998;27(4):561-569.
8. Sancha AM, O’Ryan R. Managing hazardous pollutants in Chile: arsenic.Rev Environ Contam Toxicol. 2008;196:123-146. 9. Smith AH, Marshall G, Yuan Y, et al. Increased mortality from
lung cancer and bronchiectasis in young adults after exposure to arsenic in utero and in early childhood.Environ Health Perspect. 2006;114(8):1293-1296.
10. Aposhian HV. Enzymatic methylation of arsenic species and other new approaches to arsenic toxicity.Annu Rev Pharmacol Toxicol. 1997;37:397-419.
11. Chiou HY, Hsueh YM, Liaw KF, et al. Incidence of internal cancers and ingested inorganic arsenic: a seven-year follow-up study in Taiwan.Cancer Res. 1995;55(6):1296-1300.
12. Goering PL, Aposhian HV, Mass MJ, Cebrian M, Beck BD, Waalkes MP. The enigma of arsenic carcinogenesis: role of meta-bolism.Toxicol Sci. 1999;49(1):5-14.
13. Ahmad S, Kitchin KT, Cullen WR. Plasmid DNA damage caused by methylated arsenicals, ascorbic acid and human liver ferritin.
Toxicol Lett. 2002;133(1):47-57.
14. Kligerman AD, Doerr CL, Tennant AH, et al. Methylated triva-lent arsenicals as candidate ultimate genotoxic forms of arsenic: Induction of chromosomal mutations but not gene mutations.
Environ Mol Mutagen. 2003;42(3):192-205.
15. Andrewes P, Kitchin KT, Wallace K. Dimethylarsine and tri-methylarsine are potent genotoxinsin vitro.Chem Res Toxicol. 2003;16(8):994-1003.
16. Styblo M, Del Razo LM, Vega L, et al. Comparative toxicity of trivalent and pentavalent inorganic and methylated arsenicals in rat and human cells.Arch Toxicol. 2000;74(6):289-299. 17. Vega L, Styblo M, Patterson R, Cullen W, Wang C, Germolec D.
Differential effects of trivalent and pentavalent arsenicals on cell proliferation and cytokine secretion in normal human epidermal keratinocytes.Toxicol Appl Pharmacol. 2001;172(3):225-232. 18. Kitchin KT. Recent advances in arsenic carcinogenesis: modes of
action, animal model systems, and methylated arsenic metabo-lites.Toxicol Appl Pharmacol. 2001;172(3):249-261.
19. Kitchin KT, Conolly R. Arsenic induced carcinogenesis – oxida-tive stress as a possible mode of action and future research needs
for more biologically based risk assessment.Chem Res Toxicol. 2010;23(2):327-335.
20. Kitchin KT, Wallace K. The role of protein binding of trivalent arsenicals in arsenic carcinogenesis and toxicity.J Inorg Bio-chem. 2008;102(3):532-539.
21. Tapio S, Grosche B. Arsenic in the aetiology of cancer.Mutat Res. 2006;612(3):215-246.
22. Boellmann F, Zhang L, Clewell HJ, et al. Genome-wide analysis of DNA methylation and gene expression changes in the mouse lung following subchronic arsenate exposure.Toxicol Sci. 2010; 117(2):404-417.
23. Hayashi H, Kanisawa M, Yamanaka K, et al. Dimethylarsenic acid, a main metabolite of inorganic arsenics, has tumorigenicity and progression effects in the pulmonary tumors of A/J mice.
Cancer Lett. 1998;125(1-2):83-88.
24. Waalkes MP, Liu J, Ward JM, Diwan BA. Animal models for arsenic carcinogenesis: inorganic arsenic is a transplacental car-cinogen in mice.Toxicol Appl Pharmacol. 2004;198(3):377-384. 25. Waalkes MP, Liu J, Ward JM, Diwan BA. Enhanced urinary bladder and liver carcinogenesis in male CD1 mice exposed to transplacental inorganic arsenic and postnatal diethylstilbestrol or tamoxifen.Toxicol Appl Pharmacol. 2006;215(3):295-305. 26. Kinoshita A, Wanibuchi H, Morimura K, et al. Carcinogenicity of
dimethylarsinic acid in Ogg1-deficient mice.Cancer Sci. 2007; 98(6):803-814.
27. Yamanaka K, Ohtsubo K, Hasegawa A, et al. Exposure to dimethylarsinic acid, a main metabolite of inorganic arsenics, strongly promotes tumorigenesis initiated by 4-nitroquinoline 1-oxide in the lungs of mice.Carcinogenesis. 1996;17(4):767-770. 28. Chen Y, Megosh LC, Gilmour SK, Sawicki JA, O‘Brien TG. K6/ ODC transgenic mice as a sensitive model for carcinogen identi-fication.Toxicol Lett. 2000;116(1-2):27-35.
29. Chen Y, O‘Brien TG, Del Razo LM, Thomas DJ, Kitchin KT. Tissue levels of arsenicals and skin tumor response following administration of monomethylarsonous acid and arsenite to K6/ ODC mice.J Environ Pathol Toxicol Oncol. 2008;27(1):43-52. 30. Germolec DR, Spalding J, Yu HS, et al. Arsenic enhancement of
skin neoplasia by chronic stimulation of growth factors.Am J Pathol. 1998;153(6):1775-1785.
31. Yamanaka K, Katsumata K, Ikuma A, Hasegawa A, Nakano M, Okada S. The role of orally administered dimethylarsinic acid, a main metabolite of inorganic arsenics, in the promotion and pro-gression of UVB-induced skin tumorigenesis in hairless mice.
Cancer Lett. 2000;152(1):79-85.
32. Salim EI, Wanibuchi H, Morimura K, et al. Carcinogenicity of dimethylarsinic acid in p53 heterozygous knockout and wild-type C57BL/6 J mice.Carcinogenesis. 2003;24(2):335-342.
33. Waalkes MP, Liu J, Ward JM, and Diwan BA. Enhanced urinary bladder and liver carcinogenesis in male CD1 mice exposed to transplacental inorganic arsenic and postnatal diethylstilbestrol or tamoxifen. Toxicol Appl Pharmacol. 2006;215(3):295-305.
34. Dragani TA, Manenti G, Pierotti MA. Genetics of murine lung tumors.Adv Cancer Res. 1995;67:83-112.
number 1587). Paper presented at:Society of Toxicology Meeting; March 2009.
36. Kozul CD, Nomikos AP, Hampton TH, et al. Laboratory diet profoundly alters gene expression and confounds genomic anal-ysis in mouse liver and lung.Chem Biol Interact. 2008;173(2): 129-140.
37. Reeves PG, Nielsen FH, Fahey GC Jr. AIN-93 purified diets for laboratory rodents: final report of the American Institute of Nutri-tion ad hoc writing committee on the reformulaNutri-tion of the AIN-76A rodent diet.J Nutr. 1993;123(11):1939-1951.
38. Ahlborn GJ, Nelson GM, Grindstaff RD, et al. Impact of life stage and duration of exposure on arsenic-induced proliferative lesions and neoplasia in C3 H mice.Toxicology. 2009;262(2): 106-113.
39. Crissman JW, Goodman DG, Hildebrandt PK, et al. Best practices guideline: toxicologic histopathology. Toxicol Pathol. 2004; 32(1):126-131.
40. Hughes MF, Devesa V, Adair BM, Styblo M, Kenyon EM, Thomas DJ. Tissue dosimetry, metabolism and excretion of pentavalent and trivalent monomethylated arsenic in mice after oral administration. Toxicol Appl Pharmacol. 2005;208(2): 186-197.
41. Cai J, Niu X, Chen Y, et al. Emodin-induced generation of reac-tive oxygen species inhibits RhoA activation to sensitize gastric carcinoma cells to anoikis.Neoplasia. 2008;10(1):41-51. 42. Olofsson B. Rho guanine dissociation inhibitors: pivotal
mole-cules in cellular signaling.Cell Signal. 1999;11(8):545-554. 43. Andrew AS, Warren AJ, Barchowsky A, et al. Genomic and
proteomic profiling of responses to toxic metals in human lung cells.Environ Health Perspect. 2003;111(6):825-835.
44. Rea MA, Gregg JP, Qin Q, Phillips MA, Rice RH. Global altera-tion of gene expression in human keratinocytes by inorganic arsenic.Carcinogenesis. 2003;24(4):747-756.
45. Lim KM, Shin YS, Kang S, et al. Potentiation of vasoconstriction and pressor response by low concentration of monomethylarso-nous acid (MMA(III)).Toxicol Lett. 2011;205(3):250-256. 46. Florea AM, Bu¨sselberg D. Arsenic trioxide in environmentally
and clinically relevant concentrations interacts with calcium homeostasis and induces cell type specific cell death in tumor and non-tumor cells.Toxicol Lett. 2008;179(1):34-42.
47. Florea AM, Splettstoesser F, Bu¨sselberg D. Arsenic trioxide (As2O3) induced calcium signals and cytotoxicity in two human cell lines: SY-5Y neuroblastoma and 293 embryonic kidney (HEK).Toxicol Appl Pharmacol. 2007;220(3):292-301. 48. Florea AM, Bu¨sselberg D. Anti-cancer drugs interfere with
intracellular calcium signaling. Neurotoxicology. 2009;30(5): 803-810.
49. Florea AM, Yamoah EN, Dopp E. Intracellular calcium distur-bances induced by arsenic and its methylated derivatives in rela-tion to genomic damage and apoptosis inducrela-tion.Environ Health Perspect. 2005;113(6):659-664.
50. Florea AM, Bu¨sselberg D. Occurrence, use and potential toxic effects of metals and metal compounds.Biometals. 2006;19(4): 419-427.
51. Liu SX, Davidson MM, Tang X, et al. Mitochondrial damage mediates genotoxicity of arsenic in mammalian cells.Cancer Res. 2005;65(8):3236-3242.
52. Gourlay CW, Carpp LN, Timpson P, Winder SJ, Ayscough KR. A role for the actin cytoskeleton in cell death and aging in yeast.
J Cell Biol. 2004;164(6):803-809.
53. Breitenbach M, Laun P, Gimona M. The actin cytoskeleton. RAS-cAMP signaling and mitochondrial ROS in yeast apoptosis.
Trends Cell Biol. 2005;15(12):637-639.
54. Dalle-Donne I, Milzani A, Colombo R. H2O2-treated actin: assembly and polymer interactions with cross-linking proteins.
Biophys J. 1995;69(6):2710-2719.
55. Lii CK, Lin AH, Lee SL, Chen HW, Wang TS. Oxidative mod-ifications of proteins by sodium arsenite in human umbilical vein endothelial cells.Environ Toxicol. 2011;26(5):459-471. 56. Skalhegg BS, Tasken K. Specificity in the cAMP/PKA signaling
pathway: differential expression, regulation, and subcellular loca-lization of subunits of PKA.Front Biosci. 2000;5:D678-D693. 57. Zhu Q, Zhang JW, Zhu HQ, et al. Synergic effects of arsenic
trioxide and cAMP during acute promyelocytic leukemia cell maturation subtends a novel signaling cross-talk. Blood. 2002; 99:1014-1022.
58. Barchowsky A, Klei LR, Dudek EJ, Swartz HM, James PE. Sti-mulation of reactive oxygen, but not reactive nitrogen species, in vascular endothelial cells exposed to low levels of arsenite.Free Radic Biol Med. 1999;27(11-12):1405-1412.
59. Barchowsky A, Roussel RR, Klei LR, et al. Low levels of arsenic trioxide stimulate proliferative signals in primary vascular cells without activating stress effector pathwaysToxicol Appl Pharma-col. 1999;159(1):65-75.
60. Liu SX, Athar M, Lippai I, Waldren C, Hei TK. Induction of oxyradicals by arsenic: implication for mechanism of genotoxi-city.Proc Natl Acad Sci U S A. 2001;98(4):1643-1648. 61. Germolec DR, Yoshida T, Gaido K, et al. Arsenic induces
over-expression of growth factors in human keratinocytes.Toxicol Appl Pharmacol. 1996;141(1):308-318.
62. Simeonova PP, Luster MI. Mechanisms of arsenic carcinogeni-city: genetic or epigenetic mechanisms.J Environ Pathol Toxicol Oncol. 2000;19(3):281-286.
63. Simeonova PP, Wang S, Toriuma W, et al. Arsenic mediates cell proliferation and gene expression in the bladder epithelium: asso-ciation with activating protein-1 transactivation. Cancer Res. 2000;60(13):3445-3453.
64. Santra A, Maiti A, Das S, Lahiri S, Charkaborty SK, Mazumder DN. Hepatic damage caused by chronic arsenic toxicity in experi-mental animals.J Toxicol Clin Toxicol. 2000;38(4):395-405. 65. Ahlborn GJ, Nelson GM, Ward WO, et al. Dose response
evalua-tion of gene expression profiles in the skin of K6/ODC mice exposed to sodium arsenite. Toxicol Appl Pharmacol. 2008; 227(3):400-416.