Adv. Sci. Res., 7, 71–81, 2011 www.adv-sci-res.net/7/71/2011/ doi:10.5194/asr-7-71-2011
©Author(s) 2011. CC Attribution 3.0 License.
Advances
in
Science & Research
Open Access ProceedingsTWINN
Results
–
Chapter
8
Development of responses based on IPCC
and “what-if?” IWRM scenarios
V. Giannini1,2, L. Ceccato1, C. Hutton3, A. A. Allan4, S. Kienberger5, W.-A. Fl ¨ugel6, and C. Giupponi1,2 1
Ca’ Foscari University of Venice, Italy
2Fondazione Eni Enrico Mattei, Venice, Italy
3GeoData Institute, Southampton, UK
4Centre for Water Law, Policy and Science, University of Dundee, UK
5Centre for Geoinformatics, University of Salzburg, Salzburg, Austria
6Department of Geoinformatics, Hydrology and Modelling, Friedrich-Schiller University Jena, Germany
Abstract. This work illustrates the findings of a participatory research process aimed at identifying responses for sustainable water management in a climate change perspective, in two river basins in Europe and Asia. The chapter describes the methodology implemented through local participatory workshops, aimed at elic-iting and evaluating possible responses to flood risk, which were then assessed with respect to the existing governance framework. Socio-economic vulnerability was also investigated developing an indicator, whose future trend was analysed with reference to IPCC scenarios. The main outcome of such activities consists in the identification of Integrated Water Resource Management Strategies (IWRMS) based upon the issues and preferences elicited from local experts. The mDSS decision support tool was used to facilitate transparent and robust management of the information collected and communication of the outputs.
1 Introduction
The BRAHMATWINN research project has planned a par-ticipatory process to integrate scientific and stakeholders’ knowledge to deal with water management, climate change, and alpine mountain regions in Europe and Asia. Two par-allel streams of research have been developed. On the one hand, research activities in the various disciplinary fields, such as climatology, hydrology, sociology, economics, and governance, relevant for integrated water resources manage-ment (IWRM) and the developmanage-ment of adaptation responses. On the other hand, a series of local workshops in the Upper Danube River Basin (UDRB) and the Upper Brahmaputra River Basin (UBRB), have been developed. The first out-come of this integrated and iterative process – the Integrated Indicator Table (IIT) – was described in Chapter 6.
Local actors’ (LA) knowledge should be used in social and ecosystem management, in order to integrate scientific with local knowledge. Thus the participation of local ac-tors can contribute significantly to the achievement of project outcomes that are better suited to fulfil local needs (de La Vega-Leinert et al., 2008), increasing the impacts of research
Correspondence to:V. Giannini ([email protected])
efforts. Participatory processes enable sharing information
between scientists and stakeholders, creating new opinions, addressing problems, combining expertise, in order to reach agreements and compromise solutions taking into account all interests at stake (Reed, 2008; Renn, 2006).
Besides the relevance given to public participation in
IWRM, the necessity of utilizing also more effective tools to
support decision making processes has emerged, giving more importance to information and communication technologies (ICT), such as Decision Support System (DSS) tools (Mysiak et al., 2005). In a DSS a conceptual model can be
formal-ized through a joint effort integrating knowledge from
dis-ciplinary and local experts, bridging the gap between “hard science” and qualitative assessments (Sgobbi and Giupponi, 2007).
In this chapter we illustrate some of the methods and
find-ings relative to the analysis of the effectiveness of the
re-sponses identified to cope with climate change. We present these as a methodological and operational proposal for the management of decision processes in a participatory context during the development of Integrated Water Resources Man-agement (IWRM) options adapting to likely climate change impacts. The feasibility of these responses and strategies are then validated with reference both to the existing gov-ernance frameworks in place, and to projected future gover-nance characteristics inferred from the IPCC SRES Scenar-ios (IPCC, 2000).
2 Role within the integrated project
The participative activities presented in this chapter, as well as those that were carried out in earlier phases of the project, made it possible to maintain open communication with cal actors, allowing the project consortium to acquire lo-cal knowledge and orient research activities towards needs. They also provided a means of carrying out the twinning of the two river basins, shedding light on commonalities and distinct features. As far as the results of the two workshops discussed in this chapter are concerned, the phases of cli-mate change scenarios presentation and brainstorming set the foundations for the DSS Design, and enabled the setting up of the activities on a common and shared framework, i.e. the features of each river basin. These phases also contributed to raise awareness about climate change dynamics, and to the state-of-the-art downscale modelling approaches. The
phases ofDSS DesignandAnalysis of Optionscarried out by
means of the mDSS software raised great interest among the participants, who were thus involved in the project activities, exposed to preliminary results, and contributed to orient the final phases of the project. Several participants appreciated the use of public domain software in particular, which pro-vided a perspective of possible reutilisation of the approach proposed in local decision problems.
3 Methods
3.1 The DSS Design and its implementation for the anal-ysis of responses
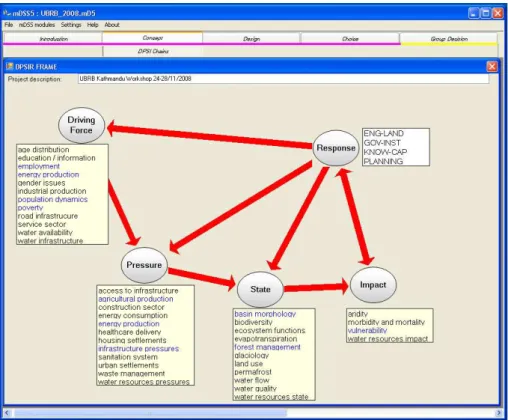
The method applied for the evaluation of the responses to cope with flood risk is developed within the NetSyMoD framework designed for natural resources management in a participatory setting (refer to Fig. 1 in Chapter 6; Giup-poni et al., 2008). NetSyMoD is based on the DPSIR causal framework (Driving forces, Pressures, State, Impacts, and Responses; EEA, 1999), which enables the organization of information, the structuring of issues, and the identification of solutions (i.e. Responses). The NetSyMoD approach is di-vided into six phases, two of these phases, DSS Design and Analysis of Options, were the object of the activities carried
out at the two workshops discussed in this chapter. The DSS Design phase consists of system specification and develop-ment of software tools capable of managing the data required for informed and robust decisions. The Analysis of Options is performed with the mDSS software (Mulino DSS), a De-cision Support System (DSS) tool providing capabilities for formalising, supporting and documenting the decision pro-cess and facilitating the adoption of Multi Criteria Decision Methods (MCDM) in a multi-actor context.
As an output of the implementation of the two steps men-tioned above, substantial contributions to the design and eval-uation of a set of alternative responses were obtained by means of group elicitation techniques and through the ap-plication of the DSS tool. The process for the identifica-tion of the IWRM strategies to be assessed, as described in Chapter 6, was based upon a series of workshops providing outputs that were organised in form of an Integrated Indica-tor Table (IIT). In the IIT (refer to Fig. 1) all the elements emerged from the interactions with stakeholders relevant for the identification of possible IWRM strategies and climate change adaptation were categorised as Responses (according to the DPSIR framework) and listed according to four broad categories:
1. ENG-LAND: Engineering Solutions and Land Manage-ment (response options would therefore include for ex-ample dam construction, river network maintenance, river training works, soil conservation practices, con-trol of glacier lake outburst floods, forest management, renaturation, etc.);
2. GOV-INST: Investments in Governance and Institu-tional Strength (response options including accountabil-ity and transparency in government actions, enforce-ment of existing regulations, flood insurance, etc.);
3. KNOW-CAP: Knowledge Improvement and Capacity Building (response options including awareness rais-ing activities, dissemination of scientific knowledge, strengthen traditional knowledge, training of public em-ployees, environmental monitoring, etc.);
4. PLANNING: Solution based on planning instruments (response options would then include design and imple-mentation of relief and rehabilitation plans, hazard zon-ing, disaster risk management, land-use planning etc.).
Two new workshops were organised, one for the UDRB in Salzburg, Austria (October 2008) and one for the UBRB in Kathmandu, Nepal (November 2008) to evaluate the
rela-tive effectiveness of the four Response categories. The
work-shops were divided into five phases.
Figure 1.The conceptualisation of the information base stored in the IIT within the DPSIR framework (screenshot of the mDSS software).
2. The second component was a brainstorming session car-ried out to validate and specify the responses within the four categories that had been identified during previous workshops.
3. In the third phase participants selected the criteria for the evaluation of responses, attributing scores to the Sub-domains listed in the IIT.
4. In the fourth phase participants weighted the selected criteria.
5. In the fifth phase of the workshops the Analysis Matrix (AM) was created using criteria and responses. Partici-pants compiled the Analysis Matrix to evaluate the
po-tential effectiveness of each of the responses (columns)
in coping with the issues expressed by the criteria (rows)
applying a Likert scale ranging from 1 “very high eff
ec-tiveness” to 5 “very low effectiveness”.
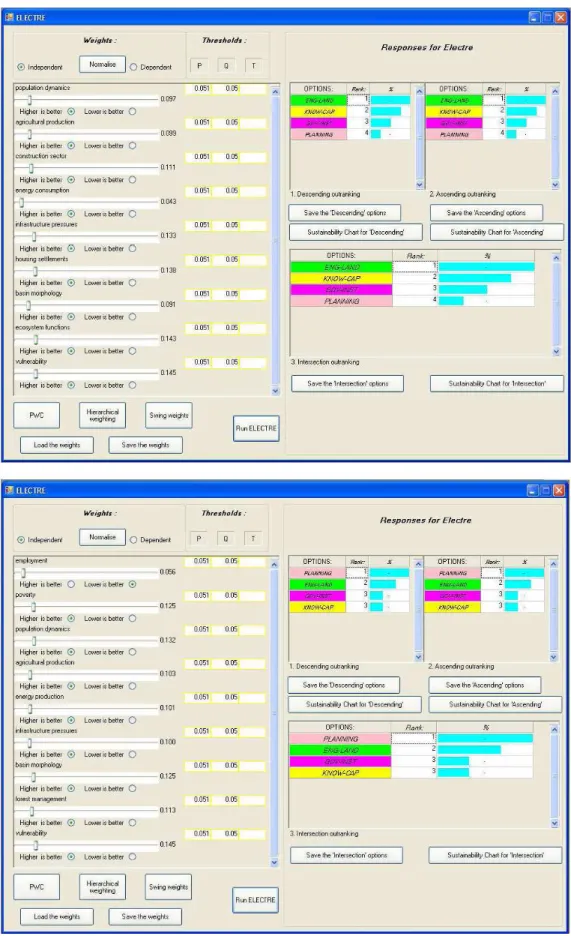
All compiled AMs were imported into the mDSS soft-ware, for Multi-Criteria Analysis (MCA) and Group Deci-sion Making (GDM), which enabled the evaluation of the
relative effectiveness of alternative responses through MCA
performed by decision rule ELECTRE III (Belton and Stew-art, 2002). Following another possibility individual prefer-ences were processed in the Group Decision Making compo-nent of mDSS using the Borda rule (de Borda, 1781).
3.2 Validation of response strategies
In order to validate the categorised possible response strate-gies identified by stakeholders (Sect. 3) against the
rele-vant governance frameworks, an effort was made to compare
these Responses to the governance and policy positions as-sessed in Chapter 4. The response strategies, at least in the short term, need to be seen in the context of these assess-ments because the governance and policy frameworks will have a strong bearing on the extent to which responses may be considered potentially successful or not (Hague Ministe-rial Declaration, 2000). The future scenarios into which this work has been incorporated are those proposed by the IPCC in 2000 (IPCC, 2000) in the Special Report Emission Sce-narios (SRES) and their associated storylines (A1, A2, B1 and B2).
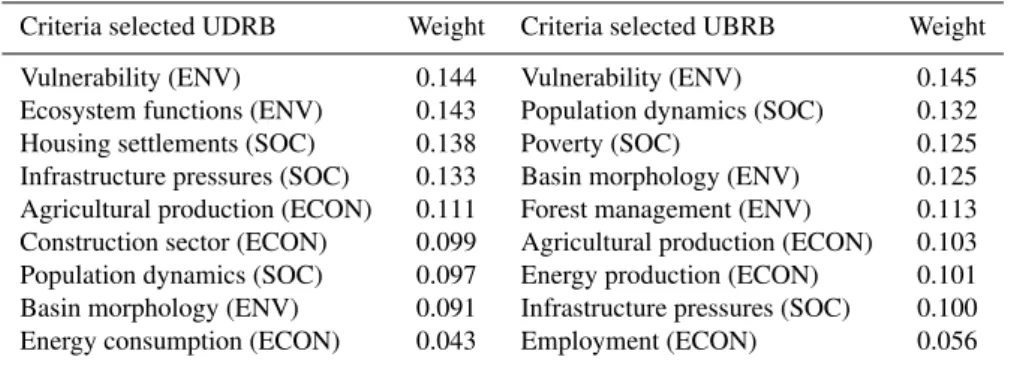
Table 1.Criteria selected by LAs from the Integrated Indicators Table.
Criteria selected UDRB Weight Criteria selected UBRB Weight
Vulnerability (ENV) 0.144 Vulnerability (ENV) 0.145
Ecosystem functions (ENV) 0.143 Population dynamics (SOC) 0.132
Housing settlements (SOC) 0.138 Poverty (SOC) 0.125
Infrastructure pressures (SOC) 0.133 Basin morphology (ENV) 0.125 Agricultural production (ECON) 0.111 Forest management (ENV) 0.113 Construction sector (ECON) 0.099 Agricultural production (ECON) 0.103
Population dynamics (SOC) 0.097 Energy production (ECON) 0.101
Basin morphology (ENV) 0.091 Infrastructure pressures (SOC) 0.100
Energy consumption (ECON) 0.043 Employment (ECON) 0.056
The SRES storylines therefore had to be deconstructed to identify the particular strands relevant to water, land and disaster management and the resulting projected governance frameworks used to flesh-out the SRES storylines. These strands include the (i) potential for institutional and interna-tional co-operation; (ii) the relative balancing of economic, social and environmental concerns; (iii) the capacity for land
use control; and (iv) the likelihood of effective enforcement.
Each response strategy was then evaluated against the pro-jected governance strengths and weaknesses derived from the SRES storylines, and against the legal and institutional real-ity in the relevant basin state.
3.3 Vulnerability scenarios
The methodology for the vulnerability scenarios comprises the following key-steps and has been carried out in the same way in the European and Asian case studies:
– Construction of a correlation analysis between the
vul-nerability score and the individual indicators and selec-tion of five key variables that are highly correlated with the vulnerability score.
– With the key variables a multivariate regression
analy-sis has been performed to identify the predictors of the level of vulnerability. Within the Salzach River basin case study two methodologies have been tested, a re-gression analysis identifying single predictors for the whole case study area (ordinary least squares method), and a geographically weighted regression which identi-fies for each location (in our case grid cells) individual, location-based predictors.
– A parallel step involves the correlation between past
GDP and population data and past data of the key vari-ables to identify their existing relationship.
– Taking the future GDP and population projections under
the four SRES scenarios in consideration, values for the future key variables under the four scenarios have been calculated.
– Applying the regression formula identified in step 2,
projected vulnerability indices have been calculated for the four scenarios for the time steps 2020 and 2050.
– In a final step the data has been normalised (scale
range 0–100) according to the values of 2000 to identify
growth and decline of vulnerability among the different
scenarios.
– Visualisation and map production was the last step
elab-orated in this procedure.
4 Results and deliverables provided
4.1 Local actors evaluation of responses
Local actors (LAs) identified the three most important crite-ria for each of the three dimensions, economic, environmen-tal and social, i.e. the three pillars of sustainable develop-ment, converging in both basins on the same five criteria out of nine, choosing from a set of 40 criteria listed in the IIT (15 social criteria, 17 environmental criteria, and 8 economic criteria) (Ceccato et al., 2010).
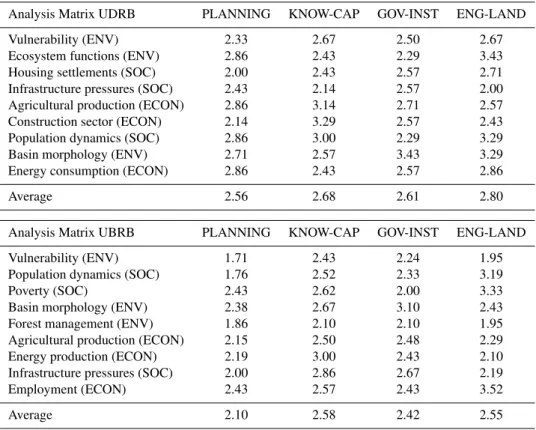
LAs then expressed the relative importance of every cri-terion, which will be used to rank the alternative IWRM re-sponses. On average, in both river basins, the highest weight was given to the “Vulnerability” criterion (Environmental pillar) (see Table 1). Five out of nine criteria selected were common to both basins: Vulnerability, Population dynam-ics, Infrastructure pressure, Basin morphology, and Agricul-tural production. The elaboration of the average Analysis Matrix (AM) shown in Table 2 illustrates that no category of response prevails. All the average responses (listed in
columns) are in a range between “very high effectiveness”
and “medium effectiveness”. We can, thus, say that all the
responses are considered to be potentially effective to cope
with flood risk.
Table 2. Analysis Matrices: average values of LAs’ evaluations on the potential effectiveness of each response in coping with the issues expressed by the criteria (rows) by means of a Likert scale ranging from 1 “Very high effectiveness” to 5 “Very low effectiveness”.
Analysis Matrix UDRB PLANNING KNOW-CAP GOV-INST ENG-LAND
Vulnerability (ENV) 2.33 2.67 2.50 2.67
Ecosystem functions (ENV) 2.86 2.43 2.29 3.43
Housing settlements (SOC) 2.00 2.43 2.57 2.71
Infrastructure pressures (SOC) 2.43 2.14 2.57 2.00
Agricultural production (ECON) 2.86 3.14 2.71 2.57
Construction sector (ECON) 2.14 3.29 2.57 2.43
Population dynamics (SOC) 2.86 3.00 2.29 3.29
Basin morphology (ENV) 2.71 2.57 3.43 3.29
Energy consumption (ECON) 2.86 2.43 2.57 2.86
Average 2.56 2.68 2.61 2.80
Analysis Matrix UBRB PLANNING KNOW-CAP GOV-INST ENG-LAND
Vulnerability (ENV) 1.71 2.43 2.24 1.95
Population dynamics (SOC) 1.76 2.52 2.33 3.19
Poverty (SOC) 2.43 2.62 2.00 3.33
Basin morphology (ENV) 2.38 2.67 3.10 2.43
Forest management (ENV) 1.86 2.10 2.10 1.95
Agricultural production (ECON) 2.15 2.50 2.48 2.29
Energy production (ECON) 2.19 3.00 2.43 2.10
Infrastructure pressures (SOC) 2.00 2.86 2.67 2.19
Employment (ECON) 2.43 2.57 2.43 3.52
Average 2.10 2.58 2.42 2.55
ELECTRE III (Fig. 2) shows that LAs of both river basins evaluated the PLANNING solution as the most promising
one. Using the Group Decision Making (GDM) tool of
mDSS, considering the Borda mark the PLANNING cate-gory is also the preferred solution (Ceccato et al., 2010). The comparison of these independent results confirmed that PLANNING instruments are the most promising responses
in terms of effectiveness to cope with flood risk under
cli-mate change impacts. We recognise, therefore, that very similar results were recorded in the two river basins,
confirm-ing that, notwithstandconfirm-ing the differences in their
environmen-tal and socio-economic conditions, the areas present certain similarities not only regarding the problems to address, but also regarding the expectations of possible solutions.
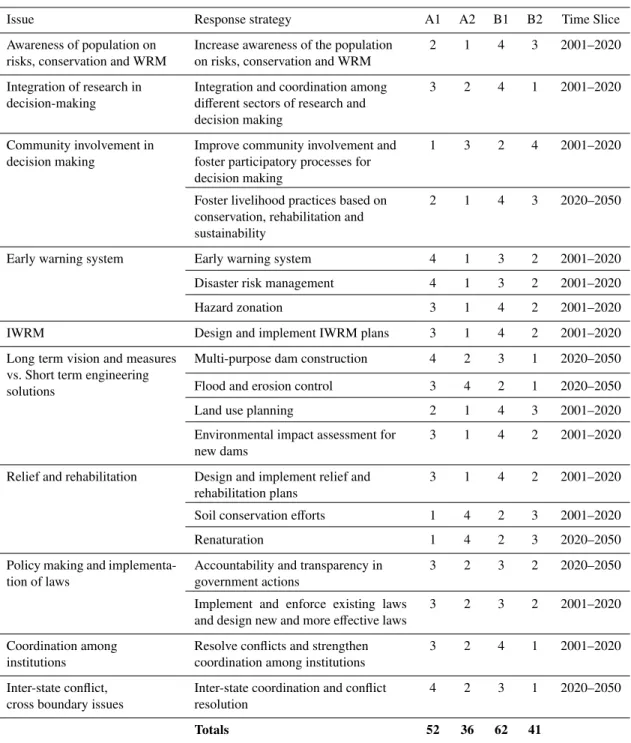
From the governance perspective, the comparison of the responses against the legal and institutional frameworks in 2007 and over the scenario time periods revealed that the B1 storyline fitted best with the responses put forward by LAs in response to the local issues, with A2 being least appropri-ate (Table 3). Based on the number of strappropri-ategies which were best suited for each storyline, B1 again came out as the win-ner, being most associated with ten strategies, but this time B2 clearly emerged as the worst, being best associated with only one. In Assam, however, the local governance context is currently strongest in relation to strategies that enforce an A1 scenario, suggesting there is a mismatch between what
stake-holders believe are the policy and strategic approaches that should be taken in order to alleviate vulnerability on the one hand, and the approach taken, at least in the short to medium term, by government and regulatory authorities.
4.2 Implementation for the Salzach River basin case study
In the modelling of socio-economic vulnerability in the Salzach River catchment 52 indicators have been identified describing various domains of vulnerability (see Kienberger et al., 2009a). Through the application of spatial correlation those indicators have been selected which have a higher cor-relation value than 0.5. Out of the 14 remaining indicators those have been selected which show a compromise with a
high correlation value (>0.7) and a significant number of
cor-relating indicators. The following five key indicators have been identified:
– Number of houses with 1 or 2 households (×1)
– Number of industrial buildings (×2)
– Number of labours in agriculture (×3)
– Number of academics (×4)
Table 3.Evaluation of suitability of Assam response strategies against projected governance characteristics of SRES Scenarios.
Issue Response strategy A1 A2 B1 B2 Time Slice
Awareness of population on risks, conservation and WRM
Increase awareness of the population on risks, conservation and WRM
2 1 4 3 2001–2020
Integration of research in decision-making
Integration and coordination among different sectors of research and decision making
3 2 4 1 2001–2020
Community involvement in decision making
Improve community involvement and foster participatory processes for decision making
1 3 2 4 2001–2020
Foster livelihood practices based on conservation, rehabilitation and sustainability
2 1 4 3 2020–2050
Early warning system Early warning system 4 1 3 2 2001–2020
Disaster risk management 4 1 3 2 2001–2020
Hazard zonation 3 1 4 2 2001–2020
IWRM Design and implement IWRM plans 3 1 4 2 2001–2020
Long term vision and measures vs. Short term engineering solutions
Multi-purpose dam construction 4 2 3 1 2020–2050
Flood and erosion control 3 4 2 1 2020–2050
Land use planning 2 1 4 3 2001–2020
Environmental impact assessment for new dams
3 1 4 2 2001–2020
Relief and rehabilitation Design and implement relief and rehabilitation plans
3 1 4 2 2001–2020
Soil conservation efforts 1 4 2 3 2001–2020
Renaturation 1 4 2 3 2020–2050
Policy making and implementa-tion of laws
Accountability and transparency in government actions
3 2 3 2 2020–2050
Implement and enforce existing laws and design new and more effective laws
3 2 3 2 2001–2020
Coordination among institutions
Resolve conflicts and strengthen coordination among institutions
3 2 4 1 2001–2020
Inter-state conflict, cross boundary issues
Inter-state coordination and conflict resolution
4 2 3 1 2020–2050
Totals 52 36 62 41
It is interesting to note that these indicators have gained high LA weights in the sub-domain ranking. So therefore the indictors do not only represent from the statistical point of view an appropriate selection but reflect some of the highest ranked indicators. However, it is important to note that the weights have not been considered in the correlation analysis.
Concluding the steps outlined above, in the final results it
can be observed that the general pattern among the different
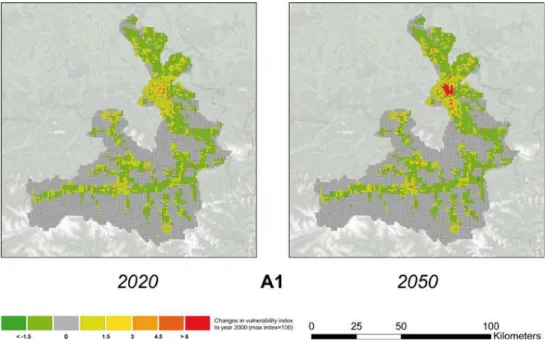
Figure 3.Change of vulnerability value within the A1 scenario to the reference year 2000.
This is an interesting fact following the general discussion on vulnerability, where it is argued that vulnerability only
ex-ists where humans are affected. In the vulnerability analysis
carried out in Chapter 4 it was also assumed that vulnerabil-ity can exist in general everywhere and is also constituted by land use assets. However, for the purpose of specific vulnera-bility scenarios, which still carry some uncertainty itself, this is a valid approach to follow.
The highest vulnerability values can be observed around the city of Salzburg, which of course is the most densely pop-ulated area in the case study, where the indicators of houses with one to two households, male full-time employees, aca-demics and industrial buildings show high values. Addi-tionally to that rural areas with a high proportion with sin-gle houses and a higher number of labours in the agricul-tural sector have slightly higher values than surrounding ar-eas. This concentrates in the case study around important central towns and villages. The highest vulnerability scores can be observed within the scenarios A1 and B1, whereas the absolutely highest vulnerability score (113.79) can be ob-served in the A1 scenario (see Fig. 3), followed by B1 with 111.65. Lower values show the 2-group scenarios A2 and B2 which have a more regional oriented focus than the glob-alised 1-group scenarios. The lowest vulnerability score is represented through the B2 scenario with a value of 107. The A2 scenario has a maximum value of 109.39 for 2050.
Examining the change rates among the different scenarios
for 2020 and 2050 in reference to the baseline year 2000 a general increase in and around the city of Salzburg can be ob-served (which show the highest increase in vulnerability) and other areas with higher values of the key indicators. Those areas show all an increase in vulnerability, whereas the
ur-ban agglomeration has the highest values for 2050 within the scenarios A1 and B1. A decrease in vulnerability can be ob-served in strongly rural dominated areas. This is also due to the fact that regression analysis shows negative trends for the indicators of labours in the agricultural sector and interest-ingly in the number of male fulltime employees.
A similar picture as described above applies for the
maxi-mum change rates within the different scenarios for the time
span between 2000 and 2050. Highest maximum increases
show the A1 (+13.79%), B1 (+11.65%) followed by A2
(+9.39%) and B2 (+7%) scenario. A significant decrease
in vulnerability can be observed in the A1 scenario with a
maximum decrease value of−2.24%. Therefore it can be
observed that the A1 scenario shows a larger dispersion of its value range than the other scenarios. Maximum decrease
values are followed by B1 (−1.89%), A1 (−1.52%) and A2
(−1.14%). The A2 scenario shows both, low increase but
also low decrease values. However, in general it can be
ob-served that the mean value of change rates is∼0%. It shows
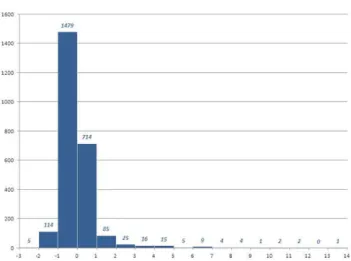
(Fig. 4) that most of the raster cells do have a low decrease or increase and that the majority of units decrease. This also fol-lows the observation in the change maps, where the increase is limited to highly urbanised areas, which only occupy a small area.
Table 4.Scenarios are based upon the work carried out by TERI (India) showing the projected GDP and Population outcomes for all India based upon the SRES scenarios (GDP×1013 Rupees, Population in millions).
A1 A2 B1 B2
GDP Pop GDP Pop GDP Pop GDP Pop
1990 0.886 846 0.886 846 0.886 846 0.886 846
2020 8.924 1.291 5.094 1.102 5.866 1.228 3.833 1.012
2050 33.426 1.572 14.298 1.646 19.027 1.298 9.304 1.646
Figure 4. Histogram of change rates for the A1 scenario between 2000 and 2050.
4.3 Implementation for the Assam case study
The aim of the Assam component of the study is to
in-vestigate how different scenarios of socioeconomic
develop-ment will mitigate the impact of climate change in the As-sam test site. The basis of this analysis is adopted from so-cioeconomic scenarios developed for India by TERI (TERI, 2006), an independent not-for-profit research institution in India (Table 4). The scenarios are developed on the basis of the Intergovernmental Panel on Climate Change (IPCC) Spe-cial Report on Emissions Scenarios (SRES) scenarios. The conceptualization of the scenarios is based on two dimen-sions of policy directions and social values. The framework focuses on where policy direction is either inward-looking or globally integrated and where social values focus on eco-nomic growth or more localised social values and environ-mental consequences. The combinations results of socioeco-nomic scenarios can be used to investigate future impacts of climate change vulnerability which relates primary to gov-ernments focus and priorities. Scenarios A2 and B2 reflect a more inward-looking policy, while scenarios A1 and B1 re-flect stronger integration with the global community for reg-ulation and economic growth.
TERI used six factors (changes in population growth, GDP projections, food grain demand, demand for water, demand for electricity and demand for wood) to investigate how the four scenarios could impact on socioeconomic vulnerability to climate change for India for the 1990s and projected to the 2020s and 2050s (Table 4). The values are adopted for this study to investigate how government priorities could impact on socio-economic vulnerability in the Assam Study Area under the four scenarios.
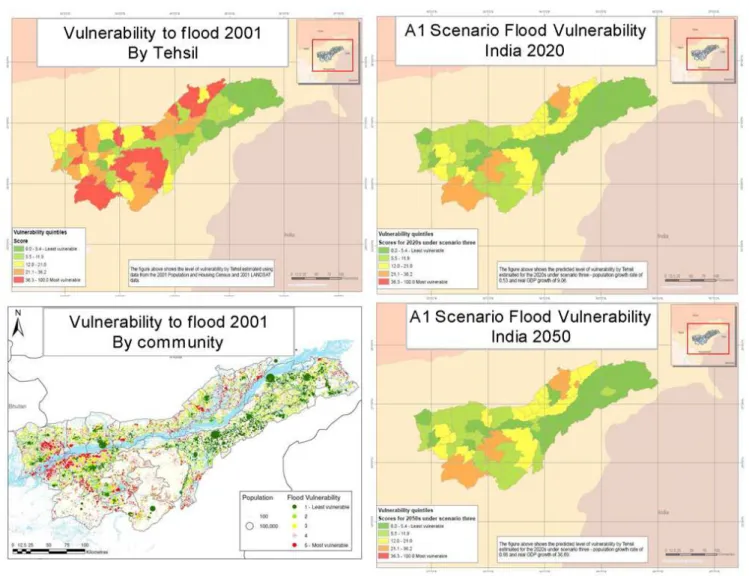
In Chapter 4 estimates of socioeconomic vulnerability in 2001 (and also for specific domains of sensitivity and adap-tive capacity) to climate hazards (e.g. floods, droughts, bank erosion) were derived for communities and Tehsils in the As-sam Study Area. The scores were exponentially scaled such that they range between 0.001 and 100 (the higher the score the higher the level of vulnerability), with emphases on the tail of the distribution to identify the most vulnerable com-munities. Figure 5 shows vulnerability quintiles for the As-sam study area in 2001 which is the last time a clear picture of vulnerability based upon the census and Landsat imagery is available (see Chapter 4).
In this follow-up study to the work presented in Chapter 4, the main aim is to investigate by how much the level of the estimated vulnerability for each Tehsil will increase or de-crease depending on governments policy directions and so-cial values under the four scenarios developed by TERI. To do this, we first identify all the individual variables that are
highly correlated (>±0.5) with the vulnerability score. In all
Figure 5.Estimates of vulnerability based upon know variables for 2001 at both a community and Tehsil level. The estimates of vulnerability to flood in 2020 and 2050 under SRES A1 (example) utilise TERI estimates of GDP and poulation and model the impact of these estimates on specific indicators of overall vulnerability.
variables. Where two or more variables were collinear, only the strongest predictor was included in the model. The es-timated Adjusted R-square indicates that the five significant indicators explain 91.7% of the variability in vulnerability scores.
5 Contribution to sustainable IWRM
The results of BRAHMATWINN show that the implementa-tion of NetSyMoD is useful for developing responses which
are then evaluated as effective. The development of
re-sponses is, in fact, based on an iterative process which
inte-grates knowledge coming from different disciplines and local
actors. The two parallel participatory processes, on the one hand, allowed the understanding of the visions and prefer-ences of LAs regarding the sustainable management of wa-ter resources. On the other hand, highlighted that the
infor-mation and tools proposed by the researchers was adequate to address local actors (e.g. decision makers and end-users) needs.
The methodology used enabled to frame the issues in a coherent manner and, thus, to focus the discussion. This, in a subsequent phase of the project, led to further refinements of the responses to cope with flood risk.
6 Conclusions and recommendations
The experimental application of the NetSyMoD approach to the twinned river basins provided the BRAHMATWINN
project with an effective interface between the research
ac-tivities and potential beneficiaries, in the case studies located in Asia and Europe.
The participative activities presented in this chapter made it possible to maintain an open communication interface with LAs, allowing the BRAHMATWINN researchers to learn from them and orient research activities. The phase of DSS design that was carried out by means of the mDSS software was followed and understood by local actors, who were able to influence the development of the following project phases.
From the perspective of assessing the potential eff
ective-ness and feasibility of response strategies, the mismatch be-tween what stakeholders believe are the policy and strategic approaches that should be taken in order to alleviate vulnera-bility on the one hand, and the approach taken, at least in the short to medium term, by government and regulatory author-ities must raise questions as to the quality of the involvement of stakeholders in decision-making processes in Assam.
The vulnerability analysis shows that GDP and population growth impacts on household and community factors that predict socioeconomic vulnerability to climate hazards, such as the proportion of the population working in agriculture, proportion of roads that are metalled, proportion of house-holds with a television, proportion of houses with burnt brick wall and proportion of households using firewood for cook-ing. The impact of GDP and population growth is highest in areas where levels of vulnerability are already high. The results depict that a slow growth in population with a concur-rent rapid growth in GDP is important in reducing levels of vulnerability.
Acknowledgements. We would like to acknowledge the
fol-lowing BRAHMATWINN research partners for helping organize the workshops: Institute for Atmospheric and Environmental Sciences, Goethe University Frankfurt (Germany); Department for Geography, Ludwig-Maximilians University, Munich, Germany; ICIMOD, Kathmandu, Nepal; Royal University of Bhutan, Thim-phu (Bhutan); Indian Institute of Technology Roorkee, Roorkee (India).
The interdisciplinary BRAHMATWINN EC-project carried out between 2006–2009 by European and Asian research teams in the UDRB and in the UBRB enhanced capacities and supported the implementation of sustainable Integrated Land and Water Resources Management (ILWRM).
References
Belton, V. and Stewart, T. J.: Multiple criteria decision analysis, Kluwer Academic Publishers, Boston, 2002.
Ceccato, L., Giannini, V., and Giupponi, C.: A participatory ap-proach to assess the effectiveness of responses to cope with flood risk, FEEM Working Paper, 28, 2010.
de Borda, J.-C.: Mathematical derivation of an election system, Isis, 44, 42–51, 1781 (English translation by A. de Grazia, 1953). de la Vega-Leinert, A., Schr¨oter, D., Leemans, R., Fritsch, U., and
Pluimers, J.: A stakeholder dialogue on European vulnerability, Reg. Environ. Change, 8, 3, 109–124, 2008.
Dobler, A., Yaoming, M., Sharma, N., Kienberger, S., and Ahrens, B.: Regional climate projections in two alpine river basins: Up-per Danube and UpUp-per Brahmaputra, Adv. Sci. Res., this special volume, 2011.
EEA: Environmental Indicators: typology and overview, edited by: European Environment Agency (EEA), Technical re-port n. 25, available at: http://reports.eea.eu.int/TEC25/en/tab content RLR (last access: March 2011), Copenhagen, 1999. Giupponi, C., Sgobbi, A., Mysiak, J., Camera, R., and Fassio, A.:
NetSyMoD – An Integrated Approach for Water Resources Man-agement, in: Integrated Water ManMan-agement, edited by: Meire, P., Coenen, M., Lombardo, C., Robba, M., and Sacile, R., Springer, Netherlands, 69–93, 2008.
Hutton, C. W., Kienberger, S., Amoako Johnson, F., Allan, A., Gi-annini, V., and Allen, R.: Vulnerability to Climate Change: Peo-ple, Place and Exposure to Hazard, Adv. Sci. Res., this special volume, 2011.
IPCC: Emission Scenarios, edited by: Intergovernmental Panel on Climate Change (IPCC), Cambridge University Press, 2000. Kienberger, S., Lang, S., and Zeil, P.: Spatial vulnerability units –
expert-based spatial modelling of socio-economic vulnerability in the Salzach catchment, Austria, Nat. Hazards Earth Syst. Sci., 9, 767–778, doi:10.5194/nhess-9-767-2009, 2009a.
Kienberger, S., Amoako Johnson, F., Zeil, P., Hutton,C., Lang, S., and Clark, M.: Modelling socio-economic vulnerability to floods: Comparison of methods developed for European and Asian case studies. Sustainable Development – a Challenge for European Research, Brussels, 2009b.
Ministerial Declaration of The Hague on Water Security in the 21st Century, 22 March 2000.
Mysiak, J., Giupponi, C., and Rosato, P.: Towards the development of a decision support system for water resource management, En-viron. Modell. Softw., 20, 2, 203–214, 2005.
Reed, M.: Stakeholder participation for environmental manage-ment: A literature review, Biol. Conserv., 141, 2417–2431, 2008. Renn, O.: Participatory processes for designing environmental
poli-cies, Land Use Policy, 23, 1, 34–43, 2006.
Sgobbi, A. and Giupponi, C.: Models and decision support sys-tems for participatory decision making in integrated water re-source management, in: CIHEAM-IAMB, Water saving in Mediterranean agriculture and future research needs, Options M´editerran´eennes: S´erie B. Etudes et Recherches 56, Bari, Italy, 259–271, 2007.