Graphic Warning Labels Elicit Affective and
Thoughtful Responses from Smokers: Results
of a Randomized Clinical Trial
Abigail T. Evans1*, Ellen Peters1, Andrew A. Strasser2, Lydia F. Emery3, Kaitlin M. Sheerin4, Daniel Romer5
1Department of Psychology, Ohio State University, Columbus, Ohio, United States of America,2Perelman School of Medicine, University of Pennsylvania, Philadelphia, Pennsylvania, United States of America, 3Department of Psychology, Northwestern University, Evanston, Illinois, United States of America, 4Department of Psychological Sciences, University of Missouri, Columbia, Missouri, United States of America,5Annenberg Public Policy Center, University of Pennsylvania, Philadelphia, Pennsylvania, United States of America
Abstract
Objective
Observational research suggests that placing graphic images on cigarette warning labels can reduce smoking rates, but field studies lack experimental control. Our primary objective was to determine the psychological processes set in motion by naturalistic exposure to graphic vs. text-only warnings in a randomized clinical trial involving exposure to modified cigarette packs over a 4-week period. Theories of graphic-warning impact were tested by examining affect toward smoking, credibility of warning information, risk perceptions, quit intentions, warning label memory, and smoking risk knowledge.
Methods
Adults who smoked between 5 and 40 cigarettes daily (N = 293; mean age = 33.7), did not have a contra-indicated medical condition, and did not intend to quit were recruited from Philadelphia, PA and Columbus, OH. Smokers were randomly assigned to receive their own brand of cigarettes for four weeks in one of three warning conditions: text only, graphic images plus text, or graphic images with elaborated text.
Results
Data from 244 participants who completed the trial were analyzed in structural-equation models. The presence of graphic images (compared to text-only) caused more negative affect toward smoking, a process that indirectly influenced risk perceptions and quit inten-tions (e.g., image->negative affect->risk perception->quit intention). Negative affect from graphic images also enhanced warning credibility including through increased scrutiny of the warnings, a process that also indirectly affected risk perceptions and quit intentions (e.g., image->negative affect->risk scrutiny->warning credibility->risk perception->quit
OPEN ACCESS
Citation:Evans AT, Peters E, Strasser AA, Emery LF, Sheerin KM, Romer D (2015) Graphic Warning Labels Elicit Affective and Thoughtful Responses from Smokers: Results of a Randomized Clinical Trial. PLoS ONE 10(12): e0142879. doi:10.1371/ journal.pone.0142879
Editor:Keitaro Matsuo, Aichi Cancer Center Research Institute, JAPAN
Received:June 29, 2015
Accepted:October 26, 2015
Published:December 16, 2015
Copyright:© 2015 Evans et al. This is an open access article distributed under the terms of the
Creative Commons Attribution License, which permits unrestricted use, distribution, and reproduction in any medium, provided the original author and source are credited.
Data Availability Statement:Interested readers will find data reported in this paper in the supplemental materials. See S1 Dataset.
intention). Unexpectedly, elaborated text reduced warning credibility. Finally, graphic warn-ings increased warning-information recall and indirectly increased smoking-risk knowledge at the end of the trial and one month later.
Conclusions
In the first naturalistic clinical trial conducted, graphic warning labels are more effective than text-only warnings in encouraging smokers to consider quitting and in educating them about smoking’s risks. Negative affective reactions to smoking, thinking about risks, and percep-tions of credibility are mediators of their impact.
Trial Registration
Clinicaltrials.govNCT01782053
Introduction
Cigarette smoking causes about 480,000 deaths in the United States (US) each year [1]. In attempts to reduce smoking-related mortality, graphic warning labels on cigarette packaging are now required in 77 countries [2] and were mandated in the US in 2009. However, the DC Circuit Court, a US judicial body that has the authority to invalidate laws it deems unconstitu-tional, blocked the graphic warning requirement, concluding in part that the images proposed by the Food and Drug Administration (FDA) were unconstitutional and“unabashed attempts to evoke emotion. . .and browbeat consumers into quitting”[3]. An earlier 2011 memorandum
predicted this later ruling:“the emotional response they were crafted to induce is. . .an
objec-tive wholly apart from disseminating purely factual and uncontroversial information”[4]. The aim of the present paper is to examine this statement in light of psychological theory about the effects of emotion on risk perception and informed decision making (from here on, we use the terms emotion, feelings, and affect interchangeably). In particular, we consider the negative affect elicited by graphic warnings to be an important source of health information and driver of cognitive processes critical to informed decisions among smokers. This paper presents data from a randomized clinical trial that is consistent with this notion.
Experimental research aligns with the court’s assertion that graphic warning labels evoke more negative emotion than text-only labels; these negative feelings also generalize to smok-ing-related cues (e.g., images of cigarettes) [5,6,7]. Despite the Court’s assertion, such emo-tional reactions to danger have been shown critical to the quick perception and reaction to risk that has been necessary for avoiding health and other hazards across human evolutionary his-tory [8]. These emotions can influence behavior directly, motivating us to engage in pleasant, rewarding behaviors and avoid unpleasant, potentially dangerous activities [8]. Affect also acts as an important source of information, informing us whether the water is safe to drink or it’s okay to enter a dark alley (via an Affect Heuristic). In other words, affective responses can serve as simple cues or heuristics enabling people to skirt hazards quickly and efficiently [8,9]. These are important ways that graphic warning labels may assist smokers, most of whom want to quit and/or wish they had never started smoking [10].
Affect, thus, serves multiple functions in risk perception and decision processes [11,12]. This line of research also points towards affect influencing perceptions of health risks by moti-vating people to think more carefully about the risks [11]. Peters [12], for example, proposed
that affect plays a role as a spotlight in a two-step process. First, enhanced affective feelings (e.g., those aroused by graphic warnings in the present study) encourage the decision maker to focus on new information consistent with those feelings (in this case, the risk information). Second, the new information (rather than the initial feelings) is used to guide further judg-ments and decisions. Thus, we expect affect-laden graphic warnings to highlight health-risk information, promote greater processing and acceptance of it, and, in turn, increase smoking risk perceptions and quit considerations. Consistent with this, graphic warnings have been shown to elicit increased evaluations of warning credibility that may encourage quitting [13]. Such cognitions are important because evaluations formed from carefully thinking about infor-mation last even longer [14] and are even more predictive of behavior [14,15,16]. Understand-ing the processes through which affect influences risk perceptions and quit intentions among smokers represents the primary objective of the current research.
We further predicted that smokers given graphic warnings would remember more health information from them than those given text-only warnings. Graphic images contain more detailed information than is available in brief textual warnings. For example, showing an image of advanced oral cancer on the lip of a person who also has diseased teeth and gums says more to the smoker than simply saying“cigarettes cause cancer.”In addition, our hypothesis has a basis in past research showing that affective arousal increases memory for associated informa-tion [17,18,19]. Consistent with both lines of thought, survey research shows that smokers in countries with graphic warning labels can identify more smoking risks than smokers in coun-tries with text-only warnings [20,21]. Improving our understanding of how graphic warning labels influence smokers’risk knowledge represents an important secondary objective of this trial.
In addition to images, another label component that can influence the perceived credibility of warnings is the addition of text that elaborates on the risk information in the warnings. Emery et al. [13] found that elaborated risk information (similar to that used in Canada) increased perceived warning credibility, which decreased smoking desires. Because smokers do not appreciate the cumulative risks associated with smoking [22], we designed elaborative text that emphasized the additional risk that each cigarette posed to the smoker. Whether messages emphasizing cumulative risks would be compelling to regular smokers (and especially smokers not intending to quit) was not clear. We anticipated that, consistent with past research showing the superiority of elaborated text [13], such messages would enhance warning credibility, an effect that would indirectly influence risk perceptions and quit intentions.
A recent meta-analysis of 37 laboratory-based experimental studies concluded that one-time exposure to graphic vs. text-only warning labels leads to heightened quit intentions among smokers [23]. However, a naturalistic experiment is a key addition to this literature because, compared to single-exposure studies, the experience of a pack-a-day smoker is likely much different, with 600 potential exposures to graphic warnings on cigarette packs per month. It seems unlikely that the first label response would be the same as the 599th. In particu-lar, the effects of graphic images on negative affect towards smoking may be short-lived as smokers could avoid the warnings or habituate to them over time [24,25]. If true, graphic warnings will lose efficacy over time. However, we anticipated that their emotional impact would change smokers’feelings about their habit and motivate greater processing of risk infor-mation [11], leaving the smoker with enhanced knowledge and heightened risk perceptions even after the immediate emotions waned. The present study, to our knowledge, is the first to randomly assign smokers to receive graphic vs. text-only warnings on their cigarette packs over a relatively long duration (four weeks).
We compared three conditions: text-only using the nine Congressionally-mandated messages; mandated text plus FDA-proposed images [26]; and elaborated text combined with the man-dated messages and proposed images. Consistent with past research [6,13,27], we tested our hypotheses using mediated models with affect, risk scrutiny, perceived credibility, and label memory as mediators of warning label effects on risk perception, quit intentions, and risk knowledge. We tested the following hypotheses:
Hypothesis 1a (H1a): Graphic warning labels will cause greater negative affect toward smok-ing among adult smokers, an effect that will indirectly motivate action by increassmok-ing quit inten-tions and serve as information about the dangers of smoking by increasing risk percepinten-tions.
Hypothesis 1b (H1b): The negative affect created by graphic images will enhance the credi-bility of the warnings by increasing scrutiny of the warning information, an effect that will indi-rectly increase risk perceptions and quit intentions.
Hypothesis 2 (H2): Elaborative text will increase the credibility of the warning message, an effect that will also indirectly increase risk perceptions and quit intentions.
Hypothesis 3 (H3). Graphic warning labels will enhance recall of warning information, an effect that will be explained in part by negative affect elicited by the graphic labels. This greater label memory will indirectly increase participants’knowledge of smoking risks at the end of the trial and at post-trial follow-up.
Materials and Methods
The protocol for this trial and CONSORT checklist are available as supplemental information; seeS1 ProtocolandS1 Checklist. The trial was registered at Clinicaltrials.gov with the reference
NCT01782053.
Ethics statement
This study was conducted in accordance with the ethical standards laid down in the 1964 Dec-laration of Helsinki. The investigation was approved by the University of Pennsylvania Institu-tional Review Board (IRB), which served as the IRB of record for this trial. Prior to
participation, all participants provided written consent by signing an IRB approved document indicating that they understood the trial protocol and agreed to participate. In addition to receiving cigarettes in experimental packaging at no cost, participants were paid up to $235 for completing the full trial and adhering to all elements of the protocol. No adverse events occurred during the trial.
Participants and procedure
Sample size was determined by power analysis using GPower [28], seeS1 Protocol. Our
pri-mary outcome of interest in this trial was quit intentions. Based on past experimental investiga-tions exploring the impact of graphic warning labels on quit inteninvestiga-tions [6], we predicted an effect size of .35. Sample size estimates were calculated for 80% power and a two-tailed alpha of .05. After collapsing from 5 to 3 conditions as described below, we estimated that we would need 260 participants to identify a direct effect of graphic vs text-only warnings condition on quit intentions using unadjusted analysis of variance (ANOVA).
Study participants were 293 adult smokers (MAge= 33.68,SD= 11.56, 45% female) recruited
were currently being treated for a psychiatric condition or who reported a history of substance abuse. Complete inclusion and exclusion criteria can be found inS1 Protocol. Most partici-pants identified themselves as being White (62%), 31% as Black, and 5% as more than one race. Remaining participants identified as American Indian (n= 3), Asian (n= 2) or“other”(n= 1). Participants reported smoking an average of 16.99 (SD= 7.87) cigarettes per day, and they reported having been a smoker for 17.14 (SD= 12.04) years. Nicotine dependence was assessed by the Fagerström Test of Nicotine Dependence [29]. The mean score was 4.37 (SD= 1.78) indicating moderate dependence, which was biochemically supported by breath carbon mon-oxide (CO) sample at intake (M= 17.93 ppm,SD= 10.63)[29].
Participants were stratified on the basis of gender, amount smoked, and quit intentions, then randomly assigned to conditions by research assistants. The randomization scheme was gener-ated by an individual who did not interact with participants. The protocol was open label; thus no attempts at blinding were made for experimenters or participants. No differences existed between conditions on demographic characteristics or baseline smoking behaviors at randomiza-tion (seeS1 Table). Depending on their assigned experimental condition, participants received their own brand of cigarettes with packages modified by text-only warning labels, graphic warn-ing labels, or graphic warnwarn-ing labels that included elaborated text. Early participants (n = 117) were randomized to one of 5 conditions at a 1:1:1:1:1 ratio. The presence vs. absence of a quitline number was manipulated in conditions with images. No participant ever called the quitline. Thus, the quitline number was dropped and participants who had been exposed the quitline number were analyzed as members of the parent condition (graphic or elaborated). This change in the protocol, which was approved by the funding agencies, enabled us to recalculate the power analysis and recruit fewer participants (seeS1 Protocol). For the remainder of the study, partici-pants were randomly assigned to one of the three experimental conditions. The randomization scheme was adjusted to increase the likelihood that later participants would be included in the text-only condition, resulting in a 1:1:1 ratio across conditions for the study.
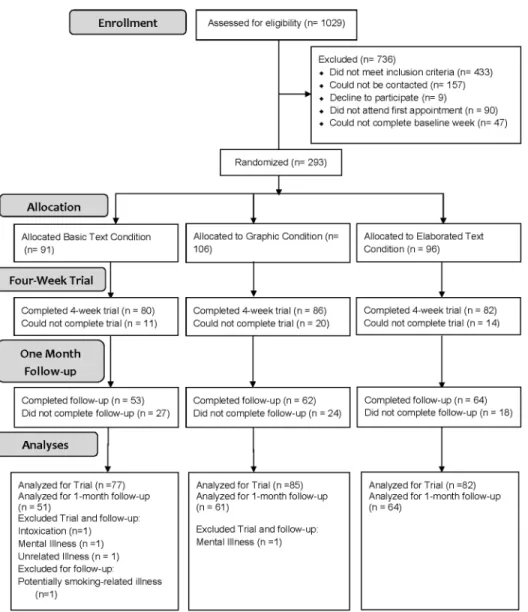
Participants returned to the lab each week to receive additional cigarettes and respond to surveys about their experiences with the new packaging. Participants returned any unused cig-arettes from the prior week at each appointment. To reduce possible demand characteristics from exposure to cigarette packages, they completed all dependent measures at a private com-puter work station with no cigarette packages within sight. At the same time, a research assis-tant prepared cigarettes for the next week in an adjoining room. Retention was high at the end of the trial (84.6%). At that time, participants completed key dependent measures on a com-puter. About one month later, experimenters were able to contact most participants (60.8%) by phone for a voluntary follow-up survey,Fig 1. Further details of the experimental protocol can be found inS1 Protocol.
Independent variable
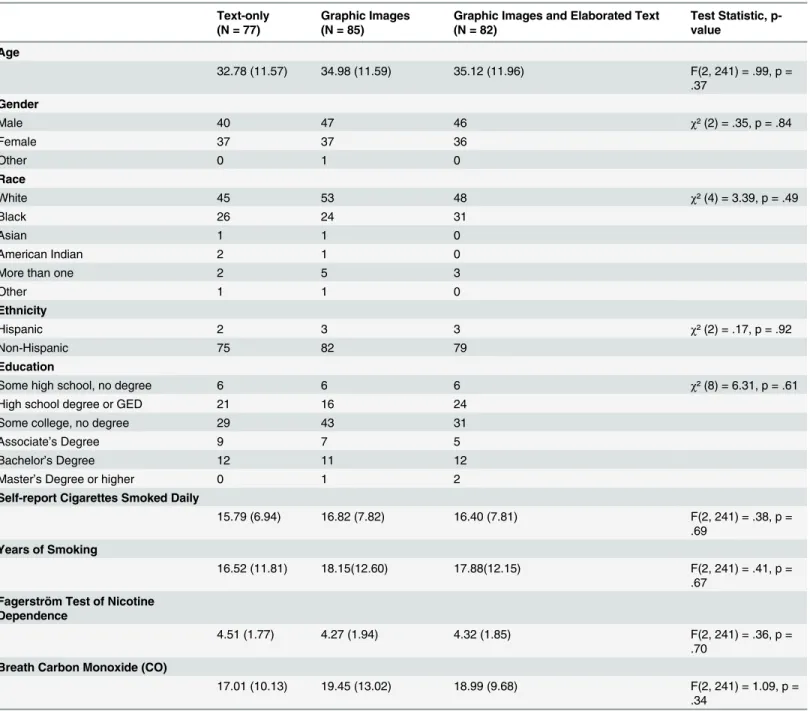
Fig 2for examples in all three conditions; for full materials seeS1–S3Figs). Participants in the graphic image condition received the same basic text plus related images; these warnings cov-ered approximately 50% of the front and back of each pack (placed so as not to cover brand information). These graphic labels featured the nine images proposed by FDA for inclusion on US cigarette packs [26]. Participants in the elaborated text condition received packs with warn-ings covering the same package space; these labels included the same text and images plus addi-tional text describing how every cigarette entails risk (e.g.,“Every cigarette you smoke increases your risk of crippling, often fatal, lung diseases such as emphysema.”). Participants were exposed to each label in their condition in approximately equal proportions over the experi-mental period.
Dependent measures
Smoking behavior. To monitor smoking behavior over the course of the trial, participants were required to return their used cigarette filters to the lab each week [30]. Participants were Fig 1. Participant Retention Diagram.Participant recruitment and retention over the course of the trial.
provided with a resealable plastic pouch for each day between laboratory sessions. Returned fil-ters were counted to measure smoking behavior. To estimate smoking behavior before packag-ing was manipulated, the number of filters returned each day durpackag-ing the baseline period was averaged. To estimate smoking behavior during the trial, the number of filters returned each day during the modified warning labels period was averaged.
Negative affect. During their third lab visit, after using cigarettes in modified packaging for one week, participants were asked to indicate the extent to which the cigarette packaging affected their feelings about smoking (“Did the packaging change how you feel about smok-ing?”1 = the packaging made me feel much worse about smoking; 4 = the packaging had no effect; 7 = the packaging made me feel much better about smoking). This item was adapted from past research [7] and reverse coded, so that higher scores indicated more negative affect.
Risk scrutiny. Scrutiny of risk information was also assessed during the third lab visit using a measure adapted from past research on warning label scrutiny [31]. Participants were asked“In the past week, have you read or looked closely at the information on your cigarette packs?”and answered on a 5-point scale (1 =not at allto 5 =extremely often).
Warning credibility. Perceptions of warning credibility were assessed after four weeks of exposure to the experimental warning labels, during the sixth and final lab visit. After complet-ing all other dependent measures, participants viewed each warncomplet-ing label that had been on their cigarette packages during the study and responded to“Do you believe that what this information says is true?”(1 =not at allto 7 =completely). This measure was adapted from past research on perceptions of cigarette warning label credibility [13] and used to construct an index of perceived warning credibility by averaging ratings across labels (Cronbach’sα= .92).
Fig 2. Placement of Experimental Warning Labels.Basic text warnings (left) were placed on the side of cigarettes packages. Graphic warning labels (center) covered approximately 50% of the front of cigarette packages and paired images with basic text statements. Elaborated text warning labels (right) also featured graphic images, but included descriptive text which explained the warning in more detail.
Risk perceptions. Subjective perceptions of smoking illness risk were assessed on three 7-point scales adapted from past research on smoking risk perceptions [32,33] during the final lab visit. Comparative risk perceptions were assessed with“Compared to the average person your age, gender, and race, how would you rate your chances of getting a life-threatening illness because of smoking?”(1 =much lowerto 7 =much higher). Absolute risk perceptions were assessed with two items:“If I continue to smoke, I think my chances of getting a life-threaten-ing illness are”(1 =almost zero to 7 = almost certain) and“If I continue to smoke, I would feel very vulnerable to dying at a younger age than I would otherwise”(1 =strongly disagree to7 = strongly agree).
Quit intentions. During their final lab visit, participants responded to three items relevant to quit intentions. These items included a contemplation ladder [34], which asked them to choose the number that indicates their current thinking about smoking on a 9-point scale (1 = taking action to quit [e.g., cutting down, enrolling in a program]; 3 = starting to think about how to change my smoking patterns; 5 = think I should quit but not quite ready; 7 = think I need to consider quitting someday; and 9 = no thought of quitting). This item was reverse-scored. Participants also responded to two 4-point scale items adapted from past research [35], which asked“How likely do you think it is that you will try to quit smoking within the next 30 days?”(1 =very unlikelyto 4 =very likely) and“How much do you want to quit smoking?”(1 =not at allto 4 =a lot).
Label memory. Consistent with procedures used in past research to investigate memory for emotional events, participants were asked to recall the warning labels during their final lab-oratory session in the trial [6,36]. An open-ended item asked“Please think about the packag-ing of the cigarettes we have given you over the past few weeks. Please try to recall what the information on the packages stated and write it in below.”Participants were given nine text boxes and no time limits to list as much information as they could recall. Four independent coders evaluated responses for evidence of the presence of memory for the components of each label (basic text/images/ elaborated text). Although lung cancer and throat cancer were not mentioned explicitly on the warning labels, participants often inferred these illnesses from information on the labels. Thus, any mention of lung or throat cancer was included as memory for label content, but was not classified as memory for any specific label element. This resulted in a total possible score of 29. Inter-rater reliability was established for memory of each label component (mean Krippendorff’sα= .95) and the number of components recalled
(Krippen-dorff’sα= .96).
Smoking risk knowledge. Participants’knowledge of smoking-related illnesses also was measured through a free response task at the end of the trial. Some researchers believe that free response measures are better indicators of smoking risk knowledge than responses to closed ended questions [37]. Participants responded to the item“What are some diseases you’ve heard about that can be related to tobacco use?”Participants were given a large text box in which to enter as many diseases as they could think of. Two independent coders examined these responses and coded for any mention of 29 different smoking-related health risks. Responses were coded for widely known smoking-related illnesses (e.g., lung cancer; heart dis-ease) and less widely known risks (e.g., breast cancer; joint problems). Inter-rater reliability was high (Krippendorff’sα= 1.00). Risk knowledge was calculated by summing the number of
smoking-related illnesses mentioned (possible range = 0–29).
Analysis Strategy. Prior to our primary analyses, one-way analysis of variance (ANOVA) and chi-square (χ2) tests were used to investigate the possibility that participant demographic
characteristics or baseline smoking behaviors might differ as a function of experimental condi-tion at randomizacondi-tion and in the data we analyzed. We also used unadjusted one-way ANO-VAs to investigate the possibility that participant exposure to the warning information might have differed as a function of experimental condition and that warning label exposure may have had direct effects on key outcome variables.
Consistent with an intention to treat analysis strategy, available data for participants who completed the trial were analyzed as if they had complied with the intervention condition to which they were randomly assigned, regardless of compliance with the experimental protocol. All analyses were conducted after the end of the trial and follow-up data collection. To test hypotheses about the indirect (mediated) effects of exposure to graphic warning labels, we used structural equation modeling (SEM). Analyses were conducted using MPlus Version 7 [38]. We created two orthogonal contrast-coded predictors to represent the effects of the two warn-ing conditions. One predictor contrasted the two graphic conditions (coded as 1) versus text-only warnings (coded as -2). The other contrasted the elaborated text condition (coded as 1) versus the graphic-only condition (coded as -1), with the text-only condition coded as 0. We used these contrast codes to fit models based on our theoretically derived predictions about the indirect effects of graphic warning labels on risk perceptions, quit intentions, and smoking risk knowledge. In the structural equation models, a pairwise present approach was taken to han-dling missing data for participants who completed the trial. This approach uses all available data about variable relationships in estimating model parameters.
To assess the possibility that non-normal distribution could influence results, all analyses were first conducted using maximum likelihood estimation with robust standard errors, an approach to structural equation modeling that is robust to non-normally distributed data [39]. Modification indices were used to identify plausible paths not predicted by our theoretical framework. Satorra-Bentler scaledχ2comparison tests were computed to compare nested
models [40]. Models which evidenced acceptable fit were recalculated using bootstrap resam-pling. We used several different indices to determine the fit of each structural equation model including the normedχ2and the relativeχ2[41]. A non-significantχ2and a relativeχ2of less
than 2 indicate good model fit [41]. We also report the root mean squared error of approxima-tion (RMSEA). RMSEA values below .05 are considered to indicate that the model fits the data well [42]. Finally, we report the Comparative Fit Index (CFI), and the Tucker-Lewis Index (TLI). CFI and TLI values above .95 are considered indicators of good model fit [42]. For the purpose of comparing non-nested models, we also report the Akaike information criterion (AIC) and Bayesian information criterion (BIC). The significance of indirect (mediated) effects was assessed by using bootstrap re-sampling procedures, which used 5,000 random samples drawn from the existing data with replacement to generate bias-corrected confidence intervals for each indirect effect [43]. Confidence intervals which do not contain zero indicate a signifi-cant indirect effect. Bootstrap resampling is well suited to estimating indirect effects in multiple mediator models because confidence intervals are based on the sampling distribution of the indirect effect rather than an assumed normal sampling distribution [44,45].
To address the possibility that differential attrition based on demographic characteristics or smoking behavior might bias our results, we used logistic regressions andχ2tests to compare
Stata version 12 [46]. Structural equation models were then calculated from the imputed data sets using the MPlus multiple imputation analysis procedures.
Finally, to further assess the validity of our theoretically derived model described in hypoth-eses 1 and 2, we also tested the fit of the data to two plausible alternative models and report their fit statistics. We compared the fit of the data to these models to the fit of the data in our hypothesized model using the AIC and BIC.
Results
In our primary analyses, participants who did not complete the week six appointment were excluded from analyses (n = 45). Retention did not differ as a function of experimental condi-tion. Four additional participants were excluded from analyses (two were hospitalized for men-tal illness during the trial, one was diagnosed with a possible smoking-related illness during the trial, and one reported intoxication during lab sessions), leaving 244 participants at week 6. Follow-up data were excluded for one additional participant who was diagnosed with a possible smoking related illness after completing the trial. Demographics did not differ by experimental condition at random assignment (seeS1 Table) or at the end of the trial,Table 1. Additionally, previous research does not identify demographic differences as moderators of the impact of graphic warnings labels [47]. Therefore, reported one-way ANOVAs do not control for demo-graphic variables. All reported structural equation models controlled for the demodemo-graphic vari-ables used in stratified randomization. Specifically, all reported structural equation models control for gender (female vs. male), baseline smoking heaviness (less vs. more than 20 ciga-rettes per day), and baseline quit intentions (1“very unlikely”vs.2–4“very likely”).
Participant smoking behavior did not differ significantly by experimental condition during the baseline period,F(2, 241) = .62,p= .538, or during the trial period,F(2, 241) = .79,p= .454,
Table 2. On average, participants were exposed to the warning labels over 15.7 times per day across conditions during the trial. A paired samples t-test comparing the rates of smoking at baseline and during the trial revealed a trend indicative of a slight increase in smoking behavior after the baseline periodt(243) = 1.86,p= .064, which may be the result of participants accli-mating to receiving experimental cigarettes at no cost.
Due to a computer error, 30-day quit intentions were not recorded for 22 participants who completed the trial. Because 30-day quit intentions were also measured at week 5 and the week 5 and week 6 responses were highly correlated (r= .76,p<.001), we carried forward week 5 quit intention responses to week 6 for participants missing this item only. Model fit, path coef-ficients, and indirect effects were comparable when these participants were excluded list-wise.
One-way ANOVAs revealed that the graphic warning conditions (compared to text-only) increased negative affect toward smoking, scrutiny of the risks, and label memory. The graphic-only condition increased warning credibility relative to the other two conditions. There were no significant differences between conditions in risk perceptions, quit intentions, or risk knowledge,Table 3.
Hypotheses 1 and 2
We proposed that graphic warning labels would influence risk perceptions, and quit intentions in turn, through multiple affective paths. To ensure that risk perceptions and quit intentions were sufficiently distinct constructs, we compared measurement models with one vs. two fac-tors. The single factor model did not fit the data well, as evidenced by a highly significantχ2(χ2
[9] = 90.50,p<.001), high RMSEA (.193), and low CFI (.861) and TLI (.769) values. A two-factor model offered a better fit, (χ2[8] = 11.93,p= .155; RMSEA = .045, CFI = .99; TLI = .99).
than the one-factor model (χ2Diff= 78.57,p<.001). Thus, a two factor measurement model
was appropriate for tests of Hypotheses 1 and 2. We predicted that the presence of graphic images would increase negative affect toward smoking, which would increase risk perceptions and quit intentions directly and indirectly by encouraging smokers to think about and form favorable evaluations of the risk information warnings provided. A model testing these Table 1. Demographics of included participants by experimental condition at week 6.
Text-only (N = 77)
Graphic Images (N = 85)
Graphic Images and Elaborated Text (N = 82)
Test Statistic, p-value
Age
32.78 (11.57) 34.98 (11.59) 35.12 (11.96) F(2, 241) = .99, p =
.37 Gender
Male 40 47 46 χ² (2) = .35, p = .84
Female 37 37 36
Other 0 1 0
Race
White 45 53 48 χ² (4) = 3.39, p = .49
Black 26 24 31
Asian 1 1 0
American Indian 2 1 0
More than one 2 5 3
Other 1 1 0
Ethnicity
Hispanic 2 3 3 χ² (2) = .17, p = .92
Non-Hispanic 75 82 79
Education
Some high school, no degree 6 6 6 χ² (8) = 6.31, p = .61
High school degree or GED 21 16 24
Some college, no degree 29 43 31
Associate’s Degree 9 7 5
Bachelor’s Degree 12 11 12
Master’s Degree or higher 0 1 2
Self-report Cigarettes Smoked Daily
15.79 (6.94) 16.82 (7.82) 16.40 (7.81) F(2, 241) = .38, p =
.69 Years of Smoking
16.52 (11.81) 18.15(12.60) 17.88(12.15) F(2, 241) = .41, p =
.67 Fagerström Test of Nicotine
Dependence
4.51 (1.77) 4.27 (1.94) 4.32 (1.85) F(2, 241) = .36, p =
.70 Breath Carbon Monoxide (CO)
17.01 (10.13) 19.45 (13.02) 18.99 (9.68) F(2, 241) = 1.09, p =
.34
Due to a low number of participants in certain groups, some categories were combined inχ2tests for demographic differences after random assignment.
The participant who indicated their gender as“other”was excluded from theχ2test for gender. Participants who indicated their race as Asian, American
Indian, More than one race, or Other, were combined to form a single“other”category. Finally, participants with a Master’s degree or higher were combined with participants who held a Bachelor’s degree to form a single high-education category.
predictions using maximum likelihood estimation with robust standard errors fit the data well (χ2[59] = 65.59,p= .259, relativeχ2= 1.11, RMSEA = .02 [CI 90: .00 to .05], CFI = .99, TLI =
.99). However, modification indices suggested that including a path from negative affect to per-ceived credibility would improve model fit. A model with this path was estimated using maxi-mum likelihood estimation with robust standard errors and also fit the data well (χ2[58] =
61.52,p= .351, relativeχ2= 1.06, RMSEA = .02 [CI 90: .00 to .04], CFI = 1.00, TLI = .99). A
Satorra-Bentler scaledχ2difference test revealed that the alternative model provided a
margin-ally better fit to the data than the hypothesized model,χ2[1] = 3.70,p= .056). Therefore, this
path was retained in our final model, which was retested using bootstrap resampling to calcu-late confidence intervals for indirect effects. Modification indices did not suggest any additional paths to be added or removed from the model.
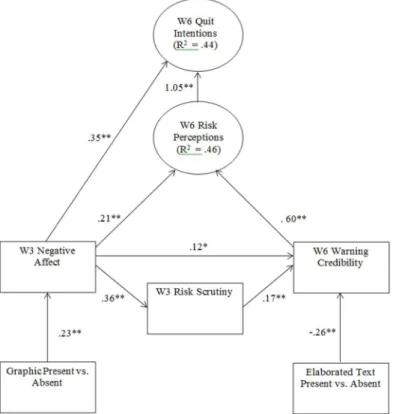
The final model testing Hypotheses 1 and 2 is depicted inFig 3. The recalculated model with bootstrap resampling also fit the data well, as evidenced by a non-significantχ2(χ2[58] =
62.94,p= .306), a relativeχ2of less than 2 (1.09), a low RMSEA (.02, CI 90: .00, .05), and high
CFI and TLI values (.99 and .99). The similarity of these results to the results of the same Table 2. Average smoking behavior by experimental condition at baseline and during the trial.
Text-only Graphic Images Graphic Images and Elaborated Text Omnibus Effect Size
Mean(SD) Mean(SD) Mean(SD) ηp
2
Filters returned during baseline 14.76 (6.41) 16.01 (7.22) 15.42 (7.63) .01
[CI 95] [13.95, 15.56] [15.1, 16.91] [14.46, 16.38]
Filters returned during the trial 14.85 (6.93) 16.29 (7.55) 15.95 (8.11) .01
[CI 95] [13.97, 15.72] [15.34, 17.24] [14.93, 16.97]
doi:10.1371/journal.pone.0142879.t002
Table 3. Unadjusted mean outcome responses by experimental condition among participants who completed the trial.
Text-only Graphic Images Graphic Images and Elaborated Text Omnibus Effect Size
Mean(SD) Mean(SD) Mean(SD) ηp2
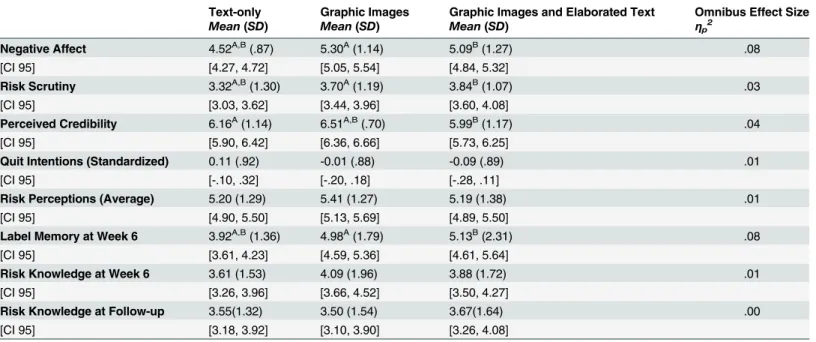
Negative Affect 4.52A,B(.87) 5.30A(1.14) 5.09B(1.27) .08
[CI 95] [4.27, 4.72] [5.05, 5.54] [4.84, 5.32]
Risk Scrutiny 3.32A,B(1.30) 3.70A(1.19) 3.84B(1.07) .03
[CI 95] [3.03, 3.62] [3.44, 3.96] [3.60, 4.08]
Perceived Credibility 6.16A(1.14) 6.51A,B(.70) 5.99B(1.17) .04
[CI 95] [5.90, 6.42] [6.36, 6.66] [5.73, 6.25]
Quit Intentions (Standardized) 0.11 (.92) -0.01 (.88) -0.09 (.89) .01
[CI 95] [-.10, .32] [-.20, .18] [-.28, .11]
Risk Perceptions (Average) 5.20 (1.29) 5.41 (1.27) 5.19 (1.38) .01
[CI 95] [4.90, 5.50] [5.13, 5.69] [4.89, 5.50]
Label Memory at Week 6 3.92A,B(1.36) 4.98A(1.79) 5.13B(2.31) .08
[CI 95] [3.61, 4.23] [4.59, 5.36] [4.61, 5.64]
Risk Knowledge at Week 6 3.61 (1.53) 4.09 (1.96) 3.88 (1.72) .01
[CI 95] [3.26, 3.96] [3.66, 4.52] [3.50, 4.27]
Risk Knowledge at Follow-up 3.55(1.32) 3.50 (1.54) 3.67(1.64) .00
[CI 95] [3.18, 3.92] [3.10, 3.90] [3.26, 4.08]
Shared superscripts indicate that values are significantly different,p<.05. Direct effects of condition on Risk Perceptions and Quit Intentions are based on average responses to relevant measures. An index of Quit Intentions reported in this table was created by averaging standardized responses to each of the three quit intention measures (α= .88). An index of Risk Perceptions were created by averaging across the three risk perception measures (α=
.70).
model estimated with MLR suggests that non-normal variable distributions did not signifi-cantly bias the trial’s results. The AIC for this model was 8215.82 and the BIC was 8397.46. As predicted by H1a, warning labels with graphic images elicited more negative affect toward smoking than text-only warning labels at week 3 (b= .23,p<.001). Consistent with the affect heuristic, this led to heightened risk perceptions (b= .21,p<.001); negative affect also led to increased quit intentions independent of risk perceptions at week 6 (b= .35,p= .004). As pre-dicted by H1b, negative affect also led to increased risk scrutiny at week 3 (b= .36,p<.001), which then led to heightened perceptions of warning credibility at week 6 (b= .17,p= .009). There was also a direct link between negative affect and heightened perceptions of warning credibility at week 6 (b= .12,p= .033). As predicted by H1b, warning credibility was a signifi-cant predictor of risk perceptions at week 6 (b= .60,p<.001). Finally, heightened risk percep-tions predicted increased week 6 quit intenpercep-tions (b= 1.05,p<.001). Contrary to H2, graphic warning labels with elaborated text were perceived as less credible at week 6 than graphic warn-ings with basic text only (b= -.26,p= .001).
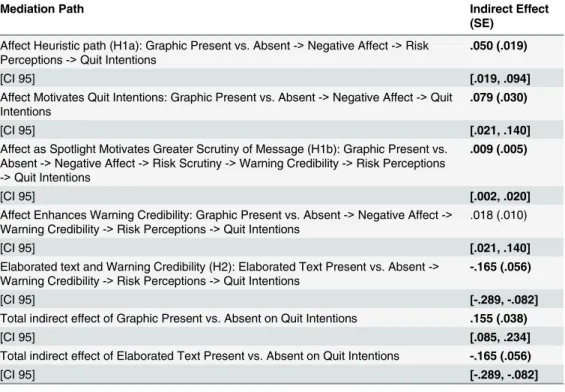
All indirect paths in the final model were statistically significant,Table 4. The positive indi-rect effect of graphic presence ->negative affect ->risk perceptions ->quit intentions is con-sistent with the negative affect aroused by the presence of graphic images acting as a cue from which people infer risk (i.e., the Affect Heuristic [8]), which in turn leads to quit intentions. The positive indirect effect of graphic presence ->negative affect ->quit intentions indicates that affect influenced quit intentions apart from risk perception. The positive indirect effects of graphic presence ->negative affect ->risk scrutiny ->warning credibility ->risk perceptions ->quit intentions and graphic presence ->negative affect ->warning credibility ->risk Fig 3. Model Testing the Predictions of Hypotheses 1 and 2.W3 = Week 3; W6 = Week 6. Path
coefficients for the measurement models for Risk Perceptions (Risk 1 = 1.00, Risk 2 = .88**, Risk 3 = 1.19**) and Quit Intentions (Contemplation Ladder = 1.00, 30-Day Quit Intentions = .45**, Quit Desire = .42**)
perceptions ->quit intentions are consistent with images which arouse negative affect motivat-ing more careful consideration of warnmotivat-ing information (i.e., affect as a spotlight [11,12]). Finally, the negative indirect effect of elaborated text presence ->perceived credibility ->risk perceptions ->quit intentions suggests that the impact of affect on risk perceptions and quit intentions only occurs when people find the warnings credible, which was not the case with the warnings that included elaborated text.
Investigating the influence of attrition
Participants who completed the trial were older (b= 2.21,p= .028) and lighter smokers (b= 3.27,p= .001) than participants who did not complete the trial. Race, ethnicity, education, and other smoking characteristics were not significant predictors of attrition (for details of these analyses, seeS2 Table). Participant age, self-reported number of cigarettes smoked daily, and all variables shown inFig 3were used to impute data for participants who were random-ized to experimental conditions but did not complete the study and for items participants who completed the study declined to answer. Covariates were not included in the imputation model because the“smoking heaviness”covariate was derived from self-reported number of cigarettes smoked daily at baseline. These full data sets (n = 289) were then used to test the model pre-sented inFig 3. Control variables were included when imputed data were fit to the hypothe-sized model. The model fit the imputed data well, as evidenced by a non-significantχ2(χ2[58]
= 61.93,p= .338), a relativeχ2of less than 2 (1.07), a low RMSEA (.02, CI 90: .00, .04), and
high CFI and TLI values (1.00 and .99). All model paths remained significant,S4 Fig. Table 4. Indirect effects of condition on risk perceptions and quit intentions.
Mediation Path Indirect Effect
(SE)
Affect Heuristic path (H1a): Graphic Present vs. Absent ->Negative Affect ->Risk
Perceptions ->Quit Intentions
.050 (.019)
[CI 95] [.019, .094]
Affect Motivates Quit Intentions: Graphic Present vs. Absent ->Negative Affect ->Quit
Intentions
.079 (.030)
[CI 95] [.021, .140]
Affect as Spotlight Motivates Greater Scrutiny of Message (H1b): Graphic Present vs. Absent ->Negative Affect ->Risk Scrutiny ->Warning Credibility ->Risk Perceptions
->Quit Intentions
.009 (.005)
[CI 95] [.002, .020]
Affect Enhances Warning Credibility: Graphic Present vs. Absent ->Negative Affect ->
Warning Credibility ->Risk Perceptions ->Quit Intentions
.018 (.010)
[CI 95] [.021, .140]
Elaborated text and Warning Credibility (H2): Elaborated Text Present vs. Absent ->
Warning Credibility ->Risk Perceptions ->Quit Intentions
-.165 (.056)
[CI 95] [-.289, -.082]
Total indirect effect of Graphic Present vs. Absent on Quit Intentions .155 (.038)
[CI 95] [.085, .234]
Total indirect effect of Elaborated Text Present vs. Absent on Quit Intentions -.165 (.056)
[CI 95] [-.289, -.082]
Bold indicates a reliable indirect effect, wherep<.05.
Testing alternative models
Although our hypothesized model fit the data well, we also tested two additional models derived from the predictions of alternative theoretical frameworks. Some researchers have sug-gested that graphic warning labels are effective primarily because they are more salient than text-only warnings [43]. In this account, image salience causes smokers to scrutinize risk infor-mation, and risk scrutiny increases negative affect, risk perceptions, and quit intentions [48]. We tested an alternative model consistent with this account, which reversed the order of risk scrutiny and negative affect. The data did not fit this model as well as our final model,χ2(58) =
98.84,p<.001, relativeχ2= 1.70, RMSEA = .05 (CI 90: .04 to .07), CFI = .95, TLI = .93. The
AIC (8251.73) and BIC (8433.37) were larger for this model than our hypothesized model (AICDifference= 35.91; BICDifference= 35.91), which further suggests that the data did not fit this
model as well as it fit our hypothesized model. Path coefficients for this model are available to interested readers inS5 Fig.
Self-perception theory, derived from the psychological literature on attitude change, sug-gests that people often infer their beliefs from their decisions [49]. Within the context of graphic warnings labels, this perspective would suggest that smokers may infer their risk per-ceptions from observing their stated quit intentions. We tested an alternative model in which risk perceptions were predicted by quit intentions rather than the reverse. All paths in this alternative model were identical, except the location of the two latent constructs was reversed, such that quit intentions were predicted by negative affect and warning credibility and risk per-ceptions were predicted by negative affect and quit intentions. The data did not fit this model as well as our final model,χ2(58) = 104.49,p<.001, relativeχ2= 1.80, RMSEA = .06 (CI 90:
.04 to .08), CFI = .94, TLI = .92. The AIC (8257.38) and BIC (8439.02) were larger for this model than our hypothesized model (AICDifference= 41.56; BICDifference= 41.56), which further
suggests that the data did not fit this model as well as it fit our hypothesized model. Path coeffi-cients for this model are available to interested readers inS6 Fig.
After examining two plausible alternative models derived from past research, we concluded that the model which tested Hypotheses 1 and 2 fit the data comparatively better. This suggest that the present paper’s theoretical conception of how graphic warning labels influence smokers’
risk perceptions and quit intentions provides a better account of the data in this randomized clin-ical trial than the alternative theories. Further, these analyses suggest that the temporal relation-ships we hypothesized provide a better explanation for the data than alternative relationrelation-ships.
Hypothesis 3
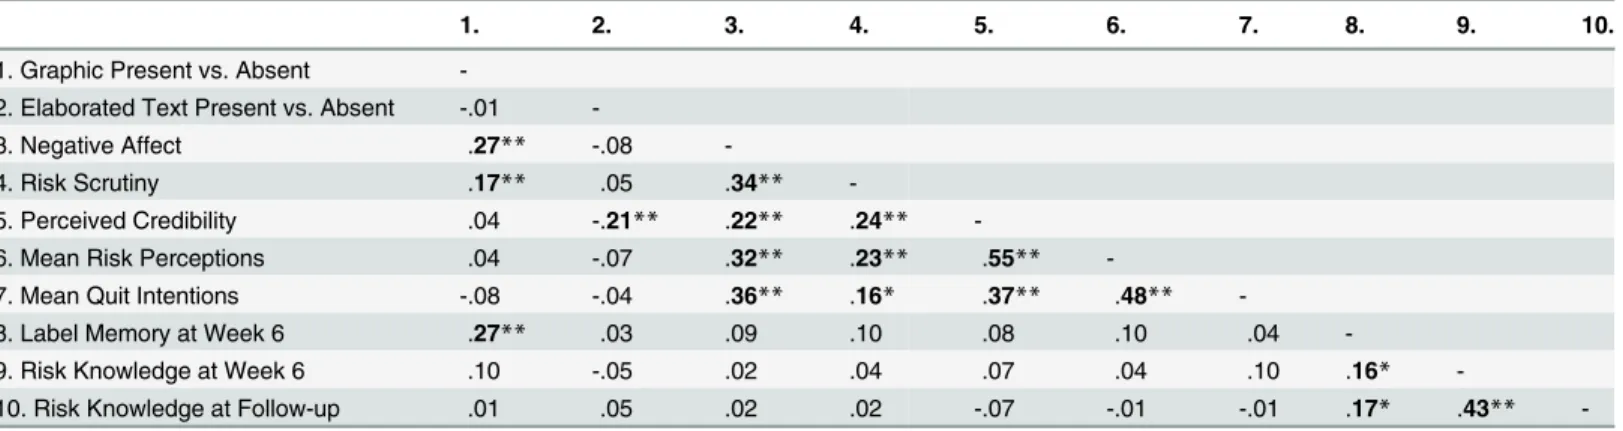
We proposed that graphic warning labels would be more memorable than text-only warnings (due to the increased negative affect towards smoking or to the presence of more detailed risk information), and that this increased memory for warning information would lead to greater smoking risk knowledge. Existing literature suggests that increased memory for warning infor-mation could be driven by the negative affect aroused by images. However, in the current research, negative affect was not correlated with label memory or risk knowledge,Table 5, pre-cluding the possibility that negative affect mediates the impact of graphic images on memory. The second contrast comparing the presence of elaborated text (1) to the other two warning conditions (-1) was also uncorrelated with memory for warning information (seeTable 5). Thus, we used the contrast of the two graphic conditions (coded as 1) with the text-only warn-ings (coded as -2) to investigate the impact of images on label memory on risk knowledge immediately after completing the trial and at follow-up.
provided an adequate fit to the data as evidenced by a non-significantχ2(1) = 1.525,p= .217, a
relativeχ2<2 (1.525), a low RMSEA (.047, CI 90: .000, .185), and high a CFI (.98). Unexpect-edly, the TLI value was below the threshold for good model fit (TLI = .85). Fit statistics were similar when this model was rerun using bootstrapping (χ2[1] = 1.389,p= .239, relativeχ2=
1.389, RMSEA = .04 [CI 90: .00 to .18], CFI = .99, TLI = .88), suggesting that non-normal vari-able distributions did not significantly bias results. Image presence led to increased label mem-ory at week 6 (b= .37,p<.001), and label memory led to increased smoking risk knowledge immediately after participants had completed the trial (b= .14,p= .010). Bootstrapping analy-sis revealed that this indirect effect was significant (Estimated Indirect Effect = .05 [SE = .02], CI 95: .010, .097). The model explained 7.1% of differences in risk knowledge at week 6 (R2= .071)
The model which examined graphic image presence ->label memory ->smoking risk knowledge at follow up (for the 169 participants who completed the follow-up) also fit the data acceptably when estimated using maximum likelihood with robust standard errors,χ2(1) = .07,
p= .787,χ2relative= .07, RMSEA = .00 (CI 90 .00 to .11), CFI = 1.00, TLI = 1.38). Model fit was
similar when this model was rerun using bootstrapping,χ2(1) = .06,p= .805, relativeχ2= .06,
RMSEA = .00 (CI 90: .00 to .11), CFI = 1.00, TLI = 1.41, suggesting that non-normal variable distributions did not significantly bias results. For this subgroup, image presence predicted label memory at week 6 (b= .37,p<.001), and label memory predicted smoking risk knowl-edge at follow up (b= .14,p= .025). This indirect effect was significant (Estimated Indirect Effect = .05 [SE = .02], CI 95: .008, .103). The model explained 6.6% of differences in risk knowledge at follow-up (R2= .066).
Investigating the influence of attrition. To investigate the possibility that differences in attrition might account for the effects of label memory on smoking risk knowledge, we imputed memory data for participants who did not complete the trial or declined to respond to these items. Participant age and self-reported number of cigarettes smoked daily (both significantly associated with attrition), experimental condition, and available label memory and risk knowl-edge data were used to create 10 complete data sets. These full data sets (n = 289) were then used to retest the models for hypothesis 3. Theχ2, relativeχ2, and RMSEA suggest that the
imputed data sets also provided a good fit to our model predicting smoking risk knowledge at Table 5. Correlations among key measures.
1. 2. 3. 4. 5. 6. 7. 8. 9. 10.
1. Graphic Present vs. Absent
-2. Elaborated Text Present vs. Absent -.01
-3. Negative Affect .27** -.08
-4. Risk Scrutiny .17** .05 .34**
-5. Perceived Credibility .04 -.21** .22** .24**
-6. Mean Risk Perceptions .04 -.07 .32** .23** .55**
-7. Mean Quit Intentions -.08 -.04 .36** .16* .37** .48**
-8. Label Memory at Week 6 .27** .03 .09 .10 .08 .10 .04
-9. Risk Knowledge at Week 6 .10 -.05 .02 .04 .07 .04 .10 .16*
-10. Risk Knowledge at Follow-up .01 .05 .02 .02 -.07 -.01 -.01 .17* .43**
-*p<.05.
**p<.01.
Mean Quit Intentions include scores with week 5 values carried forward for the 22 data points where week 6 quit intentions were not recorded due to computer error.
week 6 (χ2[7] = 12.04,p= .099, relativeχ2= 1.72, RMSEA = .05 [CI 90: .00 to .10]).
Unexpect-edly, the CFI and TLI did not, CFI = .80, TLI = .75). All fit statistics suggest that the full data sets provided a good fit to our model predicting smoking risk knowledge at follow-up (χ2[7] =
6.53,p= .479, RMSEA = .00 [CI 90: .00 to .07], CFI = 1.00, TLI = 1.04). Path coefficients for these imputed models were similar in magnitude to the values in models that only included participants who completed the assessments,S7 Fig. Thus, these tests suggest that attrition does not account for the impact of graphic warnings on smoking risk knowledge.
Discussion
The current research represents the first experimental investigation in a naturalistic setting of the psychological processes by which graphic warning labels influence smokers’affect and cog-nitions regarding their habit. As such, it represents the best to-date approximation of real world impact of graphic warning labels. In the study, graphic warning labels (compared to text-only) increased negative affect toward smoking, elicited greater scrutiny of the warning message, and enhanced label memory. The graphic-only condition also increased the credibil-ity of the warning message. In analyses of mediated effects on perceived risks of smoking and intentions to quit, we found support for H1a and H1b that multiple functions of affect influ-enced these outcomes [11,12]. Warnings with graphics did, in fact, elicit more negative affect than text-only warnings, and, consistent with past research on the affect heuristic [8], more negative affect increased risk perceptions (and quit intentions in turn). Increased negative affect also motivated greater quit intentions directly. Third, it also elicited greater scrutiny of the messages and increased perceptions of warning credibility. This result is consistent with affect acting as a spotlight and motivating greater processing of the risk information consistent with that negative affect. In addition, increased credibility perceptions led to heightened risk perceptions and quit intentions. The elaborated text condition, however, did not support H2 and, instead, reduced credibility perceptions and counteracted the images’effect on heightened risk perceptions.
Consistent with H3, the presence of graphic images also increased memory for label content, which led to greater smoking risk knowledge immediately after participants completed the trial and approximately one month later. Thus, warnings containing images also enhanced memory for label content, which helped to educate smokers about the harms of smoking. Although we predicted that negative affect from week 3 would drive increased memory for warning informa-tion at week 6 [18,19], the data were inconsistent with this prediction. Several possible reasons exist for this lack of effect: (1) negative affect may have already started to fade after a week of exposure [24,25], (2) the negative affect measure focused on feelings about smoking rather than feelings about the warnings themselves, and (3) the measure focused on valence rather than on the arousal linked with memory in past studies [18,19]. The first possibility seems unlikely given that negative affect remained strong enough to have significant associations with several other key variables. Alternatively, it may be the case that negative affect is unrelated to memory for warning information. Instead, it may be that simply having illustrations of textual material provided more detailed content that enhanced memory [50]. Given that the images used in cigarette warnings were designed to illustrate the health risks, they likely provide mem-ory cues for the warning information. Additional research is needed to determine how to maxi-mize the memorability of health risk information on warnings.
Results of the current research replicate past laboratory findings which have found that the negative affect elicited by graphic warning labels mediates their effect on quit intentions [6,13,
warnings. Importantly, results of the current research also provide evidence that images which arouse negative affect may be necessary components of impactful cigarette warning labels where impact is defined as increased risk knowledge, risk perceptions, and quit intentions (see also Wang et al. [51]). In this study, negative affect influenced risk perceptions directly, serving as a simple cue or heuristic. However, negative affect also caused people to more carefully scru-tinize smoking-risk information and led to greater perceived label credibility, risk perceptions, and quit intentions. This careful assessment of available information is inconsistent with the labels merely“. . .browbeat[ing] consumers into quitting”[3]. The impact of negative affect suggests that merely making text-only warnings more salient or including images which do not evoke negative affect may be insufficient to increase smokers’risk perceptions and quit intentions.
Although the tobacco companies assert that“Americans. . .are well aware of the health risks
of smoking”[3], providing risk information in plain text is less effective than text plus images. Even after exposure to the newly mandated text warnings, participants in this study were able to identify only 3–4 smoking-related risks on average (Table 3). The 2014 Surgeon General’s Report states that smoking harms nearly every organ in the body and identifies at least 35 dis-crete negative health outcomes caused by smoking [52]. Exposure to warning labels which included graphic images, however, led to greater label memory which was associated, in turn, with increased knowledge of smoking-related risks both at the study’s end and one month later. These findings demonstrate that graphic warning labels can be effective in increasing knowledge about smoking’s dangers, perhaps consistent with research showing the superiority of information accompanied by illustration for enhancing recall of that information [50].
The effects of our warning-label manipulations on smoking risk knowledge, risk percep-tions, and quit intentions were indirect and without a significant unmediated effect. Our trial was powered on the expectation of a larger warning label effects on quit intentions than we observed. Additionally, our final sample of 244 analyzed participants falls slightly below our recruitment goal. Nevertheless, the mediated analyses suggest that with a larger sample, experi-mental effects on quit intentions may have emerged alongside the observed direct effects on affect, label scrutiny, and label credibility. In addition, our finding of a direct effect on label memory suggests that risk knowledge may also be enhanced. It remains for future research with larger samples to demonstrate this conclusively.
Indirect-only effects like those observed in this trial are also important because they suggest the possibility of missing moderators [53]. For example, in the current research, reactance to label content is one possible missing moderator [54]. Such reactance could be the cause of the reduced credibility elicited by the elaborated text condition. Although earlier research has shown that elaborated text such as that used in Canada can enhance warning effects [13], this study’s exclusive focus (in the elaborated text condition) on the very next cigarette entailing risk may have been met with disbelief among life-long smokers who began the study with no intentions to quit. The current research suggests that either additional research is needed to identify the best content for the elaborated text, or that the positive effects of such text are lim-ited to studies with a single exposure to any one warning [13,35]. Alternatively, the smaller text size in the elaborated-text condition may have been problematic as observational research has demonstrated that warning labels with large, salient text are more impactful than those with smaller and less salient text [55].
[56]. Single exposure studies and population level research suggest that placing more disturb-ing images on graphic warndisturb-ing labels would increase their impact on intentions to change behaviors [51,56]. Thus, the use of more graphic warnings than those used in the present trial may reveal larger effects. Third, we did not have a true control condition. Participants in the text-only condition received novel warnings that were stronger than those currently featured on US cigarette packaging. In particular, text-only participants received the nine, currently unfamiliar, risk statements mandated by the Family Smoking Prevention and Tobacco Control Act, printed in black text on a white background. Current US warnings are smaller and in col-ors consistent with the rest of the package. Although we believe that the inclusion of a strong comparison condition is a merit of the current research, our results might have appeared stron-ger if we had instead compared image conditions to a“current warnings”control group.
The current research was designed to investigate how graphic warning labels might influ-ence smokers at the population level. As such, this trial lacked sufficient statistical power to effectively identify the impact of potential moderating variables. Although past experimental research suggests that the effects of graphic warnings do not vary as a function of demographic characteristics such as race/ethnicity, education, and income [47], this result may prove to be different with a period of prolonged exposure. This possibility should be explored in future research. Some additional variables which future research should consider as potential modera-tors of the effects observed here include the number of cigarettes participants’smoke daily, nic-otine dependence, duration of smoking, living with a smoker, and personal experience with smoking-related illness. Another plausible moderator is baseline quit intentions. For this study, we only recruited participants who indicated that they were either“somewhat unlikely”or
“very unlikely”to quit smoking in the next 30 days during the prescreening phone call. It is possible that graphic warnings might be more impactful for smokers planning to quit in the near future.
This study is the first experiment of which we are aware to investigate the processes by which graphic warning labels influence smokers in a naturalistic setting over an extended period of time. Our method of providing relabeled cigarettes ensured that all participants were exposed to experimental warning labels every time they smoked one of their own cigarettes. However, it is possible that providing participants with cigarettes at no cost may have under-mined interest in quitting and worked against our hypotheses (seeTable 2). Recent investiga-tions suggest that this can be avoided by requiring participants to provide cigarettes for re-labeling [57] or asking participants to apply experimental labels to their own cigarettes [58]. These techniques may reduce one source of error variance, however, while increasing others (e.g., participant lack of funds or compliance). In addition, if free cigarettes provided disincen-tive to quit, quit intentions at least should have been influenced equally across all conditions. Overall, the presence of the effects we found speaks to the efficacy of graphic warning labels. Additional investigations are needed to determine the tradeoffs of different methods by which to examine the impact of graphic warning labels in naturalistic contexts.
Supporting Information
S1 Checklist. CONSORT Checklist.
(DOC)
S1 Fig. Basic Text Warnings.Basic text warnings which were affixed to the side of all cigarette packages distributed in the study. These were the only warning labels affixed to the packages of participants in the text-only condition.
(PDF)
S2 Fig. Graphic Warning Labels.Graphic warnings labels were taken from the 2011 FDA final rule. Participants in the graphic images plus basic text condition received these image-text pairings.
(PDF)
S3 Fig. Elaborated Text Warning Labels.Graphic warning label images taken from the 2011 FDA final rule modified to include elaborated text. Participants in the graphic image plus elab-orated text condition received these warning labels.
(PDF)
S4 Fig. Model Testing the Predictions of Hypotheses 1 and 2 with Imputed Data.
W3 = Week 3; W6 = Week 6. Model fit statistics:χ2(58) = 61.93, p = .338, relativeχ2= 1.09,
RMSEA = .02 [CI90: .00, .04]; CFI = 1.00; TLI = .99). Path coefficients for the measurement models for Risk Perceptions (Risk 1 = 1.00, Risk 2 = .92, Risk 3 = 1.21) and Quit Intentions
(Contemplation Ladder = 1.00, 30-Day Quit Intentions = .45, Quit Desire = .42).
(PDF)
S5 Fig. Model Testing the Predictions of Alternative Model 1.W3 = Week 3; W6 = Week 6. Model fit statistics:χ2(58) = 98.84, p = .001, relativeχ2= 1.70, RMSEA = .05 [CI90: .04, .07];
CFI = .95; TLI = .93, AIC = 8251.73, BIC = 8433.37. Path coefficients for the measurement models for Risk Perceptions (Risk 1 = 1.00, Risk 2 = .87, Risk 3 = 1.15) and Quit Intentions
(Contemplation Ladder = 1.00, 30-Day Quit Intentions = .45, Quit Desire = .41).
(PDF)
S6 Fig. Model Testing the Predictions of Alternative Model 2.W3 = Week 3; W6 = Week 6. Model fit statistics:χ2(58) = 104.49, p<.001, relativeχ2= 1.80, RMSEA = .06 [CI90: .04, .08];
CFI = .94; TLI = .92, AIC = 8251.73, BIC = 8433.37. Path coefficients for the measurement models for Quit Intentions (Contemplation Ladder = 1.00, 30-Day Quit Intentions = .45,
Quit Desire = .42) and Risk Perceptions (Risk 1 = 1.00, Risk 2 = .86, Risk 3 = 1.16).
(PDF)
S7 Fig. Models Testing Hypothesis 3 with Imputed Data.Top: Image presence vs. absence on risk knowledge at week 6 with imputed data,χ2(7) = 12.04, p = .099, RMSEA = .05 (CI 90:
.00 to .10), CFI = .80, TLI = .75. Bottom: Image presence vs. absence on risk knowledge at 1 month with imputed data,χ2(7) = 6.53, p = .479, RMSEA = .00 (CI 90: .00 to .07), CFI = 1.00,
TLI = 1.04. (PDF)
S1 File. Analyzed Data File.
(XLS)
S1 Protocol. Complete Trial Protocol.
S1 Table. Demographics of Included Participants by Experimental Condition at Randomi-zation.
(PDF)
S2 Table. Demographic Differences Between Participants Randomized to Conditions Who Did vs. Did Not Complete the Trial.
(PDF)
Author Contributions
Conceived and designed the experiments: DR EP AS. Performed the experiments: LE KS. Ana-lyzed the data: AE. Wrote the paper: AE EP. Reviewed and commented on the scientific con-tent of the paper: AE EP AS LE KS DR.
References
1. Centers for Disease Control and Prevention (2014). Smoking & tobacco use: Fast facts. Retrieved December 12, 2014, 2014, fromhttp://www.cdc.gov/tobacco/data_statistics/fact_sheets/fast_facts/ 2. Canadian Cancer Society. Cigarette Package Health Warnings: International Status Report, Fourth
Edition, September 2014.
3. R. J. Reynolds Tobacco Co. v. Food and Drug Administration, No. 11–5332 (United States Court of Appeals for the District of Columbia, 2012).
4. R.J. Reynolds Tobacco Company, et al. v. U.S. Food and Drug Administration, Civil Case No. 11–1482 (RJL) (D.C.D.C., Nov. 7, 2011).
5. Cameron LD, Pepper JK, Brewer NT. Responses of young adults to graphic warning labels for cigarette packages. Tob Control. 2015; e14–e22. doi:10.1136/tobaccocontrol-2012-050645PMID:23624558 6. Kees J, Burton S, Andrews JC, Kozup J. Understanding how graphic pictorial warnings work on
ciga-rette packaging. Journal of Public Policy & Marketing, 2010: 29, 2 265–276.
7. Peters E, Romer D, Slovic P, Jamieson KH, Wharfield L, Mertz CK, et al. The impact and acceptability of Canadian-style cigarette warning labels among US smokers and nonsmokers. Nicotine Tob. Res. 2007; 9(4):473–481. PMID:17454702
8. Slovic P, Finucane M, Peters E, MacGregor DG. Rational actors or rational fools: Implications of the affect heuristic for behavioral economics. J Socio Econ. 2002; 31(4): 329–342.
9. Schwarz N, Clore GL. Mood, misattribution, and judgments of well-being: informative and directive functions of affective states. J Pers Soc Psychol. 1983; 45(3): 513.
10. Slovic P. (Ed.). Smoking: Risk, perception, and policy. Sage Publications. Thousand Oaks, California; 2001.
11. Peters E. The functions of affect in the construction of preferences. The construction of preference. 2006: 454–463.
12. Peters E, Lipkus I, Diefenbach MA. The Functions of Affect in Health Communications and in the Con-struction of Health Preferences. Journal of Communication. 2006; 56(s1): S140–S162.
13. Emery LF, Romer D, Sheerin KM, Jamieson KH, Peters E. Affective and cognitive mediators of the impact of cigarette warning labels. Nicotine Tob. Res. 2014; 16(3): 263–269. doi:10.1093/ntr/ntt124 PMID:23946325
14. Haugtvedt CP, Petty RE. Personality and persuasion: Need for cognition moderates the persistence and resistance of attitude changes. J Pers Soc Psychol. 1992; 63(2): 308.
15. Petty RE, Cacioppo JT, Schumann D. Central and peripheral routes to advertising effectiveness: The moderating role of involvement. J Consum Res. 1983: 135–146.
16. Sivacek J, Crano WG. Vested interest as a moderator of attitude–behavior consistency. J Pers Soc Psychol. 1982; 43(2): 210.
17. Kensinger EA. Remembering the details: Effects of emotion. Emot Rev. 2009; 1(2): 99–113. PMID: 19421427
18. Laney C, Campbell CV, Heuer F, Reisberg D. Memory for thematically arousing events. Mem Cognit. 2004; 32(7): 1149–1159. PMID:15813496
20. Kennedy RD, Spafford MM, Parkinson CM, Fong GT. Knowledge about the relationship between smok-ing and blindness in Canada, the United States, the United Ksmok-ingdom, and Australia: results from the International Tobacco Control Four-Country Project. Optometry. 2011; 82(5): 310–317. PMID: 21524603
21. Kennedy RD, Spafford MM, Behm I, Hammond D, Fong GT, Borland R. Positive impact of Australian 'blindness' tobacco warning labels: findings from the ITC four country survey. Clin Exp Optom. 2012; 95(6): 590–598. doi:10.1111/j.1444-0938.2012.00789.xPMID:22882362
22. Slovic P. Rejoinder: the perils of Viscusi's analyses of smoking risk perceptions. J Behav Decis Mak. 2000; 13(2): 273–276.
23. Noar SM, Hall MG, Francis DB, Ribisl KR, Pepper JK, Brewer NT. Pictorial cigarette pack warnings: a meta-analysis of experimental studies. Tob Control. 2015.
24. Frederick S, Loewenstein G. Hedonic adaptation. Kahneman D., Diener E., & Schwarz N. (Eds.), Well-Being: The Foundations of Hedonic Psychology. New York: Russell Sage Foundation Press. 1999; 302–329.
25. Wilson TD, Gilbert DT. Explaining away: A model of affective adaptation. Perspect Psychol Sci. 2008; 3(5): 370–386. doi:10.1111/j.1745-6924.2008.00085.xPMID:26158955
26. FDA, Required Warnings for Cigarette Packages and Advertisements, 76 Fed. Reg. 36,628 (June 22, 2011).
27. Andrews JC, Netemeyer RG, Kees J, Burton S. How Graphic Visual Health Warnings Affect Young Smokers' Thoughts of Quitting. J Mark Res. 2014; 51(2): 165–183.
28. Faul F, Erdfelder E, Lang A, Buchner A. G*Power 3: A flexible statistical power analysis program for the social, behavioral, and biomedical sciences. Behav Res Methods. 2007; 39(2):175–191. PMID: 17695343
29. Heatherton TF, Kozlowski LT, Frecker RC, Fagerström KO. The Fagerström test for nicotine depen-dence: a revision of the Fagerstrom Tolerance Questionnaire. Br J Addict. 1991; 86(9): 1119–1127. PMID:1932883
30. Strasser AA, Tang KZ, Sanborn PM, Zhou JY, Kozlowski LT. Exp Clin Psychopharmacol. 2009; 17(6): 405. doi:10.1037/a0017649PMID:19968405
31. Hammond D, Fong GT, McDonald PW, Brown KS, Cameron R. Graphic Canadian cigarette warning labels and adverse outcomes: evidence from Canadian smokers. Am J Public Health, 2004; 94(8): 1442–1445. PMID:15284057
32. Benthin A, Slovic P, Severson H. A psychometric study of adolescent risk perception. J Adolesc, 1993; 16(2): 153–168. PMID:8376640
33. Reimer RA, Gerrard M, Gibbons FX. Racial disparities in smoking knowledge among current smokers: data from the health information national trends surveys. Psychol Health, 2010; 25(8): 943–959. doi: 10.1080/08870440902935913PMID:20204962
34. Biener L, Abrams DB. The Contemplation Ladder: validation of a measure of readiness to consider smoking cessation. Health Psychol. 1991; 10(5): 360. PMID:1935872
35. Romer D, Peters E, Strasser AA, Langleben D. Desire versus efficacy in smokers’paradoxical reac-tions to pictorial health warnings for cigarettes. PloS one, 2013; 8(1).
36. Kensinger EA, Schacter DL. When the Red Sox shocked the Yankees: Comparing negative and posi-tive memories. Psychon Bull Rev, 2006; 13(5): 757–763. PMID:17328369
37. Weinstein ND, Slovic P, Waters E, Gibson G. Public understanding of the illnesses caused by cigarette smoking. Nicotine Tob Res, 2004; 6(2): 349–355. PMID:15203808
38. Muthén LK, Muthén BO. Mplus User's Guide ( Seventh Edition). 2012. Los Angeles, CA: Muthén & Muthén.
39. Chou CP, Bentler PM, Satorra A. Scaled test statistics and robust standard errors for non‐normal data in covariance structure analysis: a Monte Carlo study. Br. J. Math. Stat. Psych., 1991; 44(2), 347–357. 40. Satorra A, Bentler PM. A scaled difference chi-square test statistic for moment structure analysis.
Psy-chometrika, 2001; 66(4), 507–514.
41. Ullman JB. Structural equation modeling. In: Tabachnick BG, Fidell LS, editors. Using multivariate sta-tistics. Boston, MA: Allyn & Bacon; 2001. p. 653–771.
42. Hu L, Bentler PM. Cutoff criteria for fit indexes in covariance structure analysis: Conventional criteria versus new alternatives. Struct Equ Modeling, 1999; 6(1): 1–55.
43. MacKinnon DP, Lockwood CM, Williams J. Confidence limits for the indirect effect: Distribution of the product and resampling methods. Multivariate Behav Res. 2004; 39(1): 99–128. PMID:20157642 44. Shrout PE, Bolger N. Mediation in experimental and nonexperimental studies: new procedures and