Original Article
115 Rev Bras Hematol Hemoter. 2013;35(2):115-8
Hematological parameters and prevalence of anemia among free-living elderly in south Brazil
Vanessa Sgnaolin Paula Engroff Luísa Scheer Ely
Rodolfo Herberto Schneider Carla Helena Augustin Schwanke Irenio Gomes
Fernanda Bueno Morrone Geraldo Attilio de Carli
Pontifícia Universidade Católica do Rio Grande do Sul - PUCRS, Porto Alegre, RS, Brazil
Conlict-of-interest disclosure:
The authors declare no competing inancial interest
Submitted: 9/18/2012 Accepted: 10/31/2012
Corresponding author: Geraldo Attilio De Carli
Pontifícia Universidade Católica do Rio Grande do Sul
Instituto de Geriatria e Gerontologia – Hospital São Lucas / PUCRS
Av. Ipiranga, 6690 – 3° andar, Jardim Botânico 90610-000 Porto Alegre, RS, Brazil Phone: (55 51) 3320-3000 [email protected]
www.rbhh.org or www.scielo.br/rbhh
DOI: 10.5581/1516-8484.20130032
Objective: The aims of this study were to analyze the hematological parameters, the prevalence of anemia and the association between anemia and socioeconomic conditions in an elderly community-based population. Methods: A population-based study was performed as part of the Multidimensional Study of the Elderly in Porto Alegre, Brazil (EMIPOA). An initial total of 1058 community residents aged 60 years and older were interviewed. Of these, 392 agreed to have a physical evaluation and a blood sample was taken from each. The hematological parameters analyzed in the blood samples included the hemoglobin concentration, mean cell volume (MCV), mean corpuscular hemoglobin concentration (MCHC) and red cell distribution width (RDW). The association between the variables and the diagnosis of anemia was assessed using the chi-squared test and a multiple logistic regression model.
Results: The overall prevalence of anemia was 12.8%. Anemia was present in 13.7% of women and in 10.4% of men. Normocytic normochromic anemia without anisocytosis was the most common type of anemia (46%). The assessment of erythrocyte morphology showed signiicant differences between anemic and non-anemic individuals (microcytosis = 12% vs. 1.5%, hypochromia = 40% vs. 8.8%, and anisocytosis = 26% vs. 7%). In the analysis of socioeconomic conditions, signiicant differences were found in respect to age and race. Conclusion: The prevalence of anemia increases with age and is associated with race, microcytosis, hypochromia and anisocytosis. Anemia is not a condition that should be associated only with the aging process, as it may be due to pathological conditions that occur most frequently in this age group. As a result, a diagnosis of anemia warrants adequate clinical attention.
Keywords: Anemia; Hematology; Erythrocyte indices; Socioeconomic factors; Aging; Humans; Aged; Brazil
Introduction
The aging process is related to a progressive decline in the functional reserves of multiple organ systems, which increases the probability of dysfunction and disease(1). Hematopoietic modulation can become unstable with aging. Peripheral blood alterations include discrete and isolated elevations in the erythrocyte sedimentation rate, mild lymphocytopenia without clinical and laboratory manifestations, decreased mean hemoglobin and hematocrit concentrations, a slight increase in erythrocyte mean cell volume (MCV) and an increase in red cell osmotic fragility(2).
According to the World Health Organization (WHO), anemia is deined as a condition
in which the hemoglobin content is below normal. This situation occurs because of different pathophysiological mechanisms.
The reduction in the hemoglobin concentration is considered pathologic when the value is lower than 13 g/dL for men and 12 g/dL for women(3). Anemia is considered a common problem in the elderly. The incidence of anemia increases with age and is associated with high risks of mortality and morbidity and a drop in the quality of life(4-6). The reported prevalence of anemia is between 8% to 44% in the elderly, especially in over 60-year-old men(7). The most prevalent types of anemia are due to nutritional deiciencies (malnutrition
and iron, vitamin B12 and folic acid deiciencies) and chronic diseases (such as cancer,
kidney disease and congestive heart failure)(8-10). Nevertheless, the frequency of anemia of undetermined etiology constitutes 14-17% of all cases in the elderly(1).
116
Sgnaolin V, Engroff P, Ely LS, Schneider RH, Schwanke CH, Gomes I, Morrone FB, de Carli GA
Rev Bras Hematol Hemoter. 2013;35(2):115-8 that is evaluated is the MCV. The MCV guides the diagnosis
of anemia and helps in its classification(13). However, the MCV value, that is, the mean size of the red cells (macrocytic, microcytic and normocytic), should be used together with the RDW, thus directing the interpretation of the variation in the size of red blood cells(14).
Hematologic laboratory testing is very useful and is widely used in the clinical practice. This study aims to evaluate the prevalence of anemia and to verify the socioeconomic conditions of the elderly living in Porto Alegre, Brazil.
Methods
Study design
This observational cross-sectional study is part of an epidemiological project (Multidimensional Study of the Elderly in Porto Alegre) in a partnership between the Porto Alegre City Hall and the Institute of Geriatric and Gerontology (IGG) at the Pontifícia Universidade Católica do Rio Grande do Sul (PUCRS).
Population and sample
The inclusion criteria for this study were male and female residents who were older than 60 years of age. The sample size required to estimate the prevalence with an acceptable margin for a confidence interval of 95% to be calculated: (i) 1% for a prevalence lower than 1% and higher than 99%; (ii) 2% for a prevalence between 1% and 5% and between 95% and 99%; (iii) 3% for a prevalence between 5% and 10% and between 90% and 95%; and (iv) 5% for a prevalence between 20% and 80%. The minimum sample size of 447 elderly residents was calculated using the statistics program “sample.exe” from the statistical package PEPI, version 4. The selection was performed randomly and by residence and was stratified by census region of the Brazilian Institute of Geography and Statistics (IBGE). Approximately 1000 interviews were conducted at the homes of elderly residents, and it was believed that half of those interviewed would participate.
Data collection
The interviews and the blood sample collections were
performed between January and July of 2006. In the irst stage,
the instrument used for data collection was a data recording card, validated by the Social Service Department, containing questions related to the socioeconomic conditions of the patient. The interview was performed in the elderly patient’s home with the help of trained interviewers (academic students, professionals or professors). The questions permitted open answers and were answered based on the patient’s memory. The second stage of the evaluation was performed in the university (PUCRS) and included blood collection and data collection from different health areas; 512 elderly patients participated in this stage of the study.
The blood samples were collected in ethylenediaminetetraacetic acid (EDTA) tubes and were immediately sent to the laboratory for hematological testing.
Elderly subjects from whom an insuficient volume of blood
was collected for the hematological test and who did not answer the socioeconomic and demographic interview questions were excluded
from the study. The inal sample included 392 elderly subjects.
Laboratory parameters
The hematological testing was performed in the Hematology Sector of the Clinical Pathology Laboratory of São Lucas Hospital (PUCRS). The equipment used included a Sysmex XT-2000i automated blood analyzer (Sysmex, Kobe, Japan). The evaluated parameters included the hemoglobin concentration and red blood cell indices (MCV, MCHC and RDW).
The reference values used for this study were: hemoglobin
of 13 g/dL for men and 12 g/dL for women, MCV 80-100l,
MCHC 31-35% and RDW up to 15%.
Statistical analysis
The database was structured in Microsoft Ofice Excel 2007
and analyzed using Statistical Package for the Social Sciences (SPSS) software, version 17.0. The prevalence of anemia was
calculated with a conidence interval of 95%. The differences
between the groups with and without anemia were analyzed using a bivariate form with the chi-squared test. To verify the prevalence rate, the strength of the association was calculated
using a conidence interval of 95%. The multivariate analysis was
performed using a multiple logistic regression model. Statistical
signiicance was deined as a p-value < 0.05.
Ethical considerations
The study was approved by the Research Ethics Committee of PUCRS (protocol number 0502935). All of the study participants signed consent forms and authorized using the data
for scientiic purposes.
Results
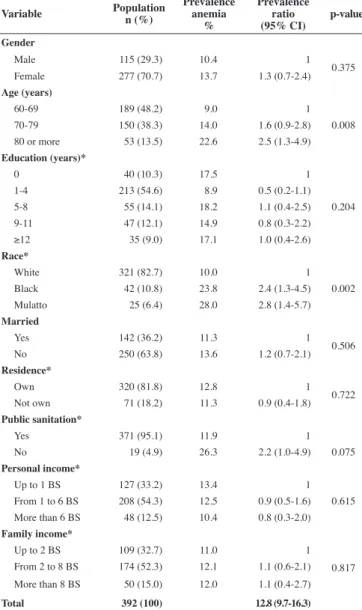
The population of this study included 392 elderly patients. From this population, 115 (29.3%) were men, and 277 (70.7%) were women. The total prevalence of anemia in this elderly population was 12.8%; the prevalence of anemia was 10.4% for men and 13.7% for women. The prevalence of anemia in relation to the demographic and socioeconomic data was dependent on age. As the age of the subjects increased there was also an increase in the prevalence of anemia (p-value = 0.008). As for race, the prevalence of anemia was higher in Blacks and mulattos than in white individuals (p-value= 0.002). When public sanitation was analyzed, the elderly who did not have basic sanitation in their homes showed a trend towards an increased prevalence of anemia (p-value = 0.075). There
117 Hematological parameters and anemia prevalence among free-living elderly in south Brazil
Rev Bras Hematol Hemoter. 2013;35(2):115-8
Table 1 - Prevalence of anemia in the elderly (≥ 60 years) according to demographic and socioeconomic data
Variable Population
n (%)
Prevalence anemia
%
Prevalence ratio (95% CI)
p-value
Gender
Male 115 (29.3) 10.4 1
0.375
Female 277 (70.7) 13.7 1.3 (0.7-2.4)
Age (years)
60-69 189 (48.2) 9.0 1
0.008
70-79 150 (38.3) 14.0 1.6 (0.9-2.8)
80 or more 53 (13.5) 22.6 2.5 (1.3-4.9)
Education (years)*
0 40 (10.3) 17.5 1
0.204
1-4 213 (54.6) 8.9 0.5 (0.2-1.1)
5-8 55 (14.1) 18.2 1.1 (0.4-2.5)
9-11 47 (12.1) 14.9 0.8 (0.3-2.2)
≥12 35 (9.0) 17.1 1.0 (0.4-2.6)
Race*
White 321 (82.7) 10.0 1
0.002
Black 42 (10.8) 23.8 2.4 (1.3-4.5)
Mulatto 25 (6.4) 28.0 2.8 (1.4-5.7)
Married
Yes 142 (36.2) 11.3 1
0.506
No 250 (63.8) 13.6 1.2 (0.7-2.1)
Residence*
Own 320 (81.8) 12.8 1
0.722
Not own 71 (18.2) 11.3 0.9 (0.4-1.8)
Public sanitation*
Yes 371 (95.1) 11.9 1
No 19 (4.9) 26.3 2.2 (1.0-4.9) 0.075
Personal income*
Up to 1 BS 127 (33.2) 13.4 1
0.615 From 1 to 6 BS 208 (54.3) 12.5 0.9 (0.5-1.6) More than 6 BS 48 (12.5) 10.4 0.8 (0.3-2.0)
Family income*
Up to 2 BS 109 (32.7) 11.0 1
0.817 From 2 to 8 BS 174 (52.3) 12.1 1.1 (0.6-2.1) More than 8 BS 50 (15.0) 12.0 1.1 (0.4-2.7)
Total 392 (100) 12.8 (9.7-16.3)
CI: Conidence interval; BS: Basic salary (~US$ 336.40) *some data are missing
Table 2 - Frequency distribution of red blood cell changes (MCHC, MCV and RDW) in elderly patients with and without anemia
MCHC MCV RDW
With anemia (N = 50)
Without anemia (N = 342)
n (%) 95% CI n (%) 95% CI
Hypochromia
Microcytosis < 15 0 (0.0) 0.0-5.7 0 (0.0) 0.0-0.9 ≥ 15 4 (8.0) 2.6-17.6 5 (1.5) 0.5-3.1
Normocytosis < 15 13 (26.0) 15.4-39.0 35 (10.2) 7.3-13.7 ≥ 15 3 (6.0) 1.5-14.9 10 (2.9) 1.5-5.1
Macrocytosis < 15 0 (0.0) 0.0-5.7 0 (0.0) 0.0-0.9 ≥ 15 0 (0.0) 0.0-5.7 0 (0.0) 0.0-0.9
Normochromia
Microcytosis < 15 1 (2.0) 0.1-9.0 3 (0.9) 0.2-2.3 ≥ 15 1 (2.0) 0.1-9.0 1 (0.3) 0.0-1.4
Normocytosis < 15 23 (46.0) 32.8-59.6 287 (83.9) 79.8-87.5 ≥ 15 5 (10.0) 3.7-20.2 14 (4.1) 2.3-6.6
Macrocytosis < 15
0 (0.0) 0.0-5.7 5 (1.5) 0.5-3.1 ≥ 15 0 (0.0) 0.0-5.7 1 (0.3) 0.0-1.4
MCHC: Mean corpuscular hemoglobin concentration; MCV: Mean corpuscular volume; RDW: Red cell distribution width; CI: Conidence interval
independent associations between age (p-value = 0.009) and race (p-value< 0.001) with anemia.
The red blood cell alterations were evaluated, and there
were signiicant differences between the anemic and non-anemic
groups: 6 (12.0%) versus 5 (1.5%) with microcytosis (p-value= 0.001); 20 (40.0%) versus 30 (8.8%) with hypochromia (p-value
< 0.001) and 13 (26.0%) versus 24 (7.0%) with anisocytosis
(p-value< 0.001), respectively.
Table 2 shows the anemia classification based on MCV, MCHC, and RDW. The hypochromia, microcytosis and anisocytosis occurred in four elderly patients with anemia (8.0%). Isolated hypochromic anemia occurred in 13 (26.0%) patients with anemia, and three (6.0%) patients with anemia had anisocytosis. Twenty-three (46.0%) elderly anemic patients demonstrated no alterations in the red blood cell indices.
Discussion
Anemia is a critical clinical problem in the elderly population
with a signiicant public health impact. Data on the prevalence of
anemia are varied and depend on the location and the population. The present study demonstrated a prevalence of anemia of 12.8% in the elderly of Porto Alegre. The low prevalence of anemia observed when using the hemoglobin concentration as the indicator was very similar to rates described in studies of elderly Americans, which report a prevalence of between 8.3% and 13.0%(15,16). The similarities in prevalence may be associated with a greater concern with the aging population and the greater emphasis on their health. Another important factor that helps to explain the low prevalence of anemia in our study was that 67.3% of the elderly had a family
income greater than 2 basic salaries (approximately US$ 336.40).
The prevalence of anemia increases with advancing age:
9.0% among those aged ≥ 60 years, 14.0% in patients ≥ 70 years,
and 22.6% in patients > 80 years. Our results are similar to the study by Skjelbakken et al.(17) who reported that the prevalence of anemia among men aged 55-64 years was 3.5%, and the prevalence in over 85-year-old men was 29.6%. The prevalence of anemia was 2.2% for women who were 55-64 years of age and 16.5% in older women (> 85 years). In the Third National Health and Nutrition Examination Survey (NHANES III), the prevalence of anemia increased to greater than 20% in octogenarians.(5) The increase in the frequency of anemia in older individuals is sometimes regarded as inherent to the aging process. Nevertheless, further investigations of the cause of anemia and the completion of treatment may help to improve clinical conditions in the elderly population. It is important to remember that anemia is multifactorial, and its occurrence may
be due to the presence of cancer, inlammatory diseases, kidney
disease (due to diabetes and hypertension), and the use of several drugs commonly required in the elderly population(18).
Our indings demonstrate a higher prevalence of anemia
118
Sgnaolin V, Engroff P, Ely LS, Schneider RH, Schwanke CH, Gomes I, Morrone FB, de Carli GA
Rev Bras Hematol Hemoter. 2013;35(2):115-8 10.9% in men(14). In contrast, a study performed by Olivares et
al.(19) enrolled 274 elderly outpatients in Chile and found a low prevalence of overall anemia, but a higher prevalence among men (5.4%) compared to women (4.4%). This increase in the prevalence of anemia in men was also described in the NHANES III study, with men accounting for 11.6% of the cases of anemia versus 10.2% for women(5). In an attempt to explain the different prevalence rates of anemia for men and women, some authors have argued that estrogens act as inhibitors of erythropoiesis and make women more vulnerable to the development of anemia. However, while postmenopausal estrogen levels decrease, there is an increase in red cell mass to levels that are similar to those in males, which makes it unreasonable to use different criteria for anemia in each gender (20,21). Several studies have reported no
signiicant differences between the genders, which demonstrates
that there is a direct relationship between these factors.
When observing the relationship between anemia and ethnic groups, it was found that patients who described themselves as mulattos and Blacks had higher percentages of anemia (28.0% and 23.8%, respectively) compared to Whites (10.0%). Denny et al.(22) reported a prevalence of anemia of 34.0% for Blacks and 14.0% for Whites. In addition, Guralnik et al.(5) found a prevalence of 28.0% for Blacks and 9.0% for Whites. These differences can be explained by environmental conditions, such as nutritional intake, serum iron stocks, habitation, and access to health services. Furthermore, some
genetic changes that lead to mutations in speciic genes are found
in most people of African descent, and therefore, diseases such as
sickle cell anemia and thalassemia-α could be responsible for the signiicant decrease in hemoglobin levels in this population (23).
Elderly patients with anemia were classiied according
to the assessment of red blood cell indices. Most patients had normochromic and normocytic anemia, which suggests a diagnosis of anemia of chronic disease. Data reported by Carmel(24) also indicate a higher prevalence of normocytic and normochromic anemia and a smaller proportion of cases of microcytic anemia (MCV = 75-82 fL). In contrast, the study by Failace(20) describes that the majority of cases are due to hypochromic anemia and
iron deiciency. Hypochromic anemia represents the second most
common pattern observed in our study.
Conclusion
Race is a factor that is linked to higher rates of anemia. Likewise, increasing age is closely associated with hemoglobin levels and the prevalence of anemia, which is mostly normocytic and normochromic. However, anemia is not a condition that should only be associated with the aging process. Anemia may be due to pathological conditions that occur more frequently in elderly patients, and thus it deserves adequate clinical attention.
References
1. Schaan MD, Schwanke CH, Bauer M, Luz C, Cruz IM. Hematological and nutritional parameters in apparently healthy elderly. Rev Bras Hematol Hemoter. 2007;29(2):136-43.
2. Freedman ML, Weintraub NT. Envelhecimento normal e padrão de
doença hematológica. In: Abrams WB, editor. Manual Merck de Geriatria. São Paulo: Roca; 1995. p.689-734.
3. World Health Organization. Iron deiciency anaemia: assessment, prevention and control. A guide for programme managers. WHO: Geneva; 2001. 4. Gualandro SF, Hojaij NH, Jacob Filho W. Deiciência de ferro no idoso.
Rev Bras Hematol Hemoter. 2010;32(supl. 2):57-61.
5. Guralnik JM, Ershler WB, Schrier SL, Picozzi VJ. Anemia in the elderly: a public health crisis in hematology. Hematology Am Soc Hematol Educ Program. 2005;528-32.
6. Lipschitz D. Medical and functional consequences of anemia in the elderly. J Am Geriatr Soc. 2003;51(suppl):S10-3.
7. Berkahn L, Keating A. Hematopoiesis in the elderly. Hematology. 2004;9(3):159-63.
8. Choi CW, Cho WR, Park KH, Choi IK, Seo JH, Kim BS, et al. The cutoff value of serum ferritin for the diagnosis of iron deiciency in community-residing older persons. Ann Hematol. 2005;84(6):358-91.
9. Sánchez H, Albala C, Hertrampf E, Verdugo R, Lavados M, Castillo JL, et al. [Prevalence of vitamin B-12 deiciency in older adults]. Rev Med Chile. 2010;138(1):44-52. Spanish.
10. Smith DL. Anemia in the elderly. Am Fam Physician. 2000;62(7):1565-72.
11. Mukhopadhyay D, Mohanaruban K. Iron deiciency anaemia in older people: investigation, management and treatment. Age Ageing. 2002;31(2):87-91. Comment in: AgeAgeing. 2003;32(1):116-7. 12. Paiva AA, Rondó HC, Shinohara EM. [Parameters for the assessment of
iron status] Rev Saude Publica. 2000;34(4):421-6. Portuguese. 13. Wintrobe, MM. Hematologia Clínica. Manole: São Paulo: 1998. 14. Barbosa DL, Arruda IK, Diniz AS. Prevalência e caracterização da
anemia em idosos do Programa de Saúde da Família. Rev Bras Hematol Hemoter. 2006;28(4):288-92.
15. Bang SM, Lee JO, Kim YJ, Lee KW, Lim S, Kim JH, et al. Anemia and activities of daily living in the Korean urban elderly population: Results from the Korean Longitudinal Study on Health and Aging (KLoSHA). Ann Hematol. 2013;92(1):59-65.
16. Timiras MT, Brownstein H. Prevalence of anemia and correlation of hemoglobin with age in a geriatric screening clinic population. J Am Geriatr Soc. 1987;35(7):639-43.
17. Skjelbakken T, Langbakk B, Dahl IM, Lochen ML; Tromso Study. Haemoglobin and anaemia in a gender perspective: the Tromso Study. Eur J Haematol. 2005;74(5):381-8.
18. Cliquet MG. Como diagnosticar e tratar anemia no idoso. Rev Bras Med. 2010;67(4):89-96.
19. Olivares M, Hertramp E, Capurro MT, Wegner D. Prevalence of anemia in elderly subjects living at home: role of micronutrient deiciency and inlammation. Eur J Clin Nutr. 2000;54(11):834-9.
20. Failace R. Hemograma: manual de interpretação. Porto Alegre: Artmed; 1995. p.197.
21. Sahadevan S, Choo PW, Jayaratnam FJ. Anaemia in the hospitalized elderly. Singapore Med J. 1995;36(4):375-8.
22. Denny SD, Kuchibhatla MN, Cohen HJ. Impact of anemia on mortality, cognition, and function in community-dwelling elderly. Am J Med. 2006;119(4):327-34.
23. Beutler E, West C. Hematologic differences between African- Americans and whites: the roles of iron deiciency and alpha thalassemia on hemoglobin levels and mean corpuscular volume. Blood. 2005;106(2):740-5. Comment in: Blood. 2006;107(5):2208; author reply 2208-9.
24. Carmel R. Anemia and aging: an overview of clinical, diagnostic and biological issues. Blood Rev. 2001;15(1):9-18.