ABSTRACT:Objective: To assess the efect of socioeconomic position (SEP) in childhood and social mobility on linear growth through adolescence in a population-based cohort. Methods: Children born in Cuiabá-MT, central-western Brazil, were evaluated during 1994 – 1999. They were irst assessed during 1999 – 2000 (0 – 5 years) and again during 2009 – 2011 (10 – 17 years), and their height-for-age was evaluated during these two periods. Awealth index was used to classify the SEP of each child’s family as low, medium, or high. Social mobility was categorized as upward mobility or no upward mobility. Linear mixed models were used. Results: We evaluated 1,716 children (71.4% of baseline) after 10 years, and 60.6% of the families showed upward mobility, with a higher percentage among the lowest economic classes. A higher height-for-age was also observed among those from families with a high SEP both in childhood (low SEP= -0.35 z-score; high SEP= 0.15 z-score, p < 0.01) and adolescence (low SEP= -0.01 z-score; high SEP= 0.45 z-score, p < 0.01), whereas upward mobility did not afect their linear growth. Conclusion: Expressive social mobility was observed, but SEP in childhood and social mobility did not greatly inluence linear growth through childhood in this central-western Brazilian cohort.
Keywords:Social class. Social mobility. Growth. Cohort study. Adolescent.Child.
Efects of socioeconomic position
and social mobility on linear growth
from early childhood until adolescence
Efeitos da classe econômica e mobilidade social no
crescimento linear desde a infância até a adolescência
Ana Paula MuraroI, Rita Adriana Gomes de SouzaI, Paulo Rogério Melo RodriguesII, Márcia Gonçalves FerreiraIII, Rosely SichieriIII
IPublic Health Institute, Universidade Federal do Mato Grosso – Cuiabá (MT), Brazil.
IISchool of Nutrition, Department of Food and Nutrition, Universidade Federal do Mato Grosso – Cuiabá (MT), Brazil. IIIInstitute of Social Medicine, Universidade do Estado do Rio de Janeiro – Rio de Janeiro (RJ), Brazil.
Corresponding author: Ana Paula Muraro. Collective Health Institute, Universidade Federal de Mato Grosso. Avenida Fernando Corrêa da Costa, 2.367, Boa Esperança, bloco CCBS III, CEP: 78060-900, Cuiabá, MT, Brasil. E-mail: [email protected]
Conlict of interests: nothing to declare – Financial support: Brazilian National Research Council (CNPq) and the Research Council of State of Mato Grosso (FAPEMAT).
INTRODUCTION
Among the social determinants of health, there is a great concern in regarding the efects of socioeconomic gradients in health1.More speciically, because socioeconomic
disadvantages over the course of one’s life may hasten poor health.In recent years, the efect ofchildhood socioeconomic position (SEP) and how it may relate to health outcomes in adulthood have been investigated2. Systematic review has demonstrated associations
between childhood SEP and an increased risk for coronary heart disease, stroke, and all-cause mortality3. However, the mechanisms by which adverse social circumstances over
the life course increase the risk of adverse health outcomes later on have not yet been fully explained.
Social mobility can be characterized as the individual’s trajectory within a social structure over their lifespan, and can be expressed through income, education, social class, or other forms of classiication4. This type of mobility represents an individual’s change from one
category to another over a period of time. It is classiied as “null” (when no change occurs), “upward” (when a person moves up one or more categories), or “downward” (when a per-son moves down one or more classes)5.
Investigation into socioeconomic inequalities in health is a relatively young ield in low and middle-income countries (with publications only beginning to appear from the late twentieth century onward)6,7. Brazil, even with advances in combating poverty, is still one
RESUMO:Objetivo:Avaliar o efeito da classe econômica na infância e mobilidade social no crescimento linear ao longo da adolescência em uma coorte de base populacional. Métodos:Crianças nascidas entre 1994 – 1999 em Cuiabá-MT, no centro-oeste do Brasil foram avaliadas pela primeira vez durante 1999 – 2000 (0 – 5 anos) e novamente durante 2009 – 2011 (10 – 17 anos), sendo a estatura-para-idade avaliada nestes dois períodos. O Critério Brasil foi usado para classiicar a classe econômica da família de cada criança como baixo, médio ou alto. A mobilidade social foi categorizada como mobilidade ascendente ou nenhuma mobilidade ascendente (manutenção e mobilidade descendente). Foram utilizados modelos lineares de efeitos mistos. Resultados:Foram avaliadas 1.716 crianças (71,4% da linha de base) após 10 anos de seguimento, e 60,6% das famílias mostraram mobilidade ascendente, com uma percentagem mais elevada entre as classes econômicas mais baixas. Também foi observada uma maior altura-para-idade entre aqueles de famílias com elevada classe econômica, tanto na infância (baixa classe econômica= -0,35 z-score; elevada classe econômica = 0,15 z-score, p < 0,01) e adolescência (baixa classe econômica= -0,01 z-score; elevada classe econômica= 0,45 z-score, p < 0,01), ao passo que a mobilidade ascendente não afetou o crescimento linear. Conclusão: Foi observada expressiva mobilidade social, mas a classe econômica na infância e a mobilidade social não apresentaram inluência signiicativa na taxa de crescimento linear durante a infância nesta coorte do Centro-Oeste brasileiro.
of the world’s most unequal countries, being the most unequal among the G20 countries8
in regards to socioeconomic status and health. Between 1973 and 2008, a signiicant increase of social mobility was observed in Brazil9; however, the greatest mobility has occurred
in the last decade. Between 2001 and 2011, the 10% poorest section of the country expe-rienced a cumulative revenue growth of 91.2%, while the richest part of the population hadan increase of 16.6% in the same period10. Changes in the economy and in public
poli-cies reduced social inequality in Brazil11.
Growth is a widely used measure to gauge the quality of a child’s environment because growth failure is linked to a broad range of adverse outcomes in life, and is related to later physical and cognitive development12,13. A positive association between SEP and height
has been demonstrated in children in high-income countries as well as in low to mid-dle-low income countries14,15, but few studies have examined the efect of SEP on height
in adolescents16,17.
Investigating the association between SEP and growth trajectories, however, requires longitudinal analyses of repeated height measurements. An investigation of this associ-ation in childhood would indicate whether the development of socioeconomic inequali-ties in adolescent or adult height could be partly attributed to inequaliinequali-ties in linear growth during this critical period.Therefore, this study aimed to evaluate the efect of one’s socio-economic position in childhood and of social mobility on linear growth through adoles-cence in a population-based cohort.
MATERIAL AND METHODS
SUBJECTS
A cohort of children born between 1994 and 1999 in Cuiabá, the capital of the state of Mato Grosso, in central-western Brazil, was evaluated at primary health clinics from May 1999 to January 2000. Ten vaccination clinics were randomly selected, and the par-ents or guardians of approximately 240 children randomly chosen from each clinic were interviewed (n = 2405). All guardians who accompanied their children were invited to par-ticipate; the refusal rate was of 0.4%. The coverage in Brazil for the diphtheria, pertussis, tetanus (DPT) vaccine at that point was 97%. A full description of the sampling plan had been described previously18.
All the subjects enrolled at baseline were eligible for follow-up study at their schools between 2009 and 2011. In Brazil, approximately 95% of children aged 10–14 years and 78% of children aged 15 – 17 years attend school19. The annual School Census in Brazil was used
Fieldwork was carried out between 2009 and 2011 in public and private schools in Cuiabá as well as in additional cities on one occasion in the follow-up period after 11 years; 14.4% of the baseline children had moved to other cities. One city, Várzea Grande, is geographi-cally and economigeographi-cally integrated toCuiabá. The other subjects had relocated to 17 cities within the state of Mato Grosso (near the capital) and 5 capital cities from other Brazilian states (Campo Grande-MS, Brasília-DF, São Paulo-SP, Rio de Janeiro-RJ, and Goiânia-GO). Information about the subjects’ birth (e.g., length and weight) was obtained from hospital records, but all outcomes and the majority of thevariables during childhood and adoles-cence were measured by a trained team of nutritionists. A pretest of the research protocol and a pilot study were conducted in a similar group of parents (at baseline) and adolescents (at follow-up) in order to test the understanding of the questionnaire, correct possible laws, and standardize data collection.
MEASURES AND DATA ANALYSIS
At the irst evaluation, when the children were under 5years old (1999–2000), informa-tion about demographic and socioeconomic characteristics was obtained by interviewing the parents or guardians. From 2009–2011, the subjects (then adolescents) provided informa-tion about their socioeconomic and lifestyle factors using a pretested quesinforma-tionnaire. At both interviews, anthropometric measurements (weight and length/height) were collected by trained ield workers according to the techniques recommended by Lohman et al.20. Using the
anthropometric measures obtained at the irst interview and during follow-up, the subjects’ length/height for age and gender were calculated according to the growth curves published by the World Health Organization (WHO), and were expressed in z-scores21,22. The scores
were calculated using the WHO Anthro program, version 3.1.
The SEP of the families was based on the number of home appliances, cars, and paid maids, as well as the educational level of the head of the household according to the “Brazil Criterion” of economic classiication23,24. This system has ive classes: A (higher), B, C, D,
and E (lower). For our analysis, individuals were reclassiied into three SEP groups accord-ing to similar analyses by Muraro et al.25: low (E class), medium (C and D classes), and high
(A and B classes), according to the number of observations at categories. Maternal educa-tional level was categorized as low (less than eight years of school), medium (between eight and eleven years), and high (more than eleven years).
For the analysis, we considered the theoretical model of pathways by which maternal education might inluence early childhood linear growth from Silva et al.26. The factors
considered were:maternal characteristics like educational level, smoking during preg-nancy, height (cm); and child characteristics like gender and birth weight (g). The mean z scores for length/height-for-age in childhood and adolescence were compared using the Student’s t-test and analysis of variance (ANOVA). P values for trend were derived from the chi-square test for trend (categorical factors), or for the linear trend test using a one-way ANOVA. For the longitudinal analysis, the outcome was length/height-for-age z-score. Linear mixed efects models (SAS Proc MIXED) were used to assess the efects of early childhood SEP and social mobility on height from birth to adolescence to account for the correlation between measurements27. The main efects of time and
social mobility, and the interaction between social mobility and time were tested. A sig-niicant interaction provides evidence for a diferential rate of growth in height over time. Regression residuals were examined graphically to assess the goodness of the it. Analyses were performed using the Statistical Analysis Systems software package, ver-sion 9.3 (SAS Institute, Cary, NC, USA).
The study was approved by the Ethics Committee of the Júlio Müller University Hospital at the Universidade Federal do Mato Grosso (651/CEP-HUJM/2009 Protocol). Parents or guardians of the participating adolescents provided written informed consent.
RESULTS
At the irst evaluation, 2,405 pre-school children had their height and weight measured. Information regarding their length and weight at birth was obtained from hospital records for 2,394 (99.5%) subjects. After approximately 11 years, 1,716 adolescents were measured and interviewed (71.4% of baseline). The average age at childhood was 1.5 years (SD = 1.4), while that at adolescence was 12.1 years (SD = 1.4).
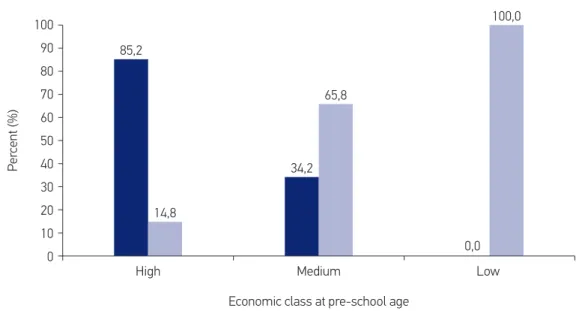
At baseline to 15.3% (n = 263) of children were classiied as high economic position, 76.9% (n = 1320) as medium and 7.8% (n = 133) as low. In the follow-up, 40.2% (n = 689) were classiied as high and 59.8% (n = 1027) as medium, therefore no children was classiied as low economic class (data not shown). Signiicant upward social mobility was observed in the study population (60.6%), and mobility was more prevalent among families that started out in the lower economic class (Figure 1). Families with a low economic class showed a higher proportion of low maternal education, a higher prevalence of smoking during pregnancy, and a lower mean maternal height. A higher mean of length/height-for-age in both childhood and adolescence was observed among families of higher socioeconomic status (Table 1). There was no diference in birth weight and height-for-age according to social mobility (Table 2).
Figure 1. Social mobility until adolescence, according to economic class at preschool age (n = 1716).
p-values for χ2 test <0.01.
65,8
0,0 100,0
85,2
Economic class at pre-school age
High Medium Low
100
Per
cent (%)
90
80
70
60
50
40
30
20
10
0
34,2
14,8
Not upward mobility Upward mobility
Table 1. Characteristics of the study population, according to the economic position at preschool age of children (n =1,716).
*p-values for trend are derived from χ2 test for trend (categorical factors) or for the linear trend test of the ANOVA. BMI =body mass index.
Data were missing for maternal education level (n = 14), smoking during pregnancy (n = 14), height of mother (n = 4), height-for-age at birth (n = 8), and BMI-for-age at birth (n = 11).
Total (n =1716)
Economic position at preschool age
Low (n =133)
Medium (n = 1320)
High (n = 263)
p-value for trend*
Maternal characteristics
Educational level
(% low) 62.3 87,8 30.9 12.0 0.01
Smoking during
pregnancy (%) 9.7 16.5 10.4 3.0 0.01
Height (cm) 158.9 (6.3) 157,4 (6.3) 158,6 (6.2) 161,2 (6.3) 0.01
Child characteristics
Gender (% boys) 50.7 52.1 51.1 44.4 0.30
Birth weight (g) 3256.30 (499.7) 3229.5 (486.4) 3256.1 (500.9) 3270.8 (501.5) 0.74
Height-for-age (z score)
Birth -0.39 (1.29) -0.49 (1.33) 0.38 (1.30) -0.37 (1.20) 0.48
Preschool age -0.18 (1.14) -0.35 (1.06) -0.23 (1.15) 0.15 (1.08) <0.01
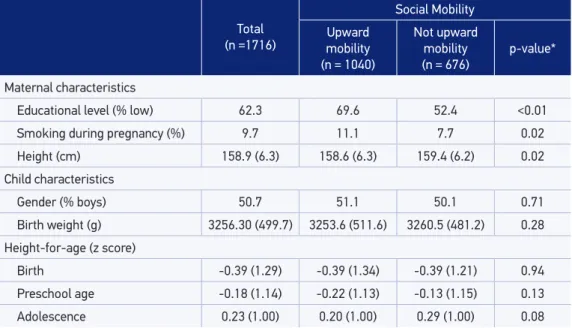
Table 2. General characteristics of the population of study, according to social mobility (n =1716).
*P-value for Chi-square or ANOVA tests.
Total (n =1716)
Social Mobility
Upward mobility (n = 1040)
Not upward mobility (n = 676)
p-value*
Maternal characteristics
Educational level (% low) 62.3 69.6 52.4 <0.01
Smoking during pregnancy (%) 9.7 11.1 7.7 0.02
Height (cm) 158.9 (6.3) 158.6 (6.3) 159.4 (6.2) 0.02
Child characteristics
Gender (% boys) 50.7 51.1 50.1 0.71
Birth weight (g) 3256.30 (499.7) 3253.6 (511.6) 3260.5 (481.2) 0.28
Height-for-age (z score)
Birth -0.39 (1.29) -0.39 (1.34) -0.39 (1.21) 0.94
Preschool age -0.18 (1.14) -0.22 (1.13) -0.13 (1.15) 0.13
Adolescence 0.23 (1.00) 0.20 (1.00) 0.29 (1.00) 0.08
Table 3. Linear mixed-efects model with height-for-age (z score) according to socioeconomic position in childhood, maternal educational level, and social mobility between childhood and adolescence.
Model 1: adjusted only for child age; Model 2: adjusted for birth weight, maternal smoking in pregnancy, and maternal height.
Model 1 Model 2
B Standard Error p-value B Standard Error p-value
MODEL: Socioeconomic position at childhood
Height-for-age (z score) at birth (intercept)
Low -0.29 0.11 0.01 -0.12 0.09 0.19
Medium -0.18 0.07 0.01 -0.08 0.06 0.15
High - - -
-Rate of change of Height-for-age (z score)
Age* Low -0.02 0.01 0.13 -0.01 0.01 0.14
Age* Medium -0.01 0.01 0.35 -0.01 0.01 0.38
Age* High - - -
-MODEL: Social Mobility
Height-for-age (z score) at intercept (birth)
Upward mobility -0.02 0.05 0.58 0.01 0.04 0.75
Not upward mobility - - -
-Rate of change of Height-for-age (z score)
Age* Upward mobility -0.01 0.004 0.15 -0.01 0.004 0.14
-DISCUSSION
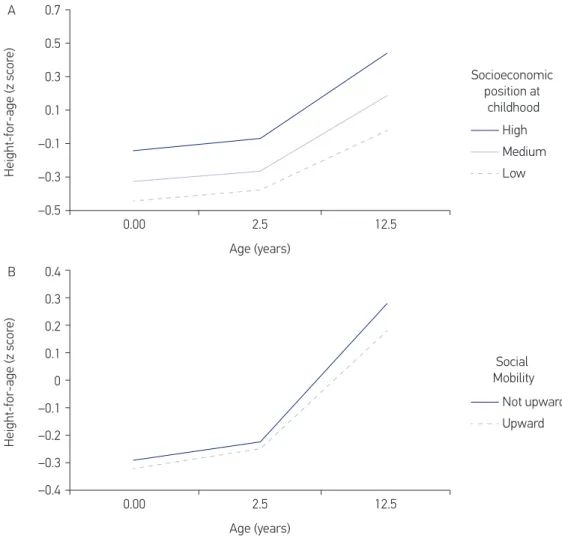
The present study provides information regarding childhood SEP and also the efect of social mobility on linear growth until adolescence. In general, signiicant upward social mobil-ity was observed in the study, mainly in families in the lower economic class. Children from families of a higher socioeconomic status at the irst evaluation presented a higher mean of height-for-age in childhood and adolescence. The analysis revealed no signiicant impact of childhood SEP or of social mobility on linear growth until adolescence; those with a low SEP showed no overcompensation for their initial height deicit in comparison to those with a high SEP. Thus, it is possible that inequalities in adolescent health may already be deter-mined in childhood and may be further accentuated by socioeconomic inequalities in behav-ior and educational attainment in childhood16,28. According to Barros et al.16, a worsening
Figure 2. Linear mixed-efects model with height-for-age (z score) according to socioeconomic position in childhood (A) and social mobility (B) between childhood and adolescence.
Height-for-age (z scor
e)
Socioeconomic position at
childhood
0.00 2.5 12.5
0.7
0.5
0.3
0.1
–0.1
–0.3
–0.5
Age (years)
High
Medium Low A
0.00 2.5 12.5
0.4
0.2 0.3
0.1
0
–0.1
–0.2
–0.3
–0.4
Age (years)
Social Mobility
Not upward
Upward
Height-for-age (z scor
e)
in SEP between birth and adolescence seems to also limit height, as individuals who were not poor at birth but became poor later on presented a mean height that was intermediate between those who were never poor and those who were poor at birth. However, it should be noted that most of the children in the cohort experienced upward change.
While there seems to be a stronger relationship between a better childhood SEP and more positive health outcomes in childhood29,30, the relationship with social mobility remains
uncertain. Some studies have found an association between social mobility and height in adolescence16,17, while others have reported a partial or weakrelationship28,31, ordidnot ind
any relationship at all.
Barros et al.16 analyzed the association of height with a change in SEP between birth and
19 years of age in a birth cohort from Pelotas, Brazil. Information on family income in 1982 and 2001 was used to classify the study population. Height showed a similar trend for men and women, with the never poor subjects presenting the highest mean, followed by those who were not poor at birth but later became poor. Those who were poor at birth, regard-less of their later status, were the shortest subjects. Howe et al.28 examined maternal
educa-tion inequalities across multiple outcomes and how these inequalities changed across child-hood and adolescence in the Avon Longitudinal Study of Parents and Children (ALSPAC), a cohort born from 1991–1992 in southwest England (N=5560–11463). Those ofspring with a higher maternal education level were taller, and there was evidence of a slight widening of socioeconomic inequalities along with height for ages between 11 and 15 years.
Most studies have assessed just one or two measures of SEP at each stage of the life course32. Howe et al.33 argued that there is no single ideal measure of SEP for all studies and
contexts, and advised the use of that which is best suited to the speciic research question. Our study evaluated the SEP of the families based upon the number of home appliances, cars, and paid maids, as well as the educational level of the head of the household, for the economic classiication. This “Brazil Criterion” was not developed to consider health concerns and social welfare, but it has been used widely in the country and has an association with several morbidities and risk factors in the population34. Furthermore, the highest degree of
upward mobility among those in the lower economic classes in the present study is similar to that observed in other studies using criteria other than the “Brazil Criterion” used here16.
The social mobility in our study follows the same trend observed in national data35.
This signiicant upward social mobility can be partly explained by the Bolsa Família Program
(BFP). The BFP, which was created in 2003, is a cash transfer program for poor families that aims to promote immediate poverty alleviation through direct income transfers. In 2009, the BFP reached12.4 millionfamiliesand accounted for12% of thedecline in inequalitymea-sured by the Gini Indexin recent years36.
Attempts to measure the association between intergenerational mobility and health and risk behaviors among adolescents may present some methodological complications. According to Ritterman et al.37, household and parental indicators of SEP may be useful
have attained a diferent social position than that of their parents, such as a diferent educa-tional attainment level or occupaeduca-tional grade. Instead, adolescent class identity may be more inluenced by social processes associated with social position, such as national educational systems38, cultural norms and values, and future expectations39. Furthermore, adolescents
are in a transition between being deined by their parents’ social position and by their own, and it is possible that adolescent social status may be inluenced by projections of a poten-tial future socioeconomic trajectory39.
The key strengths of this study are its use of longitudinal analyses of repeated height measurements and inclusion of the maternal height as a genetic proxy for adolescent height40.
Maternal height represents inluences from genetic and non-genetic factors, including inter-generational factors related to nutrition on growth, which may avoid the development of genetic height potential in low and middle-income countries41,42.
One limitationof our study was the loss to follow-up (28.6% of baseline);the baseline characteristics of participants and those lost to follow-up were compared in a previous pub-lication43, and the loss to follow-up was greater among adolescents who had low
height-for-age, mothers with less education and among those exposed to maternal smoking during pregnancy.However, few of them were lost due to a refusal to participate in the study, with most of the losses to follow-up occurring by family moving toother states43. Another
lim-itation relates to the lack of assessment of the subject’s sexual maturation. Furthermore, the information of economic class based onthe adolescent’s report would be considered a limitation, but this criterion is generally used in epidemiological studies among adolescents. The results regarding economic disparities in health have been similar to that observed in adults and the elderly, such as the use of health services44.
CONCLUSION
In conclusion, up to adolescence, we found no evidence that diferences in height due to SEP could improve with upward social mobility. Our results suggest that such inequali-ties in growthare established in early childhood. Other studies with methodological reine-ment to measure social mobility may contribute to future assessreine-ments of social mobility efect on height.
REFERENCES
1. World Health Organization. Closing the Gap in a Generation: Health Equity Through Action on the Social Determinants of Health. Geneva: WHO; 2008.
2. Senese LC, Almeida ND, Fath AK, Smith BT, Loucks EB. Associations between childhood socioeconomic position and adulthood obesity. Epidemiol Rev. 2009;31:21-51.
3. Galobardes B, Lynch JW, Smith GD. Is the association between childhood socioeconomic circumstances and cause-speciic mortality established? Update of a systematic review. J Epidemiol Community Health. 2008;62:387-90.
5. Mishra G, Nitsch D, Black S, De Stavola B, Kuh D, Hardy R. A structured approach to modelling the efects of binary exposure variables over the life course. Int J Epidemiol. 2009;38:528-37.
6. Almeida-Filho N, Kawachi I, Filho AP, Dachs JN. Research on health inequalities in Latin America and the Caribbean: bibliometric analysis (1971-2000) and descriptive content analysis (1971-1995). Am J Public Health. 2003;93:2037-43.
7. Victora CG, Barros FC, Vaughan JP. Epidemiology of inequality: a longitudinal study of 6000 Brazilian children. 6ª ed.1988.
8. OXFAM International. Deixados para trás pelo G20? Desigualdade e degradação ambiental ameaçam excluir os pobres dos benefícios do crescimento econômico. OXFAM International; 2012.
9. Ribeiro CAC. Quatro Décadas de Mobilidade Social no Brasil. Dados. 2012;55:641-79.
10. Instituto de Pesquisa Econômica Aplicada. The inclusive decade. (2001-2011): Inequality, poverty and income policies. IPEA; 2012.
11. Porchmann M. Social structure in Brazil: recent changes. Serv Soc Soc. 2010;637-49.
12. Hoddinott J, Behrman JR, Maluccio JA, Melgar P, Quisumbing AR, Ramirez-Zea M, et al. Adult consequences of growth failure in early childhood. Am J Clin Nutr. 2013;98:1170-8.
13. Victora CG, Adair L, Fall C, Hallal PC, Martorell R, Richter L, et al. Maternal and child undernutrition: consequences for adult health and human capital. Lancet. 2008;371:340-57.
14. Drachler Mde L, Bobak M, Rodrigues L, Aertz DR, Leite JC, Danova J, et al. The role of socioeconomic circumstances in diferences in height of pre-school children within and between the Czech Republic and southern Brazil. Cent Eur J Public Health. 2002;10:135-41.
15. Howe LD, Tilling K, Galobardes B, Smith GD, Gunnell D, Lawlor DA. Socioeconomic diferences in childhood growth trajectories: at what age do height inequalities emerge? J Epidemiol Community Health. 2012;66:143-8.
16. Barros AJ, Victora CG, Horta BL, Goncalves HD, Lima RC, Lynch J. Efects of socioeconomic change from birth to early adulthood on height and overweight. Int J Epidemiol. 2006;35:1233-8.
17. Krzyzanowska M, Mascie-Taylor CG. Impact of social mobility and geographical migration on variation in male height, weight and body mass index in a British cohort. J Biosoc Sci. 2012;44:221-8.
18. Gonçalves-Silva RM, Sichieri R, Ferreira MG, Pereira RA, Muraro AP, Moreira NF, et al. The school census as a search strategy for children and adolescents
in epidemiological studies. Cad Saúde Pública. 2012;28:400-4.
19. Programa das Nações Unidas para o Desenvolvimento. Human Development Atlas in Brazil. PNUD; 2013.
20. Lohman T, Roche A, Martorell R. Anthropometric standardization reference manual. Champaign, III, USA: Human Kinetics Book;1988.
21. World Health Organization. WHO child growth standards: length/height-for-age, weight-for-age, weight-for-length, weight-for-height and body mass index-for-age: methods and development. WHO; 2006.
22. World Health Organization. Growth reference data for 5-19 years: body mass index-for-age, length/height-for-age and weight-for-height. WHO; 2007.
23. Associação Brasileira de Empresas de Pesquisa. Critério Brasil: Critério de Classificação Econômica Brasil [Internet]. ABEP; 2008[cited on 2016Oct.]. Available from: http://www.abep.org/criterio-brasil
24. Associação Brasileira de Empresas de Pesquisa. Critério de Classiicação Econômica Brasil [Internet]. ABEP; 2002[cited on 2016Oct.]. Available from: http://www. abep.org/criterio-brasil
25. Muraro AP, Gonçalves-Silva RMV, Ferreira MG, Sichieri R. Efects of social mobility from childhood to adolescence on BMI. Public Health Nutr. 2016 Apr;19(5):814-21.
26. Silva LM, van Rossem L, Jansen PW, Hokken-Koelega AC, Moll HA, Hofman A, et al. Children of low socioeconomic status show accelerated linear growth in early childhood; results from the Generation R Study. PLoS One. 2012;7:e37356.
27. Fitzmaurice GM, Laird NM, James HW. Applied Longitudinal Analysis. Linear mixed efects model. New York: Wiley; 2011.
28. Howe LD, Lawlor DA, Propper C. Trajectories of socioeconomic inequalities in health, behaviours and academic achievement across childhood and adolescence. J Epidemiol Community Health. 2013;67:358-64.
29. Alberman E, Filakti H, Williams S, Evans SJ, Emanuel I. Early inluences on the secular change in adult height between the parents and children of the 1958 birth cohort. Ann Hum Biol. 1991;18:127-36.
30. Power C, Manor O, Li L. Are inequalities in height underestimated by adult social position? Efects of changing social structure and height selection in a cohort study. BMJ. 2002;325:131-4.
32. Lawlor DA, Ebrahim S, Davey Smith G. Adverse socioeconomic position across the lifecourse increases coronary heart disease risk cumulatively: indings from the British women’s heart and health study. J Epidemiol Community Health. 2005;59:785-93.
33. Howe LD, Galobardes B, Matijasevich A, Gordon D, Johnston D, Onwujekwe O, et al. Measuring socio-economic position for epidemiological studies in low- and middle-income countries: a methods of measurement in epidemiology paper. Int J Epidemiol. 2012;41:871-86.
34. Antunes JL. Socioeconomic status and health: a discussion of two paradigms. Rev Saúde Pública. 2008;42:562-7.
35. Monteiro CA, Benicio MH, Conde WL, Konno S, Lovadino AL, Barros AJ, et al. Narrowing socioeconomic inequality in child stunting: the Brazilian experience, 1974-2007. Bull World Health Organ. 2010;88:305-11.
36. Conselho Nacional de Segurança Alimentar e Nutricional. A Segurança Alimentar e Nutricional e o Direito Humano à Alimentação Adequada no Brasil Realização.Brasil: CONSEA;2010.
37. Ritterman ML, Fernald LC, Ozer EJ, Adler NE, Gutierrez JP, Syme SL. Objective and subjective social class gradients for substance use among Mexican adolescents. Soc Sci Med. 2009;68:1843-51.
38. Ritterman Weintraub ML, Fernald LC, Adler N, Bertozzi S, Syme SL. Perceptions of social mobility: development of a new psychosocial indicator associated with adolescent risk behaviors. Front Public Health. 2015;3:62.
39. Goodman E, Amick BC, Rezendes MO, Levine S, Kagan J, Rogers WH, et al. Adolescents’understanding of social class: a comparison of white upper middle class and working class youth. J Adolesc Health. 2000;27:80-3.
40. Jelenkovic A, Ortega-Alonso A, Rose RJ, Kaprio J, Rebato E, Silventoinen K. Genetic and environmental inluences on growth from late childhood to adulthood: a longitudinal study of two Finnish twin cohorts. Am J Hum Biol. 2011;23:764-73.
41. Addo OY, Stein AD, Fall CH, Gigante DP, Guntupalli AM, Horta BL, et al. Maternal height and child growth patterns. J Pediatr. 2013;163:549-54.
42. Galobardes B, McCormack VA, McCarron P, Howe LD, Lynch J, Lawlor DA, et al. Social inequalities in height: persisting differences today depend upon height of the parents. PLoS One. 2012;7:e29118.
43. Muraro AP, Goncalves-Silva RM, Moreira NF, Ferreira MG, Nunes-Freitas AL, Abreu-Villaca Y, et al. Efect of tobacco smoke exposure during pregnancy and preschool age on growth from birth to adolescence: a cohort study. BMC Pediatr. 2014;14:99.
44. Nunes BP, Flores TR, Duro SMS, Saes MO, Tomasi E, Santiago AD, et al. Utilização dos serviços de saúde por adolescentes: estudo transversal de base populacional, Pelotas-RS, 2012. EpidemiolServiços Saúde.2015;24(3):411-20.
Received on: 18/04/2016