363
Original Articles
Factors associated with diabetes among the elderly receiving care at a
specialized gerontology-geriatric outpatient clinic
Roberta de Souza Pereira da Silva Ramos1 Ana Paula de Oliveira Marques2 Vânia Pinheiro Ramos1 Anna Karla de Oliveira Tito Borba3 Avelino Maciel Alves de Aguiar4 Márcia Carréra Campos Leal2
1 Universidade Federal de Pernambuco, Centro de Ciências da Saúde, Programa de Pós-Graduação em
Enfermagem. Recife, PE, Brasil.
2 Universidade Federal de Pernambuco, Departamento de Medicina Social, Programa de Pós-Graduação
em Enfermagem. Recife, PE, Brasil.
3 Universidade Federal de Pernambuco, Departamento de Enfermagem. Recife, PE, Brasil.
4 Universidade Federal de Pernambuco, Departamento de Medicina Social, Programa de Pós-graduação
Integrado em Saúde Coletiva. Recife, PE, Brasil.
Correspondence
Roberta de Souza Pereira da Silva Ramos E-mail: [email protected]
Abstract
Objective: To identify the prevalence of diabetes and its relation to associated factors in elderly persons receiving care at a specialist gerontology-geriatric outpatient service. A descriptive cross-sectional study of 301 elderly persons of both genders was performed. Method: The bivariate analysis was performed using the Pearson’s Chi-square test for Independence and Fisher's exact test, considering 5% of significance and 95% confidence. A multivariate logistic regression model was adjusted to identify factors that may influence the occurrence of diabetes. Result: There was no statistically significant association between the prevalence of diabetes and socioeconomic and demographic variables, behavioral factors and health conditions. Only the Body Mass Index variable was close to being statistically significant (p=0.059). Conclusion: The result confirms the need to develop new studies on the subject to consider the particularities and specificities of the elderly population to enable the creation of educational intervention strategies aimed at this group.
364
InTROduCTIOn
The growth in the proportion of elderly persons has been accompanied by an increase in the prevalence of chronic non-communicable diseases, among which diabetes mellitus stands out for its high morbidity and mortality rates, especially in more advanced age groups1. According to the American College of Cardiolog y Foundation and the American Heart Association, diabetes affects 18% of elderly persons and 50% of type 2 diabetes sufferers are aged over 602.
Diabetes among the elderly is related to an increased risk of premature death, a greater association with other comorbidities, and especially with major geriatric syndromes, including a decline in functional capacity, autonomy and quality of life, making it a high-impact disease, which affects the health system, the family and the elderly person themselves2,3.
It is a highly limiting disease, with long-term consequences that include the damage to, dysfunction and failure of various organs, especially the kidneys, eyes, nerves, heart and blood vessels. People with diabetes are at increased risk of hypertension and coronary, peripheral arterial and cerebrovascular disease, and may also develop neuropathy, arthropathy and autonomic dysfunction, including sexual dysfunction, which more frequently affect the elderly4.
In addit ion, the diabet ic elderly, when compared to non-diabetics, are more likely to be polymedicated, suffer functional loss (difficulty in locomotion, for example), cognitive problems, depression, falls and fractures, urinary incontinence and chronic pain, and should, therefore, be treated in an individualized manner2.
Although diabetes has increased exponentially, there is little comprehensive research that allows epidemiological surveillance of the disease5. Therefore, a study that addresses diabetes mellitus and its associated factors in the elderly would play an important role in the health care of such individuals, supporting the planning of intervention modalities adjusted to the specificities of this population.
The objective of this study was to identify the prevalence of diabetes and its relationship
with associated factors among elderly persons receiving care in a specialized geriatric-gerontology outpatient service.
MeThOd
A cross-sectional descriptive study with a quantitative approach was carried out, involving 301 elderly persons (aged 60 years and over) receiving care at the Núcleo de Atenção ao Idoso (Care Center for the Elderly) (NAI) linked to the Universidade Federal de Pernambuco (Pernambuco Federal University) (UFPE). This is a geriatric-gerontology outpatient service, where individual consultations in various specialties are held and group care is provided through thematic workshops aimed at promoting/ recovering the health of the elderly, with guidance for family members and caregivers. The NAI is considered a subprogram of the Elderly Program, both of which are administered by the Dean’s Office for Extension Studies of UFPE.
The population of the study was 1834 elderly persons and the sample size was calculated based on a prevalence of diabetes in this population of 50%, a confidence level 95% and a sample error of 0.05.
A database was created in a statistical program and the elderly were selected by means of proportional sampling stratified by gender, with individuals selected by systematic draw, with the aim of obtaining more accurate estimates and reducing the possibility of selection bias. The elderly were randomly selected to participate in the survey by phone and losses were replaced by the drawing of replacements.
365 Three students from the nursing undergraduate
course at UFPE, linked to the extension project entitled: Systematized Nursing Care for the Elderly Receiving Care From A Geronto-Geriatric Service helped with the interviews. All the students received prior-training for the carrying out of the interview script and the application of the scales used.
The dependent variable of this study was experience or not of diabetes according to the medical diagnosis on the patient's medical record. The independent variables were a) socioeconomic and demographic (age, gender, ethnicity/skin color, marital status, schooling, social security status, individual income, contribution to household income and living arrangement); B) health conditions; C) behavioral factors related to health (habits of consumption of alcohol, smoking habits, practice of regular physical activity and nutritional status).
Based on the proposal of the SABE project (Saúde, bem-estar e envelhecimento, or Health, Well-being and Aging) project coordinated by the Pan American Health Organization, the measure of self-rated health was categorized as excellent, very good and good, to indicate a good self-perception of health; and regular and poor, to refer to a poor self-perception6.
Functional capacity was evaluated by applying the Basic Activities of Daily Living Scale (BADL) (Katz Scale), which evaluated the functional independence of the elderly in the performance of six functions (bathing, dressing, going to the bathroom, transference, continence, and feeding) and the Instrumental Activities of Daily Living Scale (IADL) (Lawton Scale), which classified the elderly as independent or dependent in performing nine functions (ability to use telephone, using transportation, shopping, preparing their own meal, housekeeping, doing household chores, washing and ironing their clothes, taking their medicines properly and taking care of their finances)7,8.
As cut-off points, the proposal of the Hartford Institute for Geriatric Nursing was adopted for the Katz Scale, with the elderly categorized as independent, moderately dependent, and highly dependent, based on scores of 6 points, between
3 and 5 points, and 2 points or less, respectively. For the Lawton Scale, categorization was based on the following score: total dependence (up to 9 points), partial dependence (10 to 18 points) and independence (from 19 to 27 points)8.
In relation to the behavioral factors, the practice of physical activity was evaluated through the application of an adapted script of the International Physical Activity Questionnaire (IPAQ) in its short version, validated in Brazil9, with the elderly being classified as very active, active, irregularly active or sedentary individuals, based on compliance with recommendations regarding the frequency and duration of the activities.
Nutritional state was diagnosed using the body mass index (BMI) (BMI = P/A²) where individuals were classified according to the following cutoff points recommended for the elderly: underweight (<22kg/m2), normal weight (22≤BMI≤27kg /m2) and overweight (>27kg/m2)10. BMI was calculated from weight and height data measured at the time of the interview.
The association between the independent variables and the presence of diabetes was examined by bivariate analysis using Pearson's Chi-squared test of independence or the Fisher Exact test, with the latter used when the results did not meet the requirements for the first test. A significance level of 5% and 95% confidence intervals were used in both cases. For the comparison between two categories with numerical variables, the T-student test with equal variances was used. Verification of the equality of variance hypothesis was performed using the Levene F test.
366
diabetes were estimated according to the independent variables and confidence intervals for said parameter.
The research protocol was approved by the Research Ethics Committee of the Centro de Ciências Saúde of the Universidade Federal de Pernambuco (CAEE 0486.0.172.000-10) (the Center of Health Science of the Federal University of Pernambuco). The elderly persons interviewed signed or fingerprinted a Free and Informed Consent Form, in which the objectives of the research were explained, guaranteeing the confidentiality of the information obtained.
ReSuLTS
Of the 301 elderly persons interviewed, 221 (73.4%) were female. The mean age was 70.16 years; the majority, 162 (53.8%), were in the 60-69 age group with a median of 69.00 years, a standard deviation of 6.41 years and a coefficient of variation of 9.13%. The prevalence of diabetes obtained from the medical records of all the elderly people who composed the sample was 28.2%. This prevalence was higher among men (35%) than among women (25.8%), but there was no significant difference between the sexes (p = 0.117) (Table 1).
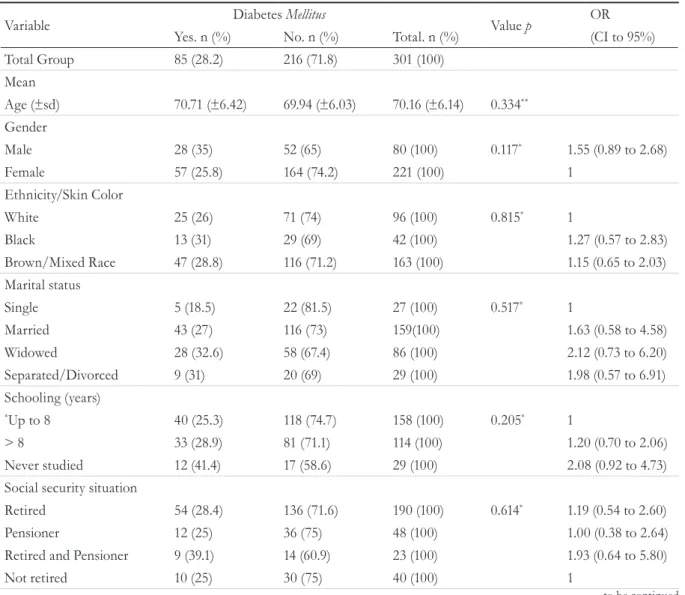
Table 1. Prevalence of diabetes among elderly persons receiving care at a geriatric-gerontology service according to socioeconomic and demographic factors. Recife, Pernambuco, 2012.
Variable Diabetes Mellitus Value p OR
Yes. n (%) No. n (%) Total. n (%) (CI to 95%) Total Group 85 (28.2) 216 (71.8) 301 (100)
Mean
Age (±sd) 70.71 (±6.42) 69.94 (±6.03) 70.16 (±6.14) 0.334**
Gender
Male 28 (35) 52 (65) 80 (100) 0.117* 1.55 (0.89 to 2.68)
Female 57 (25.8) 164 (74.2) 221 (100) 1
Ethnicity/Skin Color
White 25 (26) 71 (74) 96 (100) 0.815* 1
Black 13 (31) 29 (69) 42 (100) 1.27 (0.57 to 2.83)
Brown/Mixed Race 47 (28.8) 116 (71.2) 163 (100) 1.15 (0.65 to 2.03) Marital status
Single 5 (18.5) 22 (81.5) 27 (100) 0.517* 1
Married 43 (27) 116 (73) 159(100) 1.63 (0.58 to 4.58)
Widowed 28 (32.6) 58 (67.4) 86 (100) 2.12 (0.73 to 6.20)
Separated/Divorced 9 (31) 20 (69) 29 (100) 1.98 (0.57 to 6.91) Schooling (years)
*Up to 8 40 (25.3) 118 (74.7) 158 (100) 0.205* 1
> 8 33 (28.9) 81 (71.1) 114 (100) 1.20 (0.70 to 2.06)
Never studied 12 (41.4) 17 (58.6) 29 (100) 2.08 (0.92 to 4.73) Social security situation
Retired 54 (28.4) 136 (71.6) 190 (100) 0.614* 1.19 (0.54 to 2.60)
Pensioner 12 (25) 36 (75) 48 (100) 1.00 (0.38 to 2.64)
Retired and Pensioner 9 (39.1) 14 (60.9) 23 (100) 1.93 (0.64 to 5.80)
Not retired 10 (25) 30 (75) 40 (100) 1
367 Continued from Table 1
Variable Diabetes Mellitus Value p OR
Yes. n (%) No. n (%) Total. n (%) (CI to 95%) Individual income (minimum salary)
<1 12 (40) 18 (60) 30 (100) 0.250* 3.17 (0.86 to 11.65)
≥1 ≤ 2 47 (28.1) 120(71.9) 167 (100) 1.86 (0.60 to 5.76)
>2 < 4 12 (22.2) 42 (77.8) 54 (100) 1.36 (0.39 to 4.76)
≥4 10 (37) 17 (63) 27 (100) 2.79 (0.74 to 10.58)
No income 4 (17.4) 19 (82.6) 23 (100) 1
Contribution to household upkeep
Total 47 (33.1) 95 (66.9) 142 (100) 0.130* 2.47 (0.89 to 6.87)
Partial 33 (25.6) 96 (74.4) 129 (100) 1.72 (0.61 to 4.86)
Does not contribute 5 (16.7) 25 (83.3) 30 (100) 1 Living arrangements
Spouse only 16 (26.2) 45 (73.8) 61 (100) 0.744* 1
Relatives 25 (26.9) 68 (73.1) 93 (100) 1.03 (0.50 to 2.15) Spouse and relatives 27 (27.6) 71 (72.4) 98 (100) 1.07 (0.52 to 2.20) Lives alone 17 (34.7) 32 (65.3) 49 (100) 1.49 (0.66 to 3.39)
*Pearson Chi-Squared Test; **Fisher’s Exact Test.
In terms of socioeconomic and demographic characterization, the majority of the elderly were mixed race/brown-skinned, 163 (54.2%); married, 159 (52.8%); retirees, 190 (63.15%); had up to 8 years of study, 158 (52.5%); earned between one and two minimum wages 167 (55.5%); and contributed totally or partially to the upkeep of the house, 271 (90.1%). Concerning living arrangements, the greatest percentage of elderly persons reported living with a spouse and family members, 98 (32.6%), followed by those who lived only with relatives, 93 (30.9%); however, 49 (16.3%) of the sample reported living alone.
There was no statistically significant association between the socioeconomic and demographic variables (Table 1) and the only variables with p<0.20 were: gender and contribution to household upkeep. For these variables, it was observed that the odds ratio of having diabetes was 1.55 times greater in men than in women and 2.47 times and 1.72 times greater in elderly people who contributed totally and partially, respectively, to the upkeep of the house, in comparison with those who did not contribute.
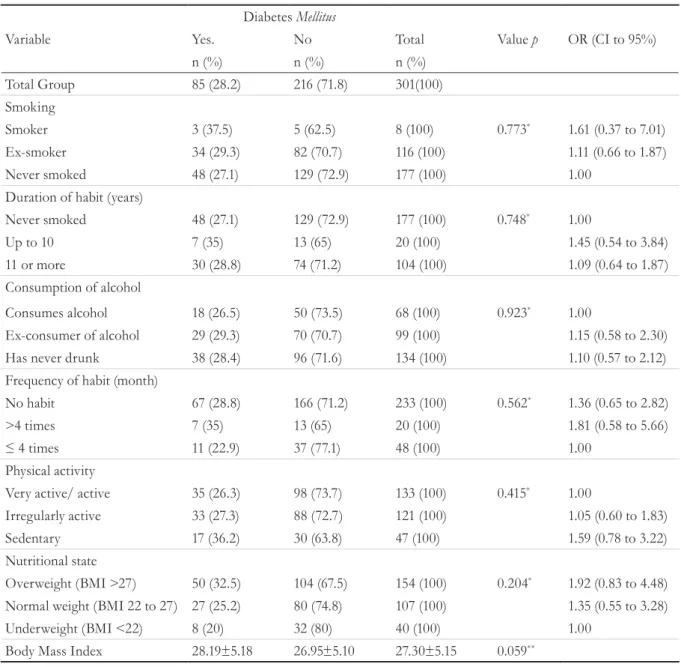
Regarding health-related behavioral factors (Table 2), only the variable BMI, analyzed numerically, was close to statistical significance in the bivariate
analysis (p=0.059) (Table 2). For this variable, mean BMI was higher among those who were diabetic (28.19kg/m2) when compared to the mean of non-diabetic patients (26.95kg/m2).
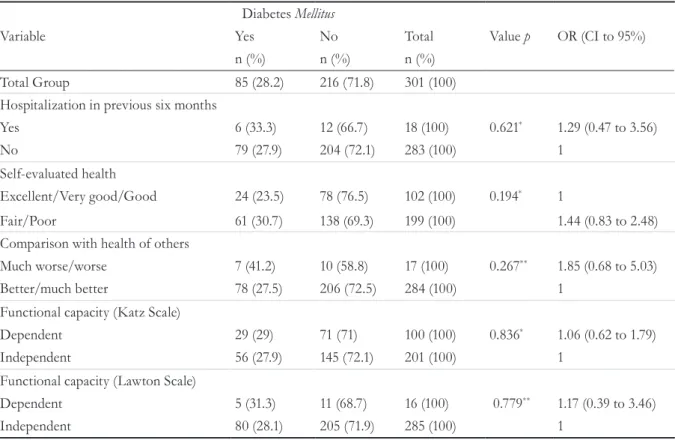
Regarding variables related to health conditions (Table 3), the only one with p<0.20 was self-rated health, where the prevalence of elderly people with diabetes was 7.2% higher among those who self-rated their health as fair/poor than among those who considered it as excellent, very good or good. Although not statistically significant, the prevalence of diabetes was higher among the elderly who considered their health worse/much worse than other people of the same age (41.2%) when compared to those who considered their health "better/much better" (27.5%).
368
The variable BMI variable, when analyzed in the logistic regression model, remained close to being significantly associated with diabetes (p=0.076) (Table 4), as for each point BMI that increased, the
Table 2. Prevalence of diabetes according to behavioral factors linked to the health of elderly persons receiving care at a geriatric-gerontology service. Recife, Pernambuco, 2012.
Diabetes Mellitus
Variable Yes. No Total Value p OR (CI to 95%)
n (%) n (%) n (%)
Total Group 85 (28.2) 216 (71.8) 301(100) Smoking
Smoker 3 (37.5) 5 (62.5) 8 (100) 0.773* 1.61 (0.37 to 7.01)
Ex-smoker 34 (29.3) 82 (70.7) 116 (100) 1.11 (0.66 to 1.87)
Never smoked 48 (27.1) 129 (72.9) 177 (100) 1.00
Duration of habit (years)
Never smoked 48 (27.1) 129 (72.9) 177 (100) 0.748* 1.00
Up to 10 7 (35) 13 (65) 20 (100) 1.45 (0.54 to 3.84)
11 or more 30 (28.8) 74 (71.2) 104 (100) 1.09 (0.64 to 1.87) Consumption of alcohol
Consumes alcohol 18 (26.5) 50 (73.5) 68 (100) 0.923* 1.00
Ex-consumer of alcohol 29 (29.3) 70 (70.7) 99 (100) 1.15 (0.58 to 2.30) Has never drunk 38 (28.4) 96 (71.6) 134 (100) 1.10 (0.57 to 2.12) Frequency of habit (month)
No habit 67 (28.8) 166 (71.2) 233 (100) 0.562* 1.36 (0.65 to 2.82)
>4 times 7 (35) 13 (65) 20 (100) 1.81 (0.58 to 5.66)
≤ 4 times 11 (22.9) 37 (77.1) 48 (100) 1.00
Physical activity
Very active/ active 35 (26.3) 98 (73.7) 133 (100) 0.415* 1.00
Irregularly active 33 (27.3) 88 (72.7) 121 (100) 1.05 (0.60 to 1.83) Sedentary 17 (36.2) 30 (63.8) 47 (100) 1.59 (0.78 to 3.22) Nutritional state
Overweight (BMI >27) 50 (32.5) 104 (67.5) 154 (100) 0.204* 1.92 (0.83 to 4.48)
Normal weight (BMI 22 to 27) 27 (25.2) 80 (74.8) 107 (100) 1.35 (0.55 to 3.28) Underweight (BMI <22) 8 (20) 32 (80) 40 (100) 1.00
Body Mass Index 28.19±5.18 26.95±5.10 27.30±5.15 0.059**
* Pearson’s Chi-squared Test; ** Fisher’s Exact Test.
369
Table 3. Prevalence of diabetes according to health condition of elderly persons receiving care at a geriatric-gerontology service. Recife, Pernambuco, 2012.
Diabetes Mellitus
Variable Yes No Total Value p OR (CI to 95%)
n (%) n (%) n (%) Total Group 85 (28.2) 216 (71.8) 301 (100) Hospitalization in previous six months
Yes 6 (33.3) 12 (66.7) 18 (100) 0.621* 1.29 (0.47 to 3.56)
No 79 (27.9) 204 (72.1) 283 (100) 1
Self-evaluated health
Excellent/Very good/Good 24 (23.5) 78 (76.5) 102 (100) 0.194* 1
Fair/Poor 61 (30.7) 138 (69.3) 199 (100) 1.44 (0.83 to 2.48) Comparison with health of others
Much worse/worse 7 (41.2) 10 (58.8) 17 (100) 0.267** 1.85 (0.68 to 5.03)
Better/much better 78 (27.5) 206 (72.5) 284 (100) 1 Functional capacity (Katz Scale)
Dependent 29 (29) 71 (71) 100 (100) 0.836* 1.06 (0.62 to 1.79)
Independent 56 (27.9) 145 (72.1) 201 (100) 1
Functional capacity (Lawton Scale)
Dependent 5 (31.3) 11 (68.7) 16 (100) 0.779** 1.17 (0.39 to 3.46)
Independent 80 (28.1) 205 (71.9) 285 (100) 1
* Pearson’s Chi-squared Test; **Fisher’s Exact Test.
Table 4. Logistic regression of prevalence of diabetes according to independent variables among elderly persons receiving care at a geriatric-gerontology service. Recife, Pernambuco, 2012.
OR (CI 95%)
Variable Univariate Adjusted for model p value
Gender
Male 1.55 (0.89 to 2.68) 1.37 (0.75 to 2.50) 0.301
Female 1.00 1.00
Age 1.02 (0.98 to 1.06) 1.00 (0.95 to 1.05) 0.985*
Study (years)
Up to 8 1.00 1.00
More than 8 1.20 (0.70 to 2.06) 1.28 (0.70 to 2.36) 0.479*
Never studied 2.08 (0.92 to 4.73) 1.61 (0.67 to 3.84) Income (minimum salary)
<1 3.17 (0.86 to 11.65) 1.11 (0.09 to 13.18) 0.381*
1 to 2 1.86 (0.60 to 5.76) 0.61 (0.04 to 7.61) >2 to 4 1.36 (0.39 to 4.76) 0.39 (0.03 to 5.27) >4 2.79 (0.74 to 10.58) 0.83 (0.06 to 11.77)
No income 1.00 1.00
Contribution to household upkeep
Yes, total 2.47 (0.89 to 6.87) 3.90 (0.40 to 38.01) 0.272*
Yes, partial 1.72 (0.61 to 4.86) 2.67 (0.28 to 25.49)
Does not contribute 1.00 1.00
370
dISCuSSIOn
In the present study, the prevalence of diabetes among the 301 elderly people who composed the sample was 28.2%. A lower prevalence (15.4%) was found in an epidemiological study carried out with 60 years and older elderly individuals receiving care in the outpatient service of a public hospital3 and in a study which was part of the Health Surveys of the State of São Paulo (ISA-SP), which found a prevalence of 17.6%5.
Data from the 2013 Sistema de Vigilância de Fatores de Risco e Proteção para Doenças Crônicas por Inquérito Telefônico (the Surveillance System for Risk Factors and Protection for Chronic Diseases by Telephone Inquiry) (VIGITEL) showed a frequency of prior medical diagnosis of diabetes for the adult population of the Brazilian capitals and the Distrito Federal of 6.9%11. The high prevalence found in the present study can be explained by the average age of the elderly participants, since in both genders the disease becomes more common with the advancing age11,12.
In terms of the demographic variables, the ISA-SP5 project found a statistically significant association between the prevalence of diabetes and marital status, and no significant association with any other demographic variable studied, corroborating the findings of the present study. It is worth noting, however, that while no statistical association was found, the study identified an increase in the prevalence of the disease with increasing age.
Regarding behavioral factors related to health, no significance was observed for the variables smoking
and alcohol consumption, or their frequencies. Similar data regarding smoking were found in another study3. In a study related to the ISA-SP5 Project, significance was found in the variable frequency of alcohol consumption, but this was not the case when alcoholism was evaluated through the CAGE questionnaire, an instrument validated in Brazil since 1983, which is based on four questions (Cut-down, Annoyed By Criticisms, Guilty and Eye-Opener)13.
Although scientific literature affirms the interference of the practice of physical activity on the prevalence of diabetes, this variable was not statistically significant in the present study even when adjusted for the logistic regression model (p=0.799). Despite this, it was observed that the proportion of those who have diabetes compared with those who do not was substantially higher in the group of elderly persons classified as sedentary (36.2%) with a 10% greater percentage than those classified as very active and/or active (26.3%) and irregularly active (27.3%).
A systematic review carried out from 1994 to 2006 analyzed published information on the adherence and motivation of people with diabetes mellitus participating in health programs aimed at stimulating the adoption of a healthy lifestyle. This review reinforced the theory that the practice of exercise is a coadjuvant in the prevention or delay of clinical manifestations of type 2 diabetes, but also described some of the behavioral and emotional difficulties that may influence the adherence of the diabetic elderly to the prescribed treatment14.
In another systematic review that described a protocol of physical exercises for the primary care of type 2 diabetes, it was observed that the benefits
Self-rated health
Excellent/ Very good/ Good 1.00
Fair/ Poor 1.44 (0.83 to 2.48) 1.32 (0.72 to 2.40) 0.368*
Regular physical activity
Very active/active 1.00 1.00
Irregularly active 1.05 (0.60 to 1.83) 0.96 (0.53 to 1.72) 0.799(**)
Sedentary 1.59 (0.78 to 3.22) 1.24 (0.57 to 2.72)
Body Mass Index 1.05 (1.00 to 1.10) 1.05 (1.00 to 1.11) 0.071**
371 of exercise for disease are more visible when they
are aerobic and resistance exercises, performed with moderate to high intensity, recommendations which were not found among the elderly participants of this study15.
Also, according to this review, such exercises must use up to 80% of the maximum heart rate for aerobic training and up to 85% of a maximum repetition for resistance exercises for the exercise program to be classed as moderate and/or high intensity14. In the present study, physical activity was investigated considering the frequency and time spent in the performance of such activity, not taking into account characteristics such as type of exercise, systematization, intensity and specificity.
Thus, the statistical non-association between the prevalence of diabetes and the practice of physical activity found in this study can be explained by the fact that the activities cited by the elderly investigated are more related to walking for leisure and transportation purposes and for domestic tasks. The majority did not participate in a physical exercise program, and therefore did not perform systematically prescribed physical activities, which have well-established duration and intensity, in a specific manner.
Another important factor is that the group of professionals in the Elderly Care Center where the elderly participants of this study received care did not contain a physical educator. Therefore, counseling regarding the practice of exercise as an element of support for diabetes treatment was not very effective. Another study on the prevalence of diabetes and its associated factors also showed a similar finding5.
In terms of nutritional status, based on a cutoff point for overweight of BMI>27kg/m2, which is recommended for the elderly and takes into account the changes in body composition due to aging, such as bone, muscle and body water decrease, as well as the increase and redistribution of fat11, no significant statistical association was observed in the bivariate analysis (p=0.204). When the BMI variable was analyzed continuously, it was around the level of significance (p=0.059), and remained close to an association with the prevalence of diabetes when adjusted for the logistic regression model (p= 0.076).
In contrast to this result, other cross-sectional epidemiological studies performed with the elderly population have found a statistically significant association between the presence of self-reported diabetes and body mass index16,17. It should be noted that in the present study the anthropometric parameters used for the calculation of BMI were measured at the time of the interview and self-reported data were not used, as these may be compromised by forgetfulness bias.
Although the association between obesity and the increased chance of developing diabetes is clearly identified in scientific literature18, the present study did not identify this association. It is important to note, however, that the sample of elderly diabetics may have been underestimated due to a lack of the registration of the diagnosis of the disease in the medical records of the elderly.
Another important aspect observed was that as the average age of the elderly investigated was high, this non-association suggests the interference of obesity and associated pathologies as factors that may be contributing to the greater premature mortality of the obese elderly. This relationship, however, could not be proven because the present study did not address the presence of diseases other than diabetes.
An interesting finding of this research is that, despite the functional limitations and organ dysfunction that diabetes can cause3, approximately one-quarter of the elderly diabetics (23.5%) self-rated their health as excellent, very good or good. This finding may be related to the fact that the elderly receive care at a service that offers weekly specialized professional care, involving educational practices aimed at the diabetic patient.
It is also worth noting that most of the diabetic elderly investigated were asymptomatic and did not have any reported complications. Nonetheless, it is known that chronic non-transmissible diseases have a significant impact on quality of life, with a direct influence on the self-assessment of health19.
372
of non-diabetic elderly patients evaluated their health as better or much better (72.5%), while the largest group of diabetics described their health as much worse or worse (41.2%), although this difference was not significant.
In terms of the assessment of functional capacity, while this variable was not associated with diabetes in this study, even when the logistic regression model was adjusted, the prevalence of the disease was greater among the elderly classified as dependent by the two scales used to measure this variable (Katz and Lawton). The classification of independence was higher among the non-diabetic elderly, also using the Katz (72.1%) and Lawton (71.9%) scales.
A study that used the same indexes found that most of the elderly had some degree of disability in the performance of instrumental activities, but were more independent in activities of daily living. However, corroborating these findings, this disability was not significantly associated with type 2 diabetes mellitus, and is therefore an occurrence connected to the aging process and the presence of other morbidities20.
In contrast, another cross-sectional study showed that diabetes was associated with a twofold increase in the risk of disability in the performance of activities of daily living when compared with individuals without the disease, and that this limitation could reduce social interaction and interfere with the sense of well-being21.
The present study measured the functional capacity of the elderly in a single moment, which may have compromised the evaluation of the relationship between functional decline and the presence of chronic noncommunicable diseases, which has been observed over years of follow-up3. It is also worth mentioning that, in this study, the elderly individuals drawn to make up the sample were invited to the outpatient service to participate in the study, which may have contributed to a possible selection bias, considering that those with some type of functional impairment may not have accepted such an invitation because of difficulty in moving around.
COnCLuSIOnS
Although the variables studied were not found to be statistically significant, the results obtained in this study demonstrate the importance of using them in gerontological studies that address diabetes. New studies on the subject which consider the particularities and specificities of the elderly public, minimizing bias and maximizing the veracity of the results found, are required.
In this way, it will be possible to create educational intervention strategies adjusted to enable diabetic elderly persons to maximize self-care, thus contributing to the promotion of autonomy and improvement of the quality of life.
RefeRenCeS
1. Mooradian AD, Chehade JM. Diabetes Mellitus in OlderAdults. Am J Ther. 2012; 19(2): 145-59.
2. Sociedade Brasileira de Diabetes. Diretrizes da Sociedade Brasileira de Diabetes. São Paulo: SBD; 2014.
3. Francisco PMSB, Belon AP, Barros MBA, Carandina L, Alves MCGP, Goldbaum M. Diabetes auto-referido em idosos: prevalência, fatores associados e práticas de controle. Cad Saúde Pública. 2010;26(1):175-84.
4. Silva TR, Feldman C, Lima MHA, Nobre MRC, Domingues RZL. Controle de diabetes mellitus e hipertensão arterial com grupos de intervenção educacional e terapêutica em seguimento ambulatorial de uma unidade Básica de saúde. Saúde Soc.
2006;15(3):180-9.
5. Mendes TAB, Goldbaum M, Segri NJ, Barros MBA, Cesar CLG, Carandina L, et al. Diabetes mellitus: fatores associados à prevalência em idosos, medidas e práticas de controle e uso dos serviços de saúde em São Paulo, Brasil. Cad Saúde Pública. 2011;27(6):1233-43.
6. Lebrão ML, Laurenti R. Saúde, bem-estar e
envelhecimento: o estudo SABE no município de São Paulo. Rev Bras Epidemiol. 2005;8(2):127-41.
373
Received: June 21, 2016 Reviewed: January 16, 2017 Accepted: April 24, 2017
8. Lawton MP, Brody EM. Assessment of older people: self-maintaining and instrumental activities of daily living. Gerontologist.1969;9(3):179-86.
9. Matsudo S, Araujo T, Matsudo V, Andrade D, Andrade E, Oliveira LC, et al. Questionário Internacional de Atividade Física (IPAQ): estudo de validade e reprodutibilidade no Brasil. RevBras Ativ Fís Saúde. 2001;6(2):5-18.
10. LipschitzDA.Screening for nutritionalstatus in the elderly.Prim Care. 1994; 21(1):55-67.
11. Brasil. Ministério da Saúde, Secretaria de Vigilân cia em Saúde. Vigitel Brasil 2013:vigilância de fatores de risco e proteção para doenças crônicas por inquérito telefônico. Brasília, DF: MS; 2014.
12. Dias JCR, Campos JADB. Diabetes mellitus: razão de prevalências nas diferentes regiões geográficas no Brasil, 2002 – 2007. Ciênc SaúdeColetiva. 2012;17(1):239-44.
13. Masur J, Monteiro M. Validation of the CAGE alcoholism screening test in Brazilian Psychiatry inpatient hospital setting.JBiol Res.1983;16:215-8.
14. Costa JA, Balga RSM, Alfenas RCG, Cotta RMM. Promoção da saúde e diabetes: discutindo a adesão e a motivação de indivíduos diabéticos participantes de programas de saúde. Ciênc Saúde Coletiva [Internet]. 2011 [acesso em09 ago.2017];16(3):2001-9. Disponível em:http://www.scielo.br/scielo. php?script=sci_arttext&pid=S141381232011000300 034&lng=en.
15. Bernardini AO, Manda RM, Burini RC.
Características do protocolo de exercícios físicos para atenção primária ao diabetes tipo 2. RevBras Ciênc Mov. 2010;18(3):99-107.
16. Prado MAMB, Francisco PMSB, Barros MBA. Diabetes em idosos: uso de medicamentos e risco de interação medicamentosa. Ciênc Saúde Coletiva. 2016;21(11):3447-58.
17. Vitoli NC, Fogal AS, Nascimento CM, Franceschini SCC, Ribeiro AQ. Prevalência e fatores associados ao diabetes em idosos no município de Viçosa, Minas Gerais. Rev Bras Epidemiol. 2015;18(4):953-65.
18. Eckel RH, Kahn SE, Ferrannini E, Goldfine AB, Nathan DM, Schwartz MW, Smith SR. Obesity and type 2 diabetes: what can be unified and what needs to be individualized? J Clin Endocrinol Metab. 2011;96(6):1654-63. doi: 10.1210/jc.2011-0585.
19. Latham K, Peek CW. Self-rated health and morbidity onset among late midlife U.S. adults. JGerontol Ser B Psy cholSciSocSci.2012;68(1):107-16.
20. Rodrigues LS, Formiga LMF, Luz GOA, Macedo CTNG, Brito BB. Avaliação da capacidade funcional em idosos com diabetes melittus tipo 2 em Picos-Piauí.Rev Interdiscipl. 2013;6(3):115-22.