340
Original Articles
Subjective and psychological well-being among elderly participants of
a University of the Third Age
Meire Cachioni1 Lais Lopes Delfino2 Mônica Sanches Yassuda1 Samila Sathler Tavares Batistoni1 Ruth Caldeira de Melo1 Marisa Accioly Rodrigues da Costa Domingues1
1 Universidade de São Paulo, Escola de Artes, Ciências e Humanidades. São Paulo, SP, Brasil.
2 Universidade Estadual de Campinas, Faculdade de Ciências Medicas, Programa de Pós Graduação em
Gerontologia. Campinas, SP, Brasil.
Correspondence Meire Cachioni E-mail: [email protected]
Abstract
Objective: The present study aimed to analyze the distribution of measures of subjective and psychological well-being according to demographic criteria and length of participation in the program. Method: A cross sectional study using the following instruments was carried out: a sociodemographic questionnaire (age, gender, education, length of participation in University of the Third Age (U3A) and similar programs located in the city of São Paulo, Brazil; an Overall Life Satisfaction Scale; a Life Satisfaction Scale that contemplated four domains: health, physical capacity, mental capacity and social involvement; a Positive/ Negative Affect Scale; and a Personal Development Scale. The data were analyzed by the chi-squared test (for comparison of categorical variables), the Mann-Whitney and the Kruskal-Wallis U tests (for comparison of continuous variables). Results: Age and gender were the main factors that were significantly associated with overall life satisfaction, life satisfaction in specific domains, and morale. Higher education was associated with psychological adjustment. Conclusion: Participating in a U3A contributes to high levels of subjective and psychological well-being. Elderly individuals of more advanced ages and men had higher rates of satisfaction with life and positive feelings. The elderly can assess their development trajectory, their commitment to society and consider their efforts in pursuing an ideal of personal excellence.
341
INTRODUCTION
The early 1960s saw major ideological changes in the field of gerontology. Old age and aging were no longer synonymous with disease, inactivity, and a general contraction in development. Since this time, gerontology has also investigated the positive aspects of old age, based on the view that it is possible to maintain well-being and quality of life
even at advanced ages1. It was in this context that
the term successful old age emerged, which includes among its several associated concepts those related to psychological well-being – positive mental health, which includes self-acceptance, mastery over one’s environment, positive relationships with others,
purpose, personal growth and autonomy2 – and to
subjective well-being – general satisfaction with life and specific domains of functioning, such as health and social relationships, activity, social integration,
sense of control, and sense of meaning of existence3.
The study of subjective well-being (SWB) seeks to understand people's assessment of their lives and has flourished with the growing recognition of the importance of subjectivity in assessing what makes life good and desirable. According to Diener and
Louis4, the indicators of SWB are satisfaction with
life, positive and negative emotions. Emotions refer to the evaluation of SWB by affective criteria and are relatively less stable than satisfaction. The satisfaction with life dimension is the cognitive judgment of a specific domain in a person's life; an assessment of life according to one’s own criteria. The judgment of satisfaction depends on a comparison between the individual's life circumstances and a standard
chosen by the individual themselves5.
In the late 1980s, the significant amount of research on SWB, mainly by scholars from various fields of psychology, resulted in a crisis in defining the concept and a subdivision into subjective well-being and psychological well-well-being. In this same period, the North American psychologist Carol Ryff presented critical studies on the construct in the field of psychology. For this author, the perspective of well-being that translates to happiness and that which translates to personal excellence belong to different domains and must be analyzed based on
different philosophical perspectives2,6.
According to Ryff6, an alternat ive and
multidimensional model of psychological well-being (PWB), derived from theoretical and empirical discussions, encompasses six components: a) the meaning, purpose and direction people give to their lives; b) living according to their own personal convictions (autonomy); c) using their personal talents and their potential (personal growth); d) managing life situations (mastery over one’s environment); e) maintaining deep and meaningful ties with others (positive relationships), and f ) self-knowledge, including awareness of personal limitations (self-acceptance).
The last few decades have witnessed major advances in the psychology of aging and intriguing discoveries regarding the well-being of individuals experiencing the final stage of life. Unpublished findings based on the perspective of lifespan (development throughout life) have generated new insights into the dynamics of well-being throughout life and on the factors that influence its maintenance or decline in old age. One of the most interesting findings was synthetically denominated in the 1990s
as the "well-being paradox"7. This paradox brings
together data showing that in old age SWB and the sense of maturity, or PWB, do not seem to decline despite the challenges and losses associated with age, and gains or increases in these indicators can
be maintained8,9.
Data from the English Longitudinal Study of Ageing (ELSA) show that the elderly have higher levels of SWB than middle-aged adults. Life satisfaction is greatest in older groups especially when controlled for marital status and health. The authors conclude that these results are probably due to the adaptive nature of the SWB assessment measures, showing that even in the face of declining health, the elderly become more satisfied and happier
with their situation than when they were younger10.
342
others, and to select social partners who represent an opportunity for emotional comfort (rather than information and status, which are typical themes of
youth and adult life)11.
It is known that for the elderly, social contacts are motivated by events that provide well-being and meaningful social interactions which offer emotional support. Regularly maintained social contacts are those that possess greater significance as mediators of social support. In this perspective, the promotion of educational programs aimed at this age segment stands out. Such programs have an important role to play in the establishment of SWB for the elderly, since they can provide physical and mental activities, meaning and satisfaction with existence, both through the commitment and social responsibility implicit within them, and the opportunity to acquire
and update knowledge and maintain a social life12.
In view of results previously published in literature, the present study aimed to verify indicators of subjective well-being and psychological well-being among elderly students attending the Universidade Aberta à Terceira Idade da Escola de Artes, Ciências e Humanidades (the Open University of the Third Age of the School of Arts, Sciences and Humanities) (UnATI EACH). The emphasis on well-being was aimed at describing the sample of elderly people according to sociodemographic criteria (age, gender, schooling) and time of participation in the UnATI EACH and other programs of this type.
METHOD
A cross-sectional study was performed. All the students enrolled in the UnATI EACH who could read and write were included, while the elderly with cognitive deficits suggestive of dementia and/or those with severe hearing or vision deficits, making communication and comprehension difficult, were excluded. The total number of students enrolled was 307, and when the inclusion and exclusion criteria were applied, the sample corresponded to 265 elderly people.
After public disclosure of the approval of the research project, the stages of the study were defined by six professors from the Bachelor's Degree in Gerontology of the EACH who established the
research protocol, with one senior individual responsible for the entire process, from the creation of the research plan to the implementation of the entire schedule established by the partnership agreement. These six professors trained 20 students who agreed to act as research assistants.
Of these 20 research assistants, three students from the previous semester with the most experience were appointed as tutors of the others.
Instruments validated for the Brazilian elderly population were used, selecting the psychosocial variables of interest related to SWB and PWB:
Sociodemographic data
a) The independent variables age, gender and schooling; B) The time of participation in UnATI EACH; C) Participation in other Universities for the Third Age (U3A) or Social Centers.
SWB Measures
a) Scale for the measurement of Overall Satisfaction with Life: single item scale that asks for the evaluation of this condition on a scale of 1 to 10, presented graphically (1=the worst life and 10=the best life); b) instrument for the measurement of Satisfaction with Life based on three domains: health and physical capacity, mental capacity and social involvement. Assessment is based on a five-point scale ranging from very unsatisfied to very satisfied; c) Positive and Negative Affect Schedule (PANAS): on a scale ranging from 1 (not at all) to 5 (very much), the subject is asked to evaluate their positive mood, composed of six expressions (happy, cheerful, excited, well, satisfied, contented) and their negative mood, indicated by eight expressions (irritated, demotivated, distressed, depressed, upset, nervous, sad, discouraged).
Measures of PWB
The Personal Development Scale (PDS), originally, contained 18 items corresponding to
343
positive relations with others, personal growth, self-acceptance, autonomy, purpose in life and environmental mastery, and 12 items corresponding to three domains of generability - create, maintain and offer. Each item is rated by a five-point scale (1-very little, 2-little, 3-fair, 4-much, 5-very much). A methodological study of the instrument revealed a factorial structure containing five factors composed of 25 items, which explained 54.04% of total variability. These factors were denominated: self-realization, personal growth and psychological adjustment (Factor 1); Productivity (Factor 2); Care (Factor 3); Concern for the next generations (Factor 4) and Commitment to others (Factor 5). Analysis of the internal reliability of the scale as a whole and of each of the factors resulted in satisfactory scores for
the total scale (α=0.90) and for Factors 1 (α=0.89), 2 (α=0.72), 3 (α=0.67), 4 (α= 0.68) and 5 (α=0.64).
The chi-square test was used to compare the categorical variables, and when there were three categories or more to be analyzed, the chi-square test for multiple samples was used. The Kolmogorov-Smirnov test identified the absence of normal distribution of the continuous variables which therefore required non-parametric tests. Therefore, the Mann-Whitney and Kruskall-Wallis U-tests, respectively, were used to compare the continuous variables between two or three groups. In the Kruskal-Wallis test, the multiple comparison test (Multiple Comparisons z' values) was used when a
p-value <0.05 was obtained.
The level of significance adopted for the statistical
tests was 5%, resulting in a p-value<0.05.
The research plan was approved by the Ethics Research Committee of the Instituto de Psicologia of the Universidade de São Paulo (the Psychology Institute of the University of São Paulo), under approval number 2010.043. The subjects agreed to participate by signing a Free and Informed Consent
Form. The present study complied with Resolution nº 196/96 on Regulatory Directives and Guidelines on Research involving Human Beings.
RESULTS
Table 1 shows that men scored higher than women in the health (mean= 3.90, sd±0.72) and mental (mean = 4.05; sd ± 0.77) domains of the Domain Related Satisfaction Scale. They also presented an overall positive result in terms of Affect (mean=4.16; sd±0.52).
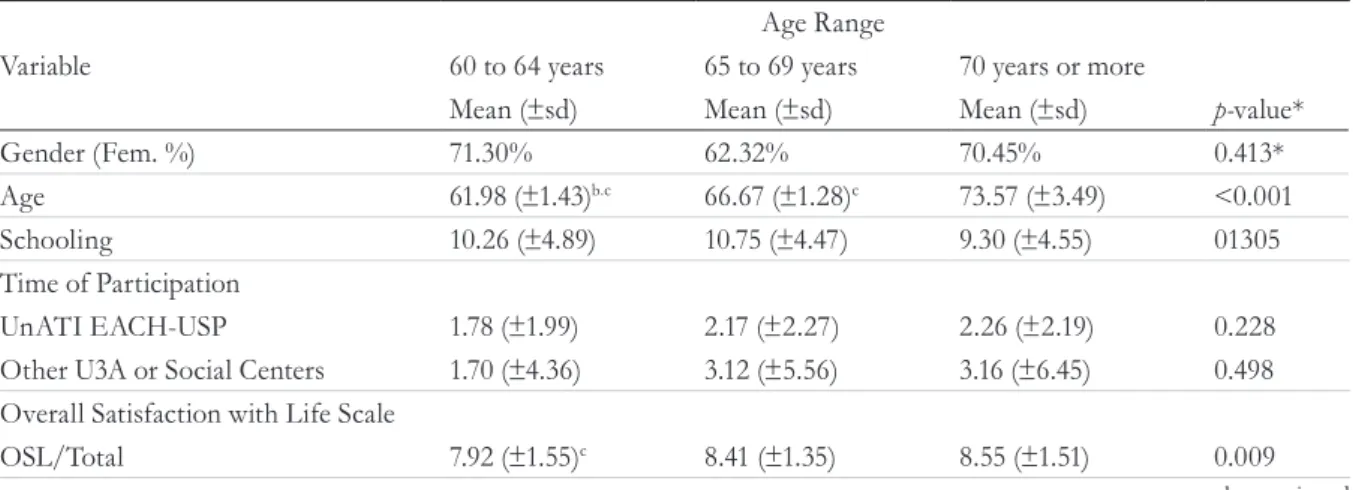
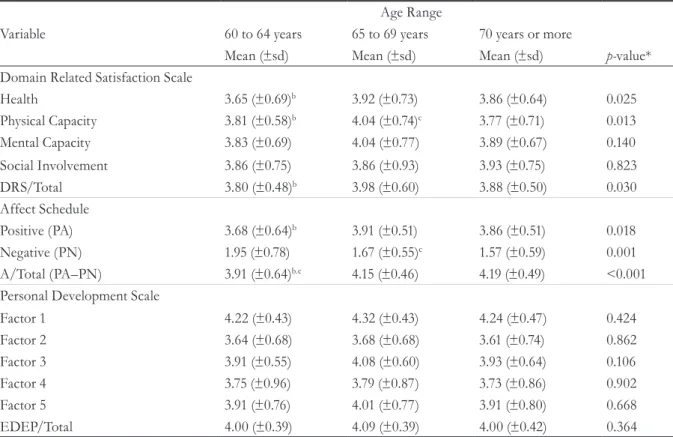
Table 2 reveals that there were statistically significant differences when the elderly of different age groups were compared: elderly persons aged equal to or greater than 70 years scored higher in the Overall Satisfaction with Life Scale (mean=73.57; sd±3.94) than the elderly aged 60 to 64 years.
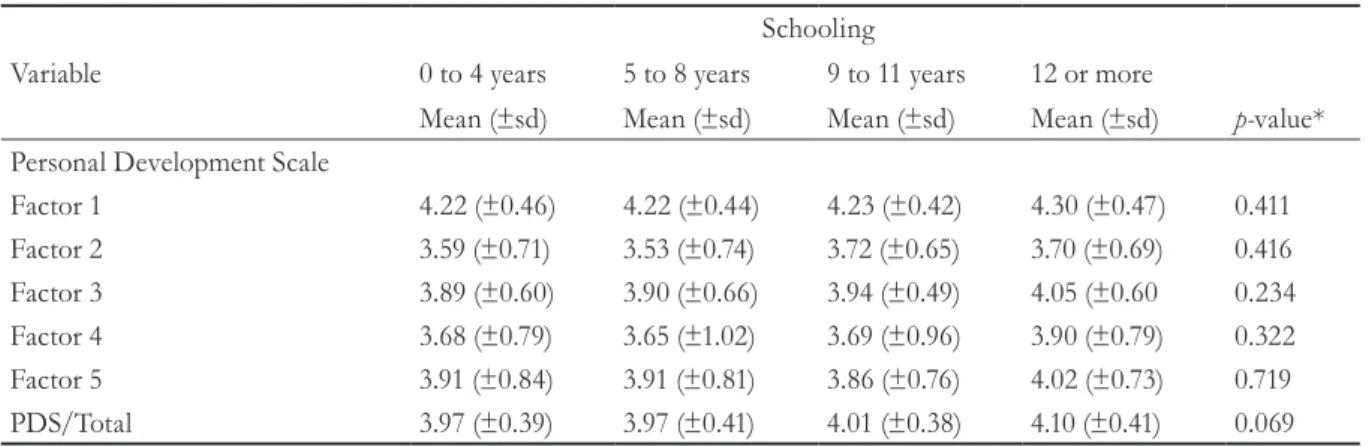
The results show that, with the exception of educational level, the elderly were statistically the same in relation to the other socio-demographic variables and well-being, as shown in Table 3.
Elderly persons with different times of participation at the UnATI EACH were statistically equal in relation to the other socio-demographic variables and well-being, as shown in Table 4.
344
to be continued
Table 1. Sociodemographic variables and well-being among male and female elderly persons. São Paulo, UnATI EACH, 2010.
Variable
Gender
Male Female
Mean(±sd) Mean(±sd) p-value*
Age 67.22 (±5.61) 66.97 (±5.43) 0.759
Schooling 10.88 (±4.89) 9.69 (±4.56) 0.040*
Time of Participation
UnATI EACH-USP 1.89 (±2.03) 2.11 (±2.18) 0.464
Other U3A or Social Centers 1.17 (±3.01) 3.19 (±6.18) 0.002*
Overall Satisfaction with Life Scale
OSL/Total 8.17 (±1.47) 8.29 ± (1.53) 0.408
Domain Related Satisfaction Scale
Health 3.90 (±0.72) 3.74 (±0.67) 0.044*
Physical Capacity 3.84 (±0.71) 3.86 (±0.66) 0.912
Mental Capacity 4.05 (±0.77) 3.84 (±0.67) 0.011*
Social Involvement 3.80 (±0.83) 3.92 (±0.78) 0.151*
DRS/ Total 3.91 (±0.61) 3.85 (±0.48) 0.294
Affect Schedule
Positive (PA) 3.88 (±0.53) 3.76 (±0.58) 0.083
Negative (NA) 1.64 (±0.66) 1.80 (±0.69) 0.066
A/Total 4.16 (±0.52) 4.02 (±0.58) 0.041*
Personal Development Scale
Factor 1 4.21 (±0.42) 4.27 (±0.46) 0.183
Factor 2 3.60 (±0.68) 3.66 (±0.71) 0.468
Factor 3 3.97 (±0.61) 3.96 (±0.59) 0.904
Factor 4 3.68 (±0.92) 3.79 (±0.89) 0.331
Factor 5 4.03 (±0.76) 3.90 (±0.78) 0.206
PDS/Total 3.99 (±0.37) 4.04 (±0.42) 0.278
*p-value related to chi-square test.
Table 2. Sociodemographic variables and well-being among elderly persons of different age ranges. São Paulo, UnATI EACH, 2010.
Variable
Age Range
60 to 64 years 65 to 69 years 70 years or more
Mean (±sd) Mean (±sd) Mean (±sd) p-value*
Gender (Fem. %) 71.30% 62.32% 70.45% 0.413*
Age 61.98 (±1.43)b.c 66.67 (±1.28)c 73.57 (±3.49) <0.001
Schooling 10.26 (±4.89) 10.75 (±4.47) 9.30 (±4.55) 01305
Time of Participation
UnATI EACH-USP 1.78 (±1.99) 2.17 (±2.27) 2.26 (±2.19) 0.228
Other U3A or Social Centers 1.70 (±4.36) 3.12 (±5.56) 3.16 (±6.45) 0.498
Overall Satisfaction with Life Scale
345 Continued from Table 2
to be continued
Variable
Age Range
60 to 64 years 65 to 69 years 70 years or more
Mean (±sd) Mean (±sd) Mean (±sd) p-value*
Domain Related Satisfaction Scale
Health 3.65 (±0.69)b 3.92 (±0.73) 3.86 (±0.64) 0.025
Physical Capacity 3.81 (±0.58)b 4.04 (±0.74)c 3.77 (±0.71) 0.013
Mental Capacity 3.83 (±0.69) 4.04 (±0.77) 3.89 (±0.67) 0.140
Social Involvement 3.86 (±0.75) 3.86 (±0.93) 3.93 (±0.75) 0.823
DRS/Total 3.80 (±0.48)b 3.98 (±0.60) 3.88 (±0.50) 0.030
Affect Schedule
Positive (PA) 3.68 (±0.64)b 3.91 (±0.51) 3.86 (±0.51) 0.018
Negative (PN) 1.95 (±0.78) 1.67 (±0.55)c 1.57 (±0.59) 0.001
A/Total (PA–PN) 3.91 (±0.64)b.c 4.15 (±0.46) 4.19 (±0.49) <0.001
Personal Development Scale
Factor 1 4.22 (±0.43) 4.32 (±0.43) 4.24 (±0.47) 0.424
Factor 2 3.64 (±0.68) 3.68 (±0.68) 3.61 (±0.74) 0.862
Factor 3 3.91 (±0.55) 4.08 (±0.60) 3.93 (±0.64) 0.106
Factor 4 3.75 (±0.96) 3.79 (±0.87) 3.73 (±0.86) 0.902
Factor 5 3.91 (±0.76) 4.01 (±0.77) 3.91 (±0.80) 0.668
EDEP/Total 4.00 (±0.39) 4.09 (±0.39) 4.00 (±0.42) 0.364
*p-value related to chi-square test; p-value related to Kruskal-Wallis test, followed by Multiple Comparisons z' values test: a. differs from 60 to 64 years; b. differs from 65 to 69 years; c. differs from 70 years or more; Factor 1: Self-realization, Personal Growth and Psychological Adjustment; Factor 2: Productivity; Factor 3: Care; Factor 4: Concern for next generations; Factor 5: Commitment to others.
Table 3. Sociodemographic variables and well-being among elderly persons with different degrees of schooling. São Paulo, UnATI EACH, 2010.
Variable
Schooling
0 to 4 years 5 to 8 years 9 to 11 years 12 or more
Mean (±sd) Mean (±sd) Mean (±sd) Mean (±sd) p-value*
Gender (Fem. %) 78.57% 68.49% 76.79% 59.57% 0.064*
Age 67.55 (±6.29) 67.47 (±5.16) 66.04 (±4.86) 67.11 (±5.68) 0.502
Schooling 3.76 (±0.80)a.b.c 6.89 (±1.14)b.c 10.36 (±0.82)c 15.12 (±2.98) <0.001
Length of Participation
UnATI EACH-USP 2.21 (±2.52) 2.01 (±2.06) 1.86 (±1.85) 2.10 (±2.19) 0.992
Other U3A or Social Centers 2.26 (±4.75) 3.15 (±6.53) 3.13 (±6.66) 1.88 (±3.83) 0.748 Overall Satisfaction with Life Scale
OSL/Total 8.43 (±1.67) 8.42 (±1.52) 8.25 (±1.42) 8.04 (±1.48) 0.287
Domain Related Satisfaction Scale
Health 3.77 (±0.75) 3.92 (±0.58) 3.77 (±0.80) 3.71 (±0.67) 0.436
Physical Capacity 3.90 (±0.53) 3.85 (±0.71) 3.96 (±0.76) 3.78 (±0.66) 0.497
Mental Capacity 3.77 (±0.70) 3.87 (±0.69) 3.88 (±0.74) 4.00 (±0.70) 0.204
Social Involvement 3.99 (±0.63) 3.89 (±0.86) 3.84 (±0.99) 3.85 (±0.68) 0.697
DRS/ Total 3.86 (±0.46) 3.90 (±0.51) 3.88 (±0.67) 3.84 (±0.47) 0.931
Affect Schedule
Positive (PA) 3.74 (±0.55) 3.79 (±0.61) 3.82 (±0.55) 3.82 (±0.56) 0.884
Negative (NA) 1.73 (±0.64) 1.66 (±0.72) 1.73 (±0.65) 1.84 (±0.70) 0.189
346
Continued from Table 3
Variable
Schooling
0 to 4 years 5 to 8 years 9 to 11 years 12 or more
Mean (±sd) Mean (±sd) Mean (±sd) Mean (±sd) p-value*
Personal Development Scale
Factor 1 4.22 (±0.46) 4.22 (±0.44) 4.23 (±0.42) 4.30 (±0.47) 0.411
Factor 2 3.59 (±0.71) 3.53 (±0.74) 3.72 (±0.65) 3.70 (±0.69) 0.416
Factor 3 3.89 (±0.60) 3.90 (±0.66) 3.94 (±0.49) 4.05 (±0.60 0.234
Factor 4 3.68 (±0.79) 3.65 (±1.02) 3.69 (±0.96) 3.90 (±0.79) 0.322
Factor 5 3.91 (±0.84) 3.91 (±0.81) 3.86 (±0.76) 4.02 (±0.73) 0.719
PDS/Total 3.97 (±0.39) 3.97 (±0.41) 4.01 (±0.38) 4.10 (±0.41) 0.069
*p-value related to chi-square test. p-value related to Kruskal-Wallis test, followed by Multiple Comparisons z' values test: a. differs from 5 to 8 years; b. differs from 9 to 11 years; c. differs from 12 years or more; Factor 1: Self-realization, Personal Growth and Psychological Adjustment; Factor 2: Productivity; Factor 3: Care; Factor 4: Concern for next generations; Factor 5: Commitment to others.
Table 4. Sociodemographic variables and well-being among elderly persons stratified by time of participation. São Paulo, UnATI EACH, 2010.
Variable
Time of Participation at UnATI EACH-USP
Freshman 1 Semester. 1 Year > 1 Year
Mean (±sd) Mean (±sd) Mean (±sd) Mean (±sd) p-value*
Gender (Fem. %) 65.43% 72.22% 62.79% 72.41% 0.579*
Age 66.69 (±5.76) 66.76 (±5.37) 67.12 (±5.32) 67.53 (±5.40) 0.618
Schooling 10.19 (±4.99) 10.06 (±4.47) 9.72 (±4.81) 10.14 (±4.54) 0.953
Length of Participation
UnATI EACH-USP 0.00 (±0.00) 1.00 (±0.00) 2.00 (±0.00) 4.61 (±1.65) <0.001**
Other U3A or Social Centers 1.73 (±4.73) 2.52 (±4.73) 3.37 (±6.55) 2.94 (±5.92) 0.209 Overall Satisfaction with Life Scale
OSL/Total 8.11 (±1.57) 8.39 (±1.37) 8.38 (±1.41) 8.24 (±1.59) 0.717
Domain Related Satisfaction Scale
Health 3.74 (±0.79) 3.80 (±0.74) 3.79 (±0.63) 3.84 (±0.60) 0.819
Physical Capacity 3.82 (±0.71) 3.92 (±0.69) 3.94 (±0.65) 3.81 (±0.66) 0.635
Mental Capacity 3.91 (±0.79) 3.92 (±0.69) 3.90 (±0.76) 3.89 (±0.63) 0.964
Social Involvement 3.77 (±0.90) 4.00 (±0.81) 3.96 (±0.67) 3.87 (±0.74) 0.330
DRS/ Total 3.83 (±0.62) 3.92 (±0.53) 3.91 (±0.49) 3.86 (±0.45) 0.675
Affect Schedule
Positive (PA) 3.73 (±0.62) 3.87 (±0.55) 3.80 (±0.55) 3.82 (±0.54) 0.459
Negative (NA) 1.83 (±0.67) 1.62 (±0.61) 1.70 (±0.69) 1.77 (±0.74) 0.237
A/Total 3.99 (±0.57) 4.16 (±0.51) 4.10 (±0.57) 4.06 (±0.59) 0.164
Personal Development Scale
Factor 1 4.21 (±0.46) 4.26 (±0.44) 4.33 (±0.44) 4.24 (±0.44) 0.521
Factor 2 3.51 (±0.69) 3.68 (±0.74) 3.76 (±0.66) 3.67 (±0.70) 0.153
Factor 3 3.97 (±0.58) 4.09 (±0.57) 3.93 (±0.68) 3.89 (±0.58) 0.223
Factor 4 3.92 (±0.93) 3.65 (±0.86) 3.72 (±0.87) 3.67 (±0.90) 0.175
Factor 5 3.97 (±0.84) 3.99 (±0.80) 3.96 (±0.84) 3.86 (±0.75) 0.634
PDS/Total 4.01 (±0.41) 4.02 (±0.40) 4.08 (±0.40) 4.00 (±0.40) 0.691
347
DISCUSSION
The analysis of the results of the sample of 265 students of UnATI EACH suggests that men are
more satisfied and happy than women. Yang13,
Plagnol and Easterlin14, in studies carried out in the
USA and in another 65 countries, found that men are happier than women after middle age. In the study
by Hansen and Slagsvold15, the authors found that
in a sample of 3,750 people aged between 40 and 85, both men and women presented similar patterns
of overall satisfaction with their lives, even though women are more likely to be widows and caregivers of spouses than men.
Neri et al.9 also confirmed the findings of the
present study. According to the authors, the SWB and self-concept of elderly women are more negative than those of men. The reasons for these data are well-known: women are more ill, dependent, alone, poor and suffer more medical complaints than men, and have lower expectations; they tend to be considered less attractive and less valued than men.
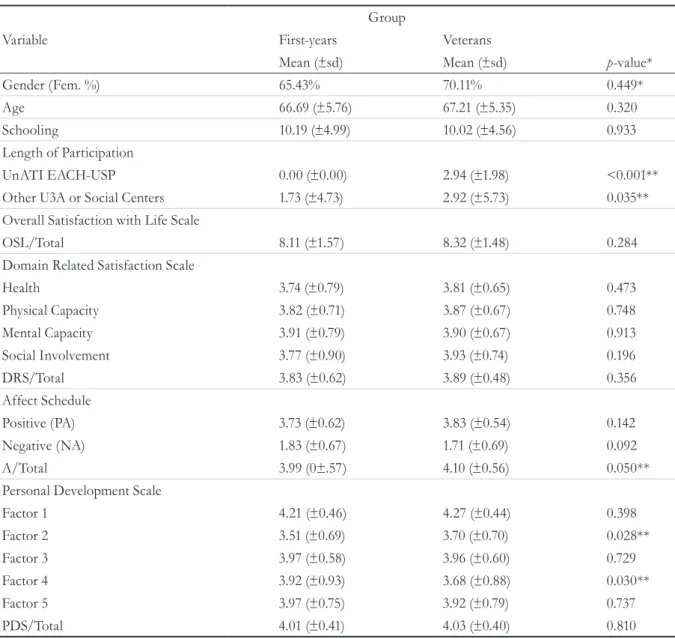
Table 5. Sociodemographic variables and well-being among elderly persons stratified by length of time spent in the program, first-years or veterans. São Paulo, UnATI EACH, 2010.
Variable
Group
First-years Veterans
Mean (±sd) Mean (±sd) p-value*
Gender (Fem. %) 65.43% 70.11% 0.449*
Age 66.69 (±5.76) 67.21 (±5.35) 0.320
Schooling 10.19 (±4.99) 10.02 (±4.56) 0.933
Length of Participation
UnATI EACH-USP 0.00 (±0.00) 2.94 (±1.98) <0.001**
Other U3A or Social Centers 1.73 (±4.73) 2.92 (±5.73) 0.035**
Overall Satisfaction with Life Scale
OSL/Total 8.11 (±1.57) 8.32 (±1.48) 0.284
Domain Related Satisfaction Scale
Health 3.74 (±0.79) 3.81 (±0.65) 0.473
Physical Capacity 3.82 (±0.71) 3.87 (±0.67) 0.748
Mental Capacity 3.91 (±0.79) 3.90 (±0.67) 0.913
Social Involvement 3.77 (±0.90) 3.93 (±0.74) 0.196
DRS/Total 3.83 (±0.62) 3.89 (±0.48) 0.356
Affect Schedule
Positive (PA) 3.73 (±0.62) 3.83 (±0.54) 0.142
Negative (NA) 1.83 (±0.67) 1.71 (±0.69) 0.092
A/Total 3.99 (0±.57) 4.10 (±0.56) 0.050**
Personal Development Scale
Factor 1 4.21 (±0.46) 4.27 (±0.44) 0.398
Factor 2 3.51 (±0.69) 3.70 (±0.70) 0.028**
Factor 3 3.97 (±0.58) 3.96 (±0.60) 0.729
Factor 4 3.92 (±0.93) 3.68 (±0.88) 0.030**
Factor 5 3.97 (±0.75) 3.92 (±0.79) 0.737
PDS/Total 4.01 (±0.41) 4.03 (±0.40) 0.810
348
In relation to the positive results obtained by men in terms of satisfaction with health, personal mental capacity and when compared to other people of the
same age, Sposito et al.16 found in a study with 125
elderly persons that men are more satisfied with their health in comparison with other individuals of the same age. The same finding occurred in relation to the evaluation of mental capacity. A study by
Lima-Silva et al.17 based on a sample of 383 elderly residents
of the neighborhood of Ermelino Matarazzo in the municipal region of São Paulo, found that men exhibited a greater cognitive performance than women, perhaps due to higher schooling. The opposite was identified in a study with a sample of elderly Europeans. In this study, the cognitive performance of women was better than that of men, a finding justified by the increase in educational levels
in the last four decades in the European continent18.
The data presented may suggest that satisfaction with the mental ability domain may be influenced by socioeconomic factors, which can result in higher cognitive performance.
The results related to age and the SWB indicators of this study are in keeping with data in literature. In the first study identified in non-Brazilian literature on the relationship between age and life satisfaction,
Campbell et al.19 found similar data to the findings of
the research at UnATI EACH. The authors identified that older people, when compared to younger groups, were more satisfied and happy with life.
For Diener and Suh20, the elderly have a lower
aspirational level than younger people because they are more prepared, or in other words, they have been taught not to expect so much from life. Older people adjust their goals to their resources and competencies and thus have lower expectations of achievement and pleasure than younger people, and so their assessments of life are more positive. This conclusion exemplifies the role of the self in regulating individual functioning and in determining the sense of SWB in old age.
Authors such as Yang13, Charles and Carstensen21
and Sposito et al.22 affirm that SWB does not decline
with age, a fact verified in the present study. In the studies of these researchers all the findings indicated a greater satisfaction with life among elderly persons and reported that advanced age is related to an increase in the capacity to regulate the emotions
and the expression of more positive affections and lower levels of negative affections.
Elderly persons aged over 65 years presented high SWB measurements. These data suggest that this group may be more adapted to the loss of their family and social roles than younger elderly persons (60-64).
These results are also consistent with the Lifespan Perspective in Psychology, described by Baltes and
Carstensen23. The authors speak of increasing wisdom
and emotional intelligence with the advancement of age and state that the reduction in negative affective states is a result of increasing wisdom. The findings are congruent with the Socioemotional Selectivity
Theory of English and Carstensen11, where elderly
persons have a greater ability to self-regulate emotions and see situations more positively.
In relation to the data obtained in the domains of comparisons of satisfaction with health, physical and mental capacity with people of the same age,
Sposito et al.16 found positive results among older
elderly people resident in the city of Campinas, based on the same scale used in the UnATI EACH study.
Cheng et al.24 conducted two studies to evaluate
349
determining self-assessment of health (study 1) and in fact is effective in partially compensating for the negative effect of the increasing physical symptoms that accompany aging (study 2).
Schooling is described in literature as a strong determinant of SWB, especially among young and
middle-aged people25. This data explains the lack
of significant results for this variable in the present study, as the sample was comprised of elderly people. The fact that men had higher levels of schooling (M = 10.88) did not reflect the overall satisfaction with life score.
Similar data were verified by Yang13. The author
states that schooling is strongly related to happiness at all ages except among the elderly. In a systematic
review conducted by Read et al.26, the data revealed
that income is more strongly associated with well-being than education. In this review, education was more associated with self-perception of health than with the evaluation of satisfaction with life.
It can be concluded that both schooling and opportunities for education in general offer important attributes for an individual to participate in activities to acquire knowledge and form social connections, which are linked to SWB, but which are not predictors of SWB, especially for the sample of this study.
To evaluate the effect of the time of participation in the activities of the UnATI EACH on the SWB and PWB of the students, participants were characterized as First-years: beginners in the program (first semester of 2010) and Veterans: those with a participation time equal to or greater than one semester. The group of veteran students were more emotionally positive than the first-years, since they had high rates of positive affect. They were also happier and less demotivated than the first-years, and described a desire to be productive, while the first-years were more concerned about the next generations.
The positive emotional well-being reported by veterans suggests that UnATI EACH provides significant social and educational situations. They are happy with the network of social relations established and motivated to learn. This conclusion is confirmed
by authors such as Charles and Carstensen21 who
assert that elderly persons tend to maintain the maximum number of positive experiences with their networks of social relationships, avoiding situations or people who result in negative feelings.
It can also be emphasized that regular social contacts, such as those provided by UnATI EACH, act as emotional support to participants. The findings
of a study by Matz-Costa et al.27 point to the benefits
of continuing education as an informational and instrumental source for the needs of the elderly. It acts as an important stimulus for interpersonal relations and the acquisition of new knowledge.
The sense of productivity described by veteran students expresses commitment to the people closest to them and their own contribution to society. This contribution is translated in literature as the desire to guide and teach and, consequently, to be part of the memory of the group. Similar data were
verified by Queroz28 in surveys which analyzed the
PWB of middle-aged and elderly people through the Personal Development Scale. According to the author, positive self-reports about psychological adjustment predominated among the elderly, who expressed their concerns and goals as geared towards specific individuals and groups.
Associations were made between the time and the characteristics of participation in the UnATI EACH and in other U3A or Social Centers. From this association, three groups were generated: Group I (first-years in all programs), Group II (first-years from UnATI EACH, but participants for a semester or more in other institutions of this type, and veterans of UnATI EACH who had never participated in other programs) and Group III (veterans in all programs with a time of participation of one semester or more).
Although a causal relationship was not established, a participation time of over six months in UnATI EACH and other U3A and Social Centers seemed to be a determining factor for positive SWB and PWB indices in the sample studied. In agreement with the results obtained in the current study, researchers such
as Ordonez et al.29 described the positive impact
350
Regard i ng t he sense of psycholog ica l adjustment, factors of the Personal Development Scale (productivity, care and concern for the next generations) are related to generative concerns, and
for Erikson30 generability is an important component
of the development of adulthood. These factors would be more directed toward interpersonal psychological adjustment. Generative actions are expressed in the exercise of adult roles, in the family, at work, in the community, in social institutions and in society
in general. According to Erikson,30 generability
is an indicator of adjustment: generative actions manifest themselves from adulthood through care and commitment to caring for people (procreation), dedicating time and energy to one’s productive life (productivity) and ideas (creativity) through which the individual learns to care about themselves. The fulfillment of these tasks is socially valued. According
to McAdams31, generative concern is positively
associated with PWB measures and personality traits – extroversion, affability, openness to experiences and emotional stability, and low tendency to neurosis.
It is important to note some limitations of the present study. The most important of these is that the sample is not representative of the Brazilian elderly population, since the average level of schooling is higher. In theory, it can be said that it is representative of the population attending educational programs for the elderly. It may also be considered a limitation that students already have the characteristics of a successful and active aging, since they have successfully enrolled in the programs.
Additionally, the impact of the intensity of participation in the activities (number of workshops and frequency) was not investigated.
CONCLUSION
It can be concluded that the Open University for the Third Age of the School of Arts, Sciences and Humanity has supported the desire to establish important and memorable connections with others. Elderly persons want the program to provide them with knowledge that can generate meaningful actions and leave a personal legacy.
It was concluded, then, that permanent education for the elderly, provided by universities and through other sources, contributes to maintaining high rates of satisfaction with life and positive feelings. Older people can assess their own development trajectory and commitment to society, and consider their own commitment to pursuing an ideal of personal excellence. It can be said that living through the experience of aging as a privileged moment of life is also something that is learned in an educational establishment.
It is important to note that the empirical work carried out so far has been cross-sectional. Future research should examine the action of time and the associations of subjective and psychological well-being in UnATI students longitudinally.
A strength of this study is that it is pioneering in Brazilian literature. In terms of both the representative number of elderly people from an Open University of the Third Age surveyed and the subject investigated, there are no other studies that have used instruments for the joint evaluation of the two constructs - subjective and psychological well-being – and verified their possible correlations.
REfERENCES
1. Da Silva HS, De Lima AMM, Galhardoni R. Envelhecimento bem-sucedido e vulnerabilidade em saúde: aproximações e perspectivas. Intervace. 2014:1-11.
2. Ryff CD. Happiness is everything, or is it? Explorations on the meaning of psychological well-being. J Pers Soc Psychol. 1989;57(6):1069-81.
3. Neri LA. Fragilidade e qualidade de vida na velhice. Campinas: Alínea. 2013. p.16-29.
4. Diener E, Tay L. Subjective well-being and human welfare around the world as reflected in the Gallup World Poll. Int J Psychol. 2015;50(2):135-49.
5. Diener E. The remarkable changes in the science of subjective well-being. Perspect Psychol Sci. 2013;8(6):663-6.
351 7. Lawton MP. A multidimensional view of quality of
life in frail elders. The concept and measurement of quality of life in the frail elderly. In: Birren JE, Lubben JE, Rowe JC, Deufchman DE. The Concept and measurement of quality of life in the frail elderly. Amsterdam: Elsevier; 1991. p. 4-27.
8. Steptoe A, Deaton A, Stone AA. Subjective wellbeing, health, and ageing. Lancet. 2015;385(9968):640-8.
9. Neri AL, Batistoni SST, Ribeiro CC. Bem-estar psicológico, saúde e longevidade. In: Freitas EV, Py L, editores. Tratado de Geriatra e Gerontologia. 4ª ed. Rio de Janeiro: Guanabara-Koogan; 2016. p.1458-67.
10. Jivraj S, Nazroo J, Vanhoutte B, Chandola T. Aging and subjective well-being in later life. J Gerontol Ser B Psychol Sci Soc Sci. 2014;69(6):930-41.
11. English T, Carstensen LL. Socioemotional selectivity theory. In: Pachana AN, editor. Encyclopedia of Geropsychology. Singapore: Springer Singapore; 2015. p. 1-6.
12. Mackowicz J, Wnek-Gozdek J. “It’s never too late to learn”–How does the Polish U3A change the quality of life for seniors? Educ Gerontol. 2016;42(3):186-97.
13. Yang Y. Social inequalities in happiness in the United States, 1972 to 2004: an age-period-cohort analysis. Am Socioll Rev. 2008;73(2):204-26.
14. Plagnol AC, Easterlin RA. Aspirations, attainments, and satisfaction: Life cycle differences between American women and men. J Happiness Stud. 2008;9(4):601-19.
15. Hansen T, Slagsvold B. The age and subjective well-being paradox revisited: a multidimensional perspective. Norsk epidemiol. 2012;22(2):187-92.
16. Sposito G, Diogo MJDE, Cintra FA, Neri AL, Guariento ME, Sousa MLR. Relações entre bem-estar subjetivo e mobilidade e independência funcional por função de grupo de faixas etárias e de gêneros em idosos. Acta fisiátrica. 2010;17(3)103-8.
17. Da Silva TBL, De Oliveira ACV, Paulo DLV, Malagutti MP, Danzini VMP, Yassuda MS. Treino cognitivo para idosos baseado em estratégias de categorização e cálculos semelhantes a tarefas do cotidiano. Rev Bras Geriatr Gerontol. 2011;14(1):65-74.
18. Weber D, Skirbekk V, Freund I, Herlitz A. The changing face of cognitive gender differences in Europe. Proc Natl Acad Sci U.S.A. 2014;111(32):11673-8.
19. Campbell A, Converse PE, Rodgers WL. The quality of American life: Perceptions, evaluations, and satisfactions. New York: Russell Sage Foundation; 1976.
20. Diener E, Suh E. Measuring quality of life: economic, social, and subjective indicators. Soc Indicators Res. 1997;40(1-2):189-216.
21. Charles S, Carstensen LL. Social and emotional aging. Ann Rev Psychol. 2010;61:383.
22. Sposito G, D'Elboux MJ, Neri AL, Guariento ME. A satisfação com a vida e a funcionalidade em idosos atendidos em um ambulatório de geriatria. Ciênc Saúde Coletiva. 2013;18(12):3475-82.
23. Baltes MM, Carstensen LL. The process of successful aging: Selection, optimization, and compensation. In: Staudinger UM, Lindenberger U. Understanding human development: [ place unknown]: Springer; 2003:81-104.
24. Cheng ST, Fung H, Chan A. Maintaining self-rated health through social comparison in old age. J Gerontol Ser B Psychol Sci Soc Sci. 2007;62(5):277-85.
25. George LK. Still happy after all these years: research frontiers on subjective well-being in later life. J Gerontol Ser B Psychol Sci Soc Sci. 2010;65(3):331-9.
26. Read S, Grundy E, Foverskov E. Socio-economic position and subjective health and well-being among older people in Europe: a systematic narrative review. Aging Ment Health. 2016;20(5):529-42.
27. Matz-Costa C, Besen E, James JB, Pitt-Catsouphes M. Differential impact of multiple levels of productive activity engagement on psychological well-being in middle and later life. Gerontologist. 2014;54(2):277-89.
28. Queroz NC. Bem-estar psicologico: investigações acerca de recursos adaptativos em adultos e na meia-idade [tese]. Campinas: Universmeia-idade Estadual de Campinas; 2008.
29. Ordonez TN, Batistoni SST, Cachioni M. Síntomas depresivos en adultos mayores participantes de una universidad abierta a la tercera edad. Rev Esp Geriatr Gerontol. 2011;46(5):250-5.
30. Erikson EH. O ciclo de vida completo. Porto Alegre: ARTMED; 1998.
31. McAdams DP. The positive psychology of adult generativity: Caring for the next generation and constructing a redemptive life. Positive Psychology: Springer; 2013:191-205.